
Chemical Engineering and Processing 41 (2002) 487 – 499
Simulation of convection-microwave drying for a shrinking
material
E.C.M. Sanga
a,
*, A.S. Mujumdar
a,b,c
, G.S.V. Raghavan
c
a
Department of Chemical Engineering, McGill Uni
6ersity, Wong Bldg.,
3610
Uni
6ersity Street, Montreal, Quebec, Canada H
3
A
2
B
2
b
Department of Mechanical Engineering, National Uni
6ersity of Singapore,
10
Kent Ridge Crescent, Singapore
119260
, Singapore
c
Department of Agricultural and Biosystems Engineering,
21111
Lake shore Road, Ste-Anne-de-Belle
6ue, Quebec, Canada H
9
X
3
V
9
Received 15 May 2001; received in revised form 22 August 2001; accepted 22 August 2001
Abstract
The transient conservation equations for heat and mass transfer in a drying solid were solved using a finite element technique.
The material being dried is a discretely non-homogeneous material. It is subjected to a convection boundary condition. The
shrinkage of the material surrounding a non-shrinking, low loss factor material is treated numerically by continuously redefining
the computational domain of the problem. Results of the numerical prediction of drying rates and temperature distribution within
the drying solid were compared with experimental results and found to be in good agreement. Local convection heat transfer
boundary conditions were prescribed with the use of a computational fluid dynamic code. Cylindrical pieces of carrot with a
coaxial cylindrical insert of Teflon were used as the non-homogeneous models for the experimental and computational study.
© 2002 Elsevier Science B.V. All rights reserved.
Keywords
:
Combined mode drying; Non-homogeneous material; Teflon; Heat and mass transfer; Shrinkage; Carrot; Temperature
www.elsevier.com/locate/cep
1. Introduction
The objective of any drying process is to produce a
dried product of desired quality at minimum cost and
maximum throughput possible. A biological material
undergoes some physical and chemical changes that can
affect the desired final product quality. Traditionally,
the drying of biological materials has been accom-
plished by convective drying where heated air acts as
the heat and moisture carrier. Drying generally takes
place in the falling rate period where the drying rate is
controlled by diffusion of water from interior of the
product to the surface. In conventional drying, the
drying rate is higher at the beginning of drying and
gradually falls as the evaporation front recedes result-
ing in a longer lower drying time. The temperature is
the highest at the surface and lower in the interior. The
drying process relies solely on conduction of heat from
the surface to the interior resulting in case hardening
of the material. Apart from diminished final product
quality, hot air drying suffers from high-energy
consumption.
In microwave and dielectric drying, the volumetric
heat generation in wet samples due to directly absorbed
electromagnetic energy by the water molecules, results
in higher interior temperature and thus the water re-
moval rate is faster than in convective drying [1,2]. The
advantages of microwave energy has led to attempts to
use this energy in many industrial applications includ-
ing heating, drying, sintering, sterilization, tempering,
microwave activated chemical reactions, etc. [3 – 6]. Ap-
plying microwave energy to drying is a good approach
to some of the problems associated with conventional
hot air drying methods [7,8]. However, microwave dry-
ing has also been associated with physical damage to
the products e.g. scorching, over heating or charring
and uneven temperature distribution. Such physical
damage is the result of local temperatures rising contin-
uously even though the loss factor of material being
dried decreases with the reduction in moisture content.
* Corresponding author. Tel.: + 1-514-398-4000/7632; fax: + 1-
514-398-6678.
E-mail address
:
esanga@po-box.mcgill.ca (E.C.M. Sanga).
0255-2701/02/$ - see front matter © 2002 Elsevier Science B.V. All rights reserved.
PII: S 0 2 5 5 - 2 7 0 1 ( 0 1 ) 0 0 1 7 0 - 2

E.C.M. Sanga et al.
/
Chemical Engineering and Processing
41 (2002) 487 – 499
488
Several experimental and modeling studies are avail-
able in the literature on the effect of microwave fields
on homogeneous materials. Some studies have been
done to investigate the use of intermittent microwave
drying and the effect on shrinkage [9,10]. Intermittent
microwave drying studies, both experimental and nu-
merical have been done to improve the quality of dried
product and even the temperature distribution of
product during drying. Zhang and Mujumdar [11] have
presented a simulation study on deformation and stress
analysis of porous capillary bodies during intermittent
volumetric thermal heating. Their work has shown that
intermittent microwave drying is an effective way of
raising the energy utilization ratio in drying process.
The study also showed that intermittent exposure to
microwave energy may have the effect of improving
dried product quality such as reduction of stress.
However, little is available in the literature on the
effect of microwave fields on discretely non-homoge-
neous materials. The unique microwave heating charac-
teristics of materials can be utilized to selectively heat
target layers in the discretely non-homogeneous materi-
als. By introducing a minimally lossy material layer at
the center of a biological material a special case of a
discretely non-homogeneous material is formed. In this
way the microwave field interaction in the material is
altered; this can serve as a way to reduce the higher
temperatures in the sample interior so as to reduce
overheating.
The present work deals with experimental and math-
ematical modeling for non-homogenous materials un-
der combined microwave field and convective energy
input. The specific objectives of this study are:
1. To formulate the governing heat and mass transport
equations and appropriate boundary conditions for
non-homogeneous discrete materials.
2. To solve numerically the coupled heat and mass
transport equations.
3. To compare the predicted moisture and temperature
distributions with experimental data.
2. Heat and mass transfer equations
Modeling of drying process poses a challenge as it
involves non-linear coupled heat and mass transfer
equations. This is further complicated since shrinkage
of the material occurs during drying due to moisture
migration. Volumetric heating of material by mi-
crowave result into moisture being pumped from the
interior to the surface where drying takes place. The
internal liquid transport process is in the liquid phase
and the evaporation process takes place on the external
surface of the material.
The main assumptions for the present work to de-
scribe combined microwave fields and convection dry-
ing of cylindrical non-homogeneous materials are:
1. The initial temperature of layers of material forming
a non-homogeneous material is uniform.
2. The initial moisture content of layers of material
forming
a
non-homogeneous
material
is
not
uniform.
3. Both heat and moisture flows are considered in
radial and axial directions (r and z directions).
4. Shrinkage of material is significant to be considered.
5. Heat transfer is by conduction and convection only
and no radiation is considered.
6. The diffusivity is described in terms of the product
temperature and moisture content.
7. The total microwave heat generation term is the
total of axial and radial component.
The conservation of mass and energy for the com-
posite material give the following set of governing
equations:
(X
(t
= D
n
9
2
X
(1)
C
pn
z
n
(T
(t
=
9(K
n
9T)+Q(r, z, t)
(2)
where n = 1 and 2 refers to the inner and outer layer of
material forming the non-homogenous composite mate-
rial, respectively, and D is the diffusivity (m
2
/s); X the
moisture content (kg/kg dry basis); k the thermal con-
ductivity (W/m K);
z the density (kg/m
3
); C
p
the heat
capacity (J/kg K); and Q is the microwave source term
(W/m
3
).
The empirical model for calculating moisture diffu-
sivity as a function of moisture and temperature used
for this study is the one reported by Panagiotou and his
colleagues [12]:
D =
1
1 + X
D
0
exp
−
E
0
R
1
T
−
1
T
r
n
+
1
1 + X
D
i
exp
−
E
i
R
1
T
−
1
T
r
n
(3)
where D (m
2
/s) is the moisture diffusivity; X (kg/kg db)
the material moisture content, T (°C) the material
temperature; T
r
= 60 °C a reference temperature, and
R = 0.0083143 kJ/mol K is the ideal gas constant; D
0
(m
2
/s) the diffusivity at moisture X = 0 and temperature
T = T
r
; D
i
(m
2
/s) the diffusivity at moisture X =
and
temperature T = T
r
; E
0
(kJ/mol) the activation energy
of diffusion in dry material at X = 0 and E
i
(kJ/mol) is
the activation energy of diffusion in wet material at
X =
.
The estimated parameters D
0
, D
i
, E
0
and E
i
are based
on data from various authors at reference temperature
T
r
after the data were fitted to model using a non-linear
regression analysis mode [12].
The proposed model uses the estimated parameters in
Table 1 below. The estimated parameters are based on
data from various authors.

E.C.M. Sanga et al.
/
Chemical Engineering and Processing
41 (2002) 487 – 499
489
Expressing the governing equations for heat and
mass transfer (Eqs. (1) and (2)) in terms of cylindrical
coordinate system (r,
q, z) we have:
(X
(t
= D
n
(
2
X
(r
2
+ D
n
1
r
(X
(r
+ D
n
(
2
X
(z
2
(4)
C
pn
z
n
(T
(t
= D
n
(
2
T
(r
2
+ D
n
1
r
(T
(r
+ D
n
(
2
T
(z
2
+ Q(r, z, t)
(5)
2
.
1
. Boundary and initial conditions
The coupled heat and mass transfer equations are
augmented with the appropriate initial and boundary
conditions as follows;
2
.
1
.
1
. Initial conditions
Initially the material is assumed to be at uniform
temperature and non-uniform moisture content, thus
initial conditions can be expressed as follows:
At time t = 0
T = T
0
(r, z)
X = X
01
(r
1
, z),
X = X
02
(r
2
, z)
2
.
1
.
2
. Boundary conditions
Due to symmetry of the material about the two
center axes (r = 0 and z = 0) the boundary conditions
are:
(X
(t
)
(r = 0, H/2 = 0,t)
= 0,
(T
(t
)
(r = 0, H/2 = 0,t)
= 0
At drying surfaces (S2 and S3) it is assumed that
both heat and moisture is lost through convection and
that no radiation takes place thus:
D
n
(X
(r
n
r
+ D
n
(X
(z
n
z
+ h
m
(X
− X) = 0
(6)
k
n
(T
(r
n
r
+ k
n
(T
(z
n
z
+ h
T
(T
− T) = 0
(7)
where h
m
is the mass transfer coefficient (kg/m
2
s); h
T
the heat transfer coefficient (W/m
2
K); T
the ambient
temperature (K); X
the moisture content in air (kg/kg)
and n
r
and n
z
are the direction cosines of the outward
unit vector normal to the surface.
Further more Teflon and biological material are as-
sumed to be in perfect contact at r = R/2 and hence it
is appropriate to impose the following boundary condi-
tions at the interface
k
1
(T
1
(r
= k
2
(T
2
(r
D
1
(X
1
(r
= D
2
(X
2
(r
3. Microwave source term (Q)
Heat input to the sample is supplied by microwave
being absorbed by the sample. The amount of volumet-
ric heat generation (Q) depends on the dielectric prop-
erties of materials, the frequency and the intensity of
microwave applied. Both dielectric constant and loss
factor are functions of moisture and temperature at a
particular location in the material. The heat generated
at a particular location in the material is also depended
on the distance from the surface on which microwave is
incident. In this study microwave fields are assumed to
be planar wave propagating perpendicular to the mate-
rial surface. The microwave intensity at the material
surface is assumed to be uniform. The microwave en-
ergy entering the sample from different sides (radial
and axial directions) decreases exponentially and is
considered separately.
The microwave source term (Q(x)) at some depth
from the surface of material is determined from its
attenuation factor according to the Lambert’s mi-
crowave absorption relationship [13].
Q(x) = Q
0
&
x
0
exp( − 2
ix)dx
(8)
Where x is the depth from surface along axial and
radial direction, Q(x) is the microwave power dissi-
pated at depth x, Q
0
is the incident microwave flux at
the surface of material and
i is attenuation constant
and is defined in terms of dielectrics properties of
material and the incident wavelength.
The attenuation constant of material is expressed in
terms of dielectric loss factor and dielectric constant
[13] as:
i=
2
y
u
0
'
m%[{1+tan
2
l}
1/2
− 1]
2
(9)
where
u
0
is wavelength in vacuum and tan
l is defined
in terms of dielectric properties of material as:
Table 1
Parameter estimates of the model presented
Number of papers
S.D. (m
2
/s)
E
0
(kJ/mol)
E
i
(kJ/mol)
D
i
(m
2
/s)
D
0
(m
2
/s)
Number of data
Material
90
1.69×10
−6
11.3
13.9
Carrot
1.54×10
−6
9
2.47×10
−6
E.C.M. Sanga et al.
/
Chemical Engineering and Processing
41 (2002) 487 – 499
490
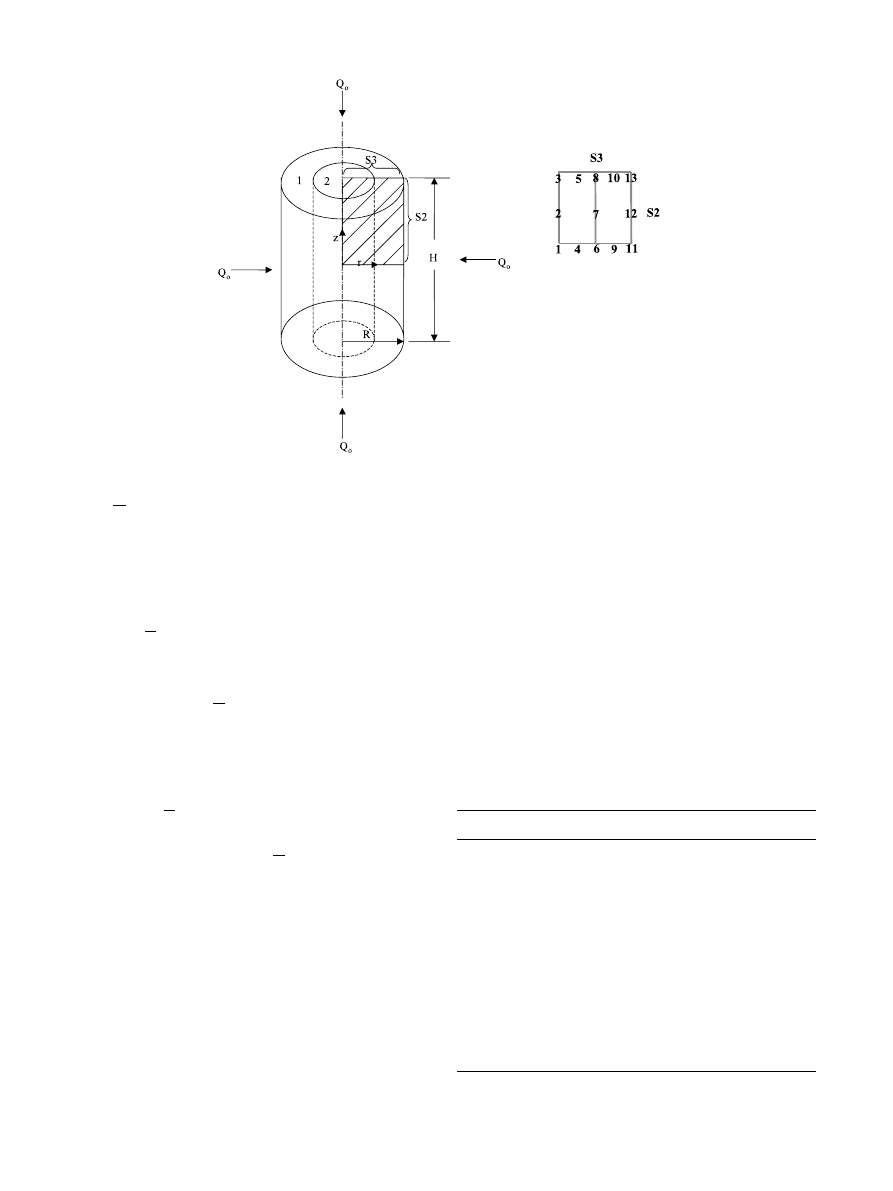
Fig. 1. Material geometry and finite element mesh for 12.5 × 12.5 mm quarter of sample geometry with 13 nodal positions.
tan
l=
m¦
m%
The total microwave generation term will be the sum
of radial and axial microwave radiation at a particular
depth [13]:
Radial component,
Q
r
= Q
0r
2
i
R
r
exp( − 2
i[R−r])
Similarly for axial component,
Q
z
= Q
0z
2
iexp
− 2
i
H
2
− z
n
The total microwave radiation will be the sum of
both radial and axial component from all directions
expressed as:
Q(r, z, t) = 2
i
R
r
Q
0r
exp( − 2
i[R−r])
+ 2
iQ
0z
exp
− 2
i
H
2
n
− z
(10)
The radial and axial microwave fluxes (Q
0r
and Q
0z
)
on the sample surface are assume to be equal (Fig. 1).
Material transport and dielectric properties necessary
are summarized in Table 2 below.
4. Numerical analysis
The systems of the developed equations of heat and
mass transfer coupled to the microwave generation
term were solved numerically. A two-dimensional
axisymmetric finite element grid of a quarter section of
a cylindrical sample was considered. Using the program
required mesh was generated. The elemental equations
were obtained from the above non-linear coupled par-
tial differential equations by transforming them using
the Galerkin’s weighed residual method.
5. Experimental set-up, materials and methods
In order to compare experimental and numerical
analysis result a laboratory scale microwave dryer was
used for experimental work. The dryer consists of a
Table 2
Material properties and dielectric properties of carrot and Teflon
Property
Value/expression
Units
Carrot
m%
(−)
117.6−2.6×10
−2
×T+1.8×X
− 7.3×10
−2
z
b
(−)
m¦
12.2+1.4×10
−3
×T+9.6×10
−2
× X+3.9×10
−3
×
z
b
C
p
3.90
(kJ/kg per K)
K
(W/m per K)
0.577
z
b
1080
(kg/m
3
)
h
T
10.5 (On surface S2)
(W/m
2
per K)
(W/m
2
per K)
5.5 (On surface S3)
h
T
Teflon
C
p
1.1723
(kJ/kg per K)
(W/m per K)
k
2.9415
z
b
(kg/m
3
)
2200

E.C.M. Sanga et al.
/
Chemical Engineering and Processing
41 (2002) 487 – 499
491
Fig. 2. Experimental and average predicted moisture content for a special case of carrot samples embedded with Teflon (microwave density 0.30
W/g, 45 °C, 1.0 m/s air).
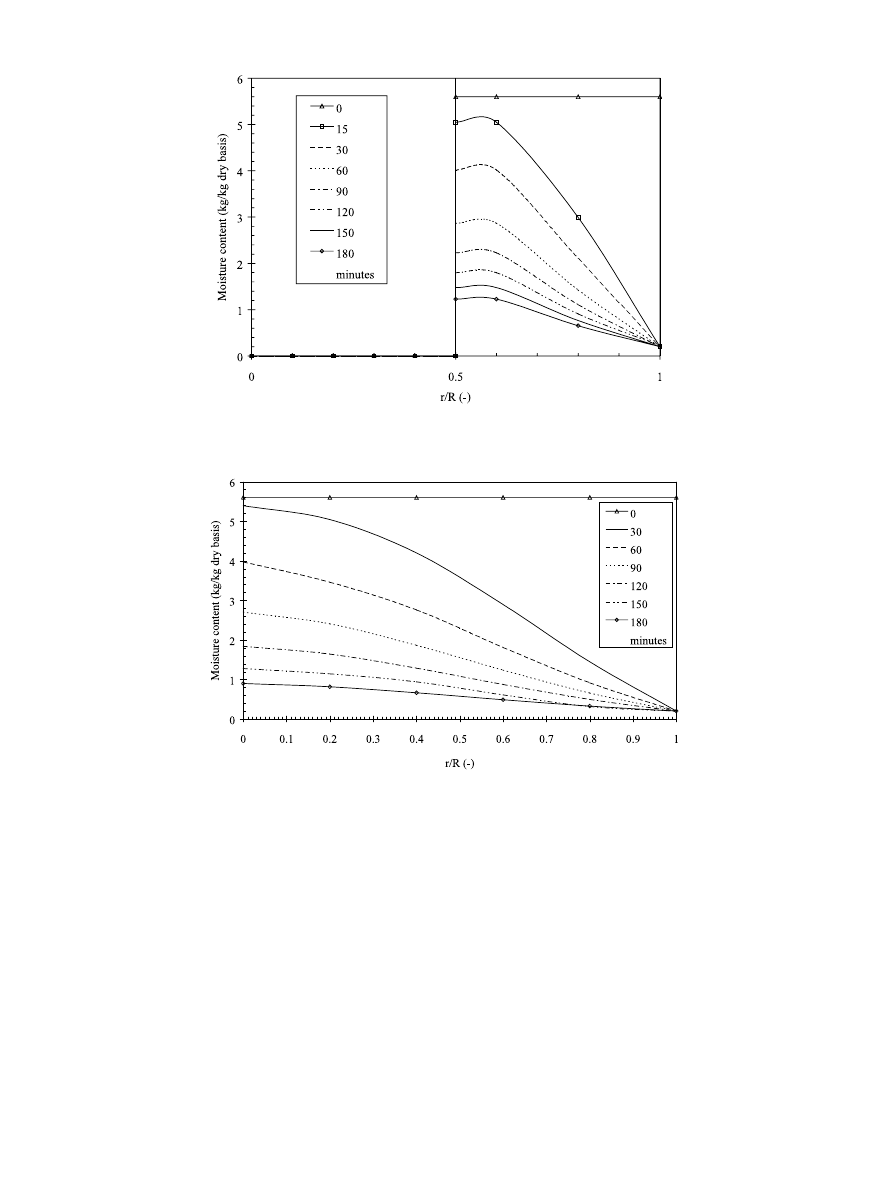
Fig. 3. Predicted moisture distribution of carrot samples on horizontal symmetry plane (z = 0) at different values of time during MW convection
drying (0.25 W/g and 45 °C air, 1.0 m/s).
microwave generator (750 W and 2450 MHz), a cavity
(40 × 35 × 25 cm), a hot air system, a data acquisition
and control system (Agilent No. 34970A). The mi-
crowave generator has variable power that permits
control of microwave power output in a continuous
mode. For this work carrots and Teflon were used as
model material. Details of measurement method and
experimental set-up can be found in Sanga et al. (2000a,
b, c) [14 – 16].
6. Results and discussion
6
.
1
. Moisture content
Fig. 2 presents the comparison between the model
prediction and experimental results for the average
moisture content for model of non-homogeneous mate-
rial. In this case a special case of carrot samples embed-
ded with Teflon show a close agreement between the
E.C.M. Sanga et al.
/
Chemical Engineering and Processing
41 (2002) 487 – 499
492
Fig. 4. Predicted moisture distribution for a special case of carrot embedded with Teflon on the horizontal symmetry plane (z = 0) for different
values of drying time (0.25 W/g, 45 °C air, 1.0 m/s).
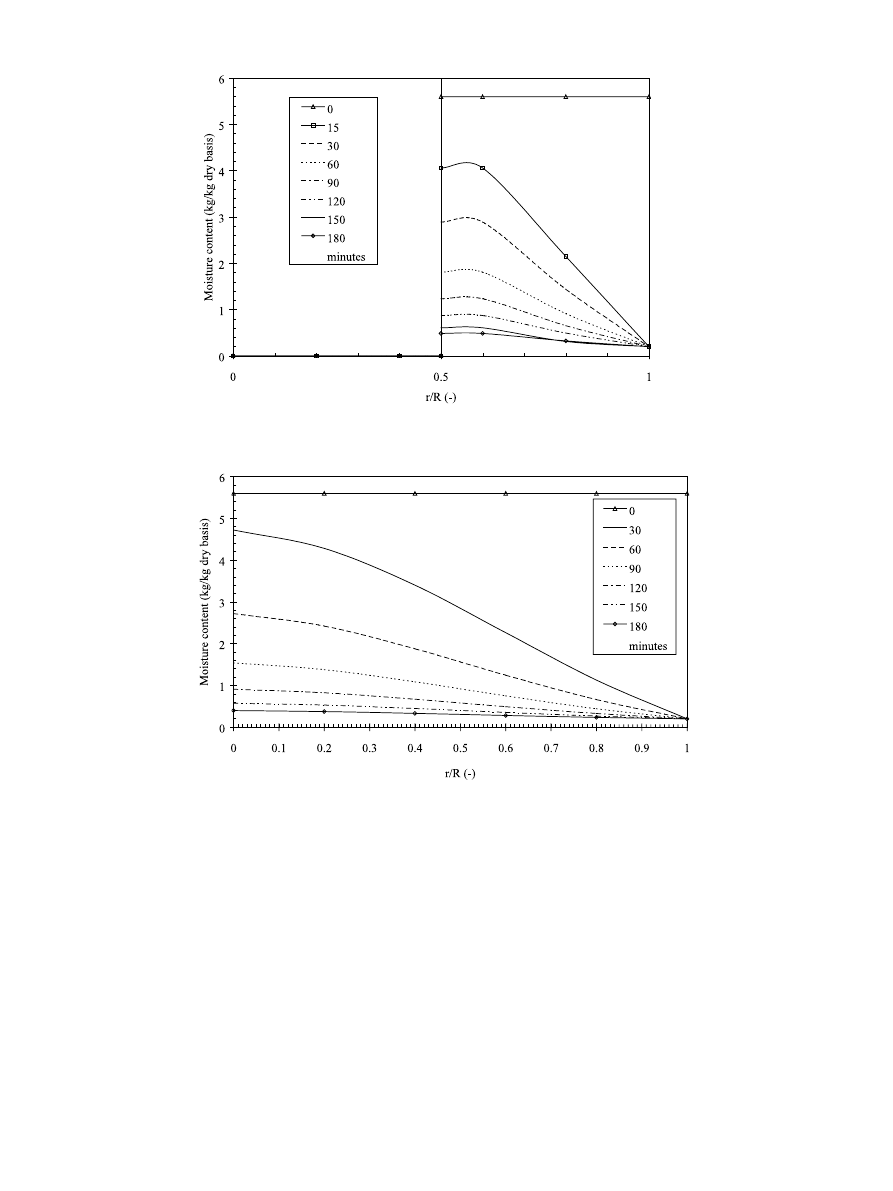
Fig. 5. Predicted moisture content distribution for carrot samples on horizontal plane (z = 0) for different drying times (0.30 W/g, 45 °C air, 1.0
m/s).
experimental data and predicted values when shrinkage
of material was considered. The difference between the
predicted values when shrinkage is considered and
when is not considered was found to be in the range of
1 – 2.6 and 5.8 – 7.6%, respectively. For the first 20 min
of drying the predicted result show a general agreement
with experimental data indicating that at this stage
shrinkage of samples was not significant. However,
immediately there after predicted values when shrink-
age was considered show a great agreement with exper-
imental values than when predicted without considering
shrinkage of material. The predicted values that do not
take into account shrinkage of material predicted
higher value of moisture content than when predicted
with shrinkage into consideration after approximately
20 min of drying. This can be attributed to the fact that
as the moisture migrates and material dries, the compu-
tation domain of material decreases due to the shrink-
age. Consequently, the moisture content diffusion to
the drying surface has a shorter distance than at the
beginning of drying. This explains why for the initial 20
min of drying all predicted values are in close agree-
ment with the experimental data. After the predicted
values with shrinkage considered were found to fit well
to the experimental data, the simulation was then ex-
tended to predict moisture content and temperature
E.C.M. Sanga et al.
/
Chemical Engineering and Processing
41 (2002) 487 – 499
493
Fig. 6. Predicted moisture content distribution for a special case of carrot embedded with Teflon on the horizontal symmetry plane (z = 0) for
different drying time (0.30 W/g, 45 °C air, 1.0 m/s).
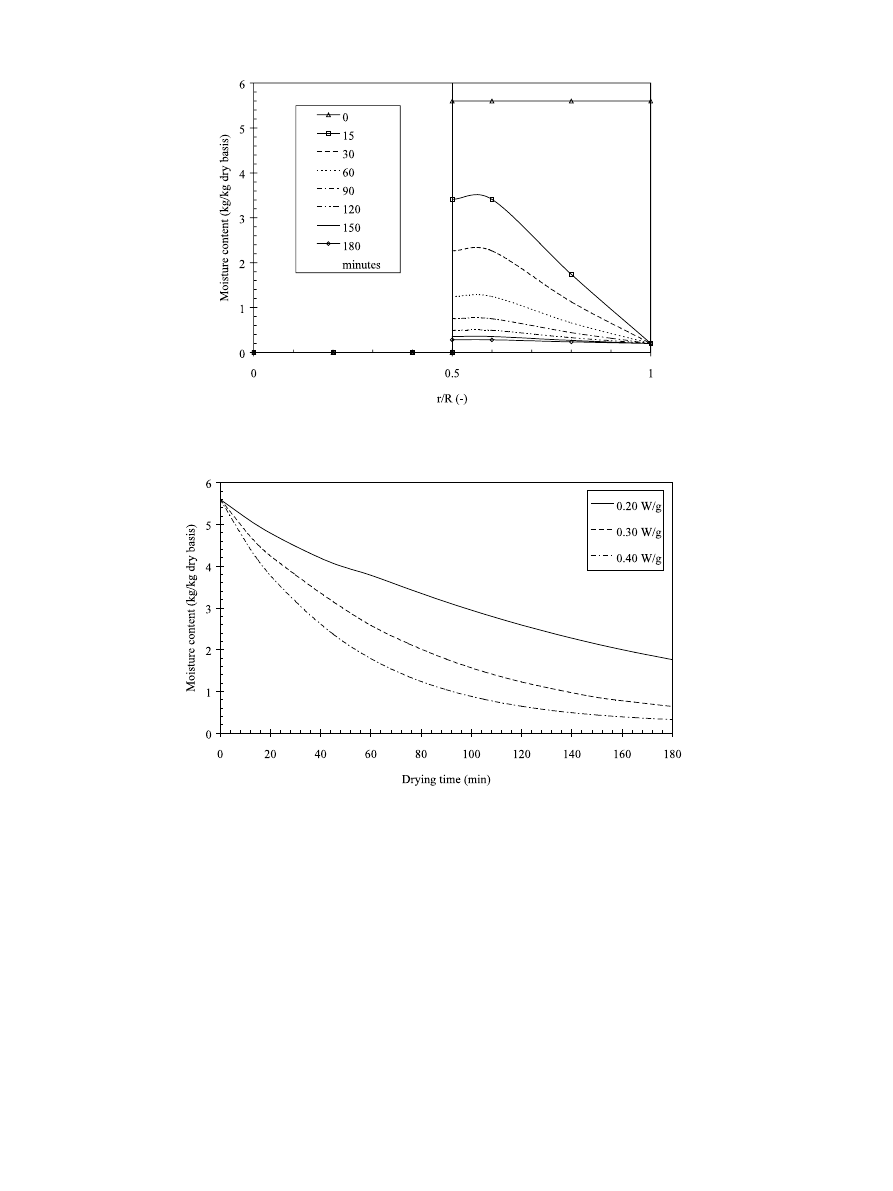
Fig. 7. Predicted moisture content distribution for carrot samples on the horizontal symmetry plane (z = 0) for different values of time during MW
convection drying (0.40 W/g and 45 °C air, 1.0 m/s).
profiles at various nodal locations at different mi-
crowave power density levels using two elements.
Figs. 3 – 8 show the moisture distribution predicted
from the model in samples as a function of both
position and drying time during microwave drying at
various microwave power density levels (0.25; 0.30; 0.40
W/g and 45 °C, 1.0 m/s air). The shrinkage effect was
taken into account during the simulation of moisture
contents in non-homogeneous material. For compari-
son purposes, figures for predicted results of moisture
content distribution for cylindrical carrot samples with-
out Teflon are shown. It can be seen that the moisture
content during microwave drying decreases sharply
with increase in both drying time and microwave power
density level. The moisture content gradients at various
microwave power density levels decreased with the in-
crease in drying time. For 0.40 W/g microwave power
density level the moisture content gradient decreased
very fast when compared with the moisture content
gradients at other microwave power density for similar
drying times.
Time-evolution of the average predicted moisture
content for special case of carrot samples embedded
with Teflon at various microwave power density and air
(45 °C air, 1.0 m/s) is shown in Fig. 9. The figure
shows that there is an increase in drying rate as the
E.C.M. Sanga et al.
/
Chemical Engineering and Processing
41 (2002) 487 – 499
494
Fig. 8. Predicted moisture content distribution for a special case of carrot embedded with Teflon on the horizontal symmetry plane (z = 0) at
different values of time during MW convection drying (0.40 W/g and 45 °C air, 1.0 m/s).
Fig. 9. Time-evolution of the average predicted moisture content for special case of carrot samples embedded with Teflon at various microwave
power density and air (45 °C air, 1.0 m/s).
microwave power density is increased. This can be
attributed to the effect of microwave on moisture by
rapidly increasing the moisture migration to the surface
and increased evaporation. However, at the later stage
of drying the effect of the level of microwave power
density decreased indicating lower microwave absorption
by material.
6
.
2
. Temperature
The mathematical model was also used to predict the
temperature distribution in the samples during mi-
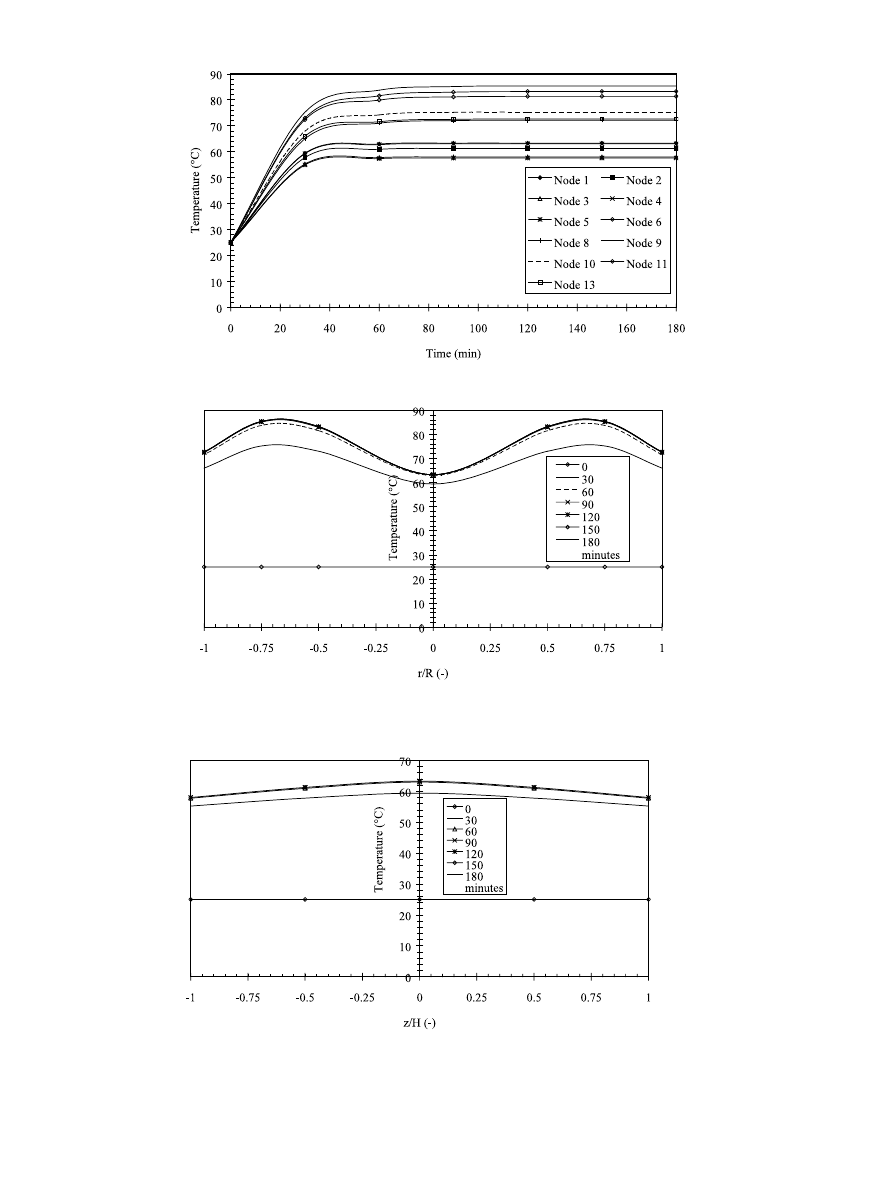
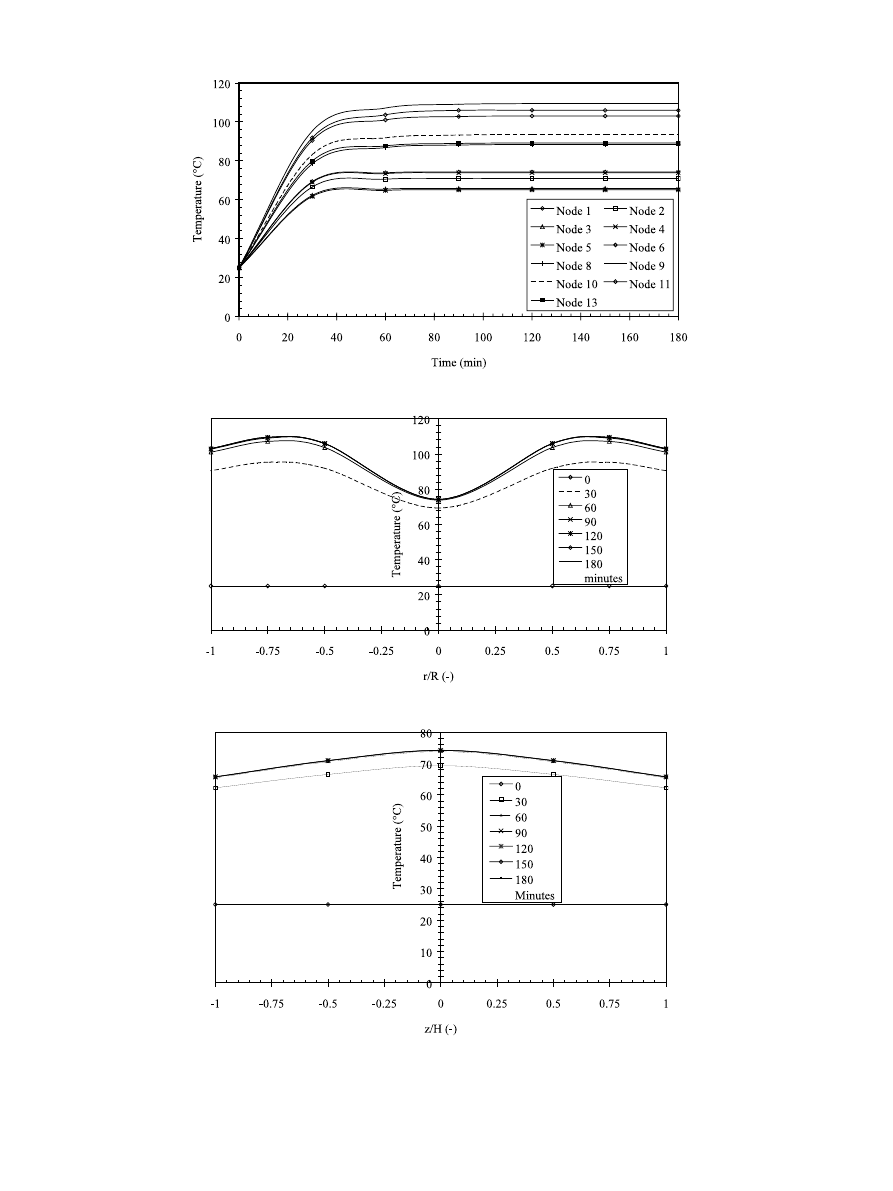
crowave and air-drying. Figs. 10, 13 and 16 represent
temperature profiles in sample at various nodal locations
during microwave drying at 45 °C and microwave power
density of 0.25, 0.30 and 0.40 W/g, respectively. Shrink-
age of samples was considered during the predic-tions of
temperatures. The temperature at every nodal location
rose with the increase in drying time and microwave
power density level. The temperature gradient between
the surface of sample and interface between the Teflon
and carrot is decreased with increase in time.
However, the predicted values indicate temperature
gradients between the interface and the center of the
E.C.M. Sanga et al.
/
Chemical Engineering and Processing
41 (2002) 487 – 499
495
Fig. 10. Predicted temperature for a special case of carrot embedded with Teflon at various nodal positions during microwave drying (0.25 W/g,
45 °C, 1.0 m/s, air).
Fig. 11. Predicted temperature distribution along a radius on the horizontal symmetry plane (z = 0) of a special case of carrot samples embedded
with Teflon at different values of drying time (0.25 W/g, 45 °C, 1.0 m/s air).
Fig. 12. Predicted temperature distribution along the vertical axis (r = 0) of a special case carrot samples embedded with Teflon at different values
of drying time (0.25 W/g, 45 °C, 1.0 m/s).

E.C.M. Sanga et al.
/
Chemical Engineering and Processing
41 (2002) 487 – 499
496
Fig. 13. Predicted product temperature for a special case of carrot embedded with Teflon at various nodal position during microwave drying (0.30
W/g, 45 °C, 1.0 m/s).
Fig. 14. Predicted temperature distribution along a radius on the horizontal symmetry plane (z = 0) of a special case of carrot samples embedded
with Teflon at different values of drying time (0.30 W/g, 45 °C, 1.0 m/s air).
Fig. 15. Predicted temperature distribution along the vertical axis (r = 0) of a special case carrot samples embedded with Teflon at different values
of drying time (0.30 W/g, 45 °C, 1.0 m/s).
E.C.M. Sanga et al.
/
Chemical Engineering and Processing
41 (2002) 487 – 499
497
Fig. 16. Predicted product temperature for a special case of carrot embedded with Teflon at various nodal position during microwave drying (0.40
W/g, 45 °C, 1.0 m/s).
Fig. 17. Predicted temperature distribution along a radius on the horizontal symmetry plane (z = 0) for a special case of carrot samples embedded
with Teflon at different values of drying time (0.40 W/g, 45 °C, 1.0 m/s air).
Fig. 18. Predicted temperature distribution along the vertical axis (r = 0) of a special case carrot samples embedded with Teflon at different values
of drying time (0.40 W/g, 45 °C, 1.0 m/s).

E.C.M. Sanga et al.
/
Chemical Engineering and Processing
41 (2002) 487 – 499
498
sample is extremely low. Figs. 11, 14 and 17 show the
time-dependent temperature distribution along a radius
on the horizontal symmetry plane (z = 0) of a special
case of carrot samples embedded with Teflon at differ-
ent values of drying time and various microwave power
density levels (0.25, 0.30 and 0.40 W/g). The tempera-
ture in the radial direction between the interface (r = R/
2) and the center (r = 0) is uniform when compared
with the temperature between the interface (r = R/2)
and the drying surface at r = R.
Figs. 12, 15 and 18 show the time-dependent axial
temperature distribution along the vertical axis (r = 0)
for a special case of carrot embedded with Teflon at
various microwave power density. The temperature dis-
tribution in the axial direction was uniform when com-
pared with the temperature distribution in the radial
direction for all microwave power density levels (Figs.
13 – 18).
7. Conclusions
The mathematical model developed and simulation
procedure adopted has been used successfully to predict
the moisture content and temperature distribution at
various nodal positions in a composite non-homoge-
neous model material during microwave air drying. The
predicted results generally showed a good agreement
with experimental results when shrinkage of material
was considered in simulation. This shows that shrink-
age is an important factor during drying and needs to
be considered for accurate prediction results.
Acknowledgements
This work was partially funded by FCAR (Quebec)
and NSERC Canada. The authors would like to ac-
knowledge their financial support.
Appendix A. Nomenclature
specific heat capacity (J/kg K)
c
p
D
moisture diffusion coefficient (m
2
/s)
D
0
moisture diffusion coefficient at moisture X = 0
and temperature T = T
r
(m
2
/s)
moisture diffusion coefficient at moisture X =
D
i
and temperature T=T
r
(m
2
/s)
activation energy of diffusion in dry material at
E
0
X = 0 (kJ/mol)
E
i
activation energy of diffusion in wet material at
X =
(kJ/mol)
h
T
surface heat transfer coefficient (W/m
2
K)
h
m
surface mass transfer coefficient (m/s)
H
height of the sample (m)
thermal conductivity (W/m K)
k
pressure (N/m
2
)
P
volumetric heating per volume of sample (W/
Q
m
3
)
incident microwave flux at the surface of sam-
Q
0
ple (W/m
2
)
Q
0l
axial incident microwave flux at the surface of
sample (W/m
2
)
radial incident microwave flux at the surface of
Q
0r
sample (W/m
2
)
space dimension in radial direction (m)
r
radius of the sample (m)
R
gas constant (J/kg mol K)
R
g
drying surface (m
2
)
S2
drying surface (m
2
)
S3
temperature (K)
T
time (s)
t
moisture content (kg/kg)
X
z
space dimension in axial direction (m)
Greek letters
dielectric constant (−)
m%
m¦
dielectric loss factor (−)
electric permittivity of free space (F/m)
m
o
i
attenuation constant (−)
microwave wavelength in free space(cm)
u
0
z
density (kg/m
3
)
bulk density of material (kg/m
3
)
z
b
microwave frequency
f
Subscripts
number of material layers
n
layer of material 1
1
layer material 2
2
0
initial conditions
ambient air conditions
References
[1] E. Sanga, A.S. Mujumdar, G.S.V. Raghavan, Principles and
applications of microwave drying, in: A.S. Mujumdar (Ed.)
Drying Technology in Agriculture and Food Sciences, Oxford
IBH, Delhi, India 2001. Published simultaneously by Science
Publishers, Enfield, USA, pp. 253 – 289.
[2] A.S. Mujumdar, Handbook of Industrial Drying, Marcel
Dekker, New York, 1995.
[3] K.G. Ayappa, Modeling transport processes during microwave
heating: a review, Reviews in Chemical Engineering 13 (2) (1997)
1 – 68.
[4] M. Lehne, G.W. Barton, T.A.G. Langrish, Comparison of ex-
perimental and modeling studies for the microwave drying of
ironbark timber, Drying Technology 17 (10) (1999) 2219 – 2235.
[5] C. Saltiel, A.S. Datta, Heat and mass transfer in microwave
processing, Advances in Heat and Transfer 33 (1999) 1 – 94.
[6] T.N. Tulasidas, G.S.V. Raghavan, A.S. Mujumdar, Microwave
drying of grapes in a single mode cavity at 2450 MHz-I: drying
kinetics; and II: quality and energy aspects, Drying Technology
13 (8 – 9) (1995) 1949 – 1992.

E.C.M. Sanga et al.
/
Chemical Engineering and Processing
41 (2002) 487 – 499
499
[7] L. Lu, J. Tang, L. Liang, Moisture distribution in spherical
foods in microwave drying, Drying Technology 16 (3 – 5) (1998)
503 – 524.
[8] G.S.V. Raghavan, Silveira A.M., Shrinkage characteristics of
strawberries osmotically dehydrated in combination with mi-
crowave drying, ADC’99, October 1999, Bali.
[9] G.S.V. Raghavan, K. Venkatachalapathy, Shrinkage of straw-
berries during microwave drying, Drying Technology 17 (10)
(1999) 2309 – 2321.
[10] D. Zhang, A.S. Mujumdar, Deformation and stress analysis of
porous capillary bodies during intermittent volumetric thermal
drying, Drying Technology 10 (2) (1992) 421 – 443.
[11] N.M. Panagiotou, M.K. Krokida, Z.B. Maroulis, D. Marinos-
Kouris, G.D. Saravacos, Moisture diffusivity data compilation
for foodstuffs: effect of material moisture and temperature, IDS
2000.
[12] A.R. von Hippel, Dielectric Materials and Applications, MIT
Press, Cambridge, MA, 1954.
[13] D.D. Chen, R.K. Singh, K. Haghighi, P.E. Nelson, Finite ele-
ment analysis of temperature distribution in microwave cylindri-
cal potato tissue, Journal of Food Engineering 18 (1993)
351 – 368.
[14] E. Sanga, A.S. Mujumdar, G.S.V. Raghavan, Heat and mass
transfer in non-homogeneous materials under microwave field,
Presented at the 50th Canadian Chemical Engineering Confer-
ence, Montreal, Canada, October 15 – 18, 2000a.
[15] E. Sanga, A.S. Mujumdar, G.S.V. Raghavan, Experimental re-
sults of combined MW-convection drying of non-homogeneous
(composite) materials, Presented at the 2000 ASAE Annual
International Meeting, Midwest Express Center Milwaukee, WI,
July 9 – 12, 2000b.
[16] E. Sanga, A.S. Mujumdar, G.S.V. Raghavan, Microwave-con-
vective drying of discretely non-homogeneous materials: kinetics
and quality attributes, Presented at Microwave 2000: Sustainable
Technology for The New Millennium and The Third Chinese
Microwave Chemistry Symposium, Nankai University, Tianjin,
People’s Republic of China, May 7 – 10, 2000c.
Document Outline
- Simulation of convection-microwave drying for a shrinking material
Wyszukiwarka
Podobne podstrony:
Influence of airflow velocity on kinetics of convection apple drying
Effect of vacuum microwave drying on selected mechanical and rheological properties of carrot
Modeling of the microwave drying process of aqueous dielectrics
Drying, shrinkage and rehydration characteristics of kiwifruits during hot air and microwave drying
Drying kinetics and quality of beetroots dehydrated by combination of convective and vacuum microwav
Thin layer modelling of the convective, microwave, microwave convective and microwave vacuum drying
Far infrared and microwave drying of peach (Jun Wang, Kuichuan Sheng)
Microwave–vacuum drying kinetics of carrot slices (Zheng Wei Cui, Shi Ying Xu, Da Wen Sun)
Modelling of dehydration rehydration of orange slices in combined microwaveair drying
Drying kinetics and quality of vacuum microwave dehydrated garlic cloves and slices
Microwave Drying of Parsley Modelling, Kinetics, and Energy Aspects
VIZ scheidery Samples of different shading for a standard material
Microwave drying characteristics of potato and the effect of different microwave powers on the dried
Preparation of dry honey by microwave–vacuum drying
Microwave drying characteristics of spinach
Effect of drying conditions on the quality of vacuum microwave dried potato cubes
Convective air drying characteristics of thin layer carrots
więcej podobnych podstron