
266 The Financial Review May 1984
ENTROPY, BIFURCATION AND DYNAMIC
MARKET DISEQUILIBRIUM
David Nawrocki
*
The study of security market behavior in recent years has focused on
the dynamic process of disseminating information throughout the
marketplace. Lags in information dissemination and the subsequent
market disequilibrium are stressed by many studies in the finance
literature [12,3,5,9,10,19,20,29]. While these studies are exciting
because of their stress on disequilibrium processes, they are constrained
by a standard assumption of stationary stochastic processes [19,
footnote 2].
The relaxation of this assumption should help to enrich our
understanding of disequilibrium processes. Work with chemical
processes by Nicolis and Prigogine [33] has relaxed the stationary
stochastic process assumption, thereby increasing our knowledge of the
evolution of dynamic systems. The major tools used by Nicolis and
Prigogine are entropy theory and bifurcation theory. Bifurcation theory
is concerned with the restructuring of systems in order to ensure their
survival. A bifurcation point is the threshold where the system is
restructured. Through the use of bifurcation theory, entropy models can
model dynamic processes that change their information structure or
their physical structure in response to stress created by disequilibrium
conditions, thereby providing a description of nonstationary processes.
The application of evolutionary theory to economic processes is
strongly defended by Boulding [6, 7]. In addition, Majthay [26]
provides a strong case for using bifurcation theory instead of the
currently popular catastrophe theory [23, 38, 39]. However, while the
use of entropy theory and bifurcation theory is known in the finance
and economics literature, [6, 12, 17, 24, 26, 30, 36], these theories have
not been used to describe security market disequilibrium.
The purposes of this paper are to survey the work in financial market
disequilibrium and to describe an application of entropy and bifurcation
theories to financial market disequilibrium.
The structure of the paper is as follows. First, current models of
financial market disequilibrium are described. Next, the work of
Nicolis and Prigogine [33] with entropy arid bifurcation models is
discussed, along with the application of this work to financial market
disequilibrium. Finally, some implications of the entropy model are
explored.
*Villanova University. Work on this paper was supported by a summer research
grant from the College of Commerce and Finance, Villanova University. The author
would like to thank the referees, the editor, and William Harding for their comments
on earlier versions of this paper. Reprinted from The Financial Review, Vol. 19, No.
2, May 1984.

The Financial Review May 1984
MARKET DISEQUILIBRIUM
This section gives an overview of the research in market equilibrium and disequilibrium
processes that has appeared in the finance literature. Kaplan [25] provides the mathematical
framework used to describe stationary and nonstationary processes described in this section.
The traditional tatonnement model of market equilibrium is the appropriate starting point. This
model assumes a stationary information process and an infinite speed of information
dissemination and assimilation in the marketplace. The market prices that result from this
process adjust immediately to the arrival of new information. Since by definition new
information is an independent process, the usual random walk model is developed as in [14].
This process can he described by equations (1) and (2). First, the information process is
described in (1):
_
I(t) = I + v(t).
(1)
_
where I is the long run mean of a stationary information process. v(t) is the error process. It
is distributed according to a stationary normal distribution, and has a known diagonal covariance
matrix. Since the covariance matrix is diagonal. v(t) values are independent over time. This is
consistent with the concept that information arrival is independent over time. As per Fama’s
review [14], the return of a security is a function of the information set at that time, R(t) = f[I(t)].
Then the return process will also be independent over time (assuming an infinite speed of
information dissemination):
_
R(t) = R + e(t).
(2)
where e(t) is also distributed according to a stationary normal distribution with a zero mean
and a known diagonal covariance matrix.
A problem with this random walk model is that the empirical evidence has not supported the
normal distribution assumption. Clark [81 and Black [5] address this problem. Black argues that
Fama’s assumption [14] that information arrives continuously in small random doses is not
realistic. He states that information arrives periodically in large doses. Therefore, the
information system is noncontinuous and follows a sporadic jump process. Other authors who
have studied information processes in frictionless financial markets include Copeland and
Westin [11, Chapter 8], Gonedes [18] and Merton [28]. Assuming an infinite speed of
information dissemination, this process can be described as a jump process in equation (3):
_
I(t) = I(t) + v(t),
(3)
_
where v(t) is normally distributed and has a known diagonal covariance matrix, and I(t) is a
mean process that undergoes discrete shifts that could follow a poisson-distributed jump process.
Therefore, the return process can be similarly described in (4):
_
R(t) = R(t) + e(t),
(4)
_
where R(t) is a poisson-distributed mean jump process and e(t) is normally distributed with a
known diagonal covariance matrix. The resulting return process is now nonnormal. However, it
is being generated by two stable distributions and, therefore, is still a random walk process [28].
Clark [8] uses subordinated distributions to provide a similar explanation for nonnormal
distributions commonly found with security returns. The model in equations (3) and (4) has
additional empirical support in terms of the jump process. Oldfield, Rogalski and Jarrow [34]
found empirical evidence suggesting that the information process is best described as a sporadic

The Financial Review May 1984
jump process. Cohen, Hawawini, Maier, Schwartz and Whitcomb [9] discuss various empirical
results that support the noncontinuous information process. However, Fielitz [15] argues against
the market process in equation (4) by noting empirical studies that found persistent long-term
dependence in security prices.
The assumption that markets have an infinite speed of information dissemination, however, has
been questioned by an increasing number of researchers. This, in turn, leads to a developing
body of literature concerning disequilibrium models of market processes. Beja and Hakansson
[3] argue that a swift movement to a pareto-optimum price in the classical tatonnement process is
unlikely in actual security prices because of institutional rigidities such as taxes and transaction
costs. It is more likely that markets will trade at disequilibrium prices in a search for equilibrium.
If investor preferences are constantly changing as new information arrives, then the market will
not converge to equilibrium. Grossman and Stiglitz [19] explore reasons why uninformed traders
do not impute equilibrium prices from the trades of the informed investors. They state that prices
never fully adjust because of a noisy information system, the costs of acquiring and evaluating
information, and the continuing need to adjust to new information shocks to the economy. Black
[5] argues that disequilibrium prices result from lags in the information process.
Because of these restrictions causing a finite speed of information dissemination, Copeland
[10] states that with the sequential arrival of information, prices adjust monotonically toward the
equilibrium price. Thus disequilibrium returns are autocorrelated even though the information
process is independent over time. The return process is described in (5):
_
R(t) = R + f(t),
(5)
where f(t) has a covariance matrix that contains off-diagonal dependence terms. As long as the
information is continuous and the speed of information dissemination is finite, then the
covariance matrix should be stable [11. Chapter 8].
Since information does not seem to be a continuous process [9, 34], the model in equation
(5) is still not satisfactory. Beja and Goldman [2] argue that market restrictions that have been
discussed in [3, 9, 19, and 34] could cause oscillatory behavior in the rate of convergence to
equilibrium. Therefore, there is not a stable monotonic movement to equilibrium as suggested by
Copeland [10]. With oscillatory behavior, the amount of dependence varies and the covariance
matrix in (5) is not stable over time.
In addition, Morse [29] argues that the speed of information dissemination, while finite, is
not constant. The speed of information dissemination varies with the amount of new in for-
mation. This argument is based on the fact that with the arrival of new information, the greater
the disparity between the equilibrium price and the actual price, the more investors want to trade.
The resulting trading volume helps to increase the speed of information dissemination in the
market. Because of the aforementioned restrictions affecting the speed of information
dissemination, greater dependence in security returns also occurs during this period. Morse’s
results indicate a positive relationship between trading volume and serial correlations for daily
data for a mixture of NYSE, AMEX and OTC stocks. Groth [20] shows that different securities
have different levels of dependence and that some securities have varying levels of dependence
during different time periods. Therefore, the autocorrelation structure of f(t) is dependent on the
amount of undisseminated (old as well as new) information as in equation (6):
_
R(t) = R(t) + f[I(t), t] (6)
Where R(t) is a poisson-distributed mean jump process and f(t) has a covariance matrix with
autocorrelation terms that varies over time in a direct response to the amount of new information
arriving into the market. The covariance matrix is nonstationary over time as a result of the
sporadic jump process in the sequential information process and the varying finite speed of
information dissemination.

The Financial Review May 1984
To summarize, the market disequilibrium model that is emerging in the finance literature results
from a finite speed of information dissemination with information arriving in a jump process.
The finite speed of information dissemination occurs because of market friction and rigidities
such as transaction costs, taxes, noisy information channels and the costs of acquiring and
analyzing information.
ENTROPY MODELS OF MARKET PROCESSES
Concurrent with the development of the market disequilibrium model in the finance literature has
been the development of entropy models of dynamic disequilibrium processes. This section
presents the development of the entropy model of market disequilibrium and the contribution of
bifurcation theory to the entropy model.
An entropy model of market operation is first described by Murphy [30]. Murphy argues the
analogy of the marketplace as a game of bridge. In this game, full information is not available
through the bidding process. As the cards are played sequentially, the information contained in
the cards is disclosed through the sequential playing of the cards. In the market, different
investors have different stores of information. The informed investors provide information to
uninformed investors through trades. Also, separate stores of information are integrated as a
result of these trades. Through transactions, information is disseminated and the market tends
toward equilibrium prices until the next arrival of information.
Cozzolino and Zahner [12] provide a proof that maximum entropy in an information system such
as a financial market occurs when the speed of information dissemination is infinite. This allows
the authors to show that the maximum entropy model is equivalent to the random walk model.
Therefore, a maximum entropy model is a continuous equilibrium model. Whenever the entropy
process is constrained by the friction of the system from reaching maximum entropy, then
disequilibrium conditions results. In an information system, maximum entropy occurs with the
complete dissemination of information. Rigidities that interfere with the dissemination of
information also serve to prevent entropy from being maximized. Because of the prevalence of
disequilibrium processes, Dinkel and Kochenberger [13] argue that constrained entropy models
have more applications in different disciplines than the maximum entropy model.
The important work in constrained entropy models in the context of this paper is the work by
Nicolis and Prigogine [33] in the field of physical chemistry. In the financial markets, the speed
of the price adjustment process is constrained to some finite speed by taxes, transaction costs,
information costs and noisy information channels. Equilibrium and disequilibrium conditions in
such a market are derived from Nicolis and Prigogine [33, pp. 55—60]:
g
t
– g
t-1
=D
t
– I
t
,
(7)
where D
t
is the amount of information that the market can disseminate for some time unit t
(speed of information dissemination); I
t
is the amount of new information that has arrived in the
market in a discrete sequential arrival process; and g
t
is the amount of information (in nits, bits,
or hartleys) that has not been disseminated at any point in time, t. From equation (7), it follows
that I
t
/D
t
is the amount of time needed for the market to disseminate new information throughout
the market at that particular time period, t.
The Financial Review May 1984
The variable g
t
acts as a measure of disequilibrium, i.e., the greater the amount of
undisseminated information, the greater the divergence from equilibrium. The variable g
t
is the
stock of (undisseminated) information in the market and is defined by Murphy in equation (8):
g
t
= -(H* H
t
),
(8)
where H* is the maximum entropy and H
t
is the actual entropy of the system. Whenever D
t
>(I
t
- g
t-1
), then the actual entropy is maximized (H = H*) and there is no stock of information in the
market (g=0) since all information is disseminated. The value of g can be detected statistically by
tests such as correlation analysis, runs tests, spectral analysis and chi-square tests, since if there
is undisseminated information, security returns will be dependent over time. The conditional
entropy (H) is also used to calculate the g value through equation (8), equating entropy to g
t
Therefore the amount of dependence as measured by the conditional entropy or correlation
analysis varies depending on the speed of information dissemination and the amount of new
information entering the marketplace. Since the conditional entropy is constrained by the finite
speed of information dissemination (D) from reaching maximum entropy, then the entropy
model described in this study is generally known as a constrained entropy model.
CONSTRAINED ENTROPY MODEL OF MARKET DISEQUILIBRIUM
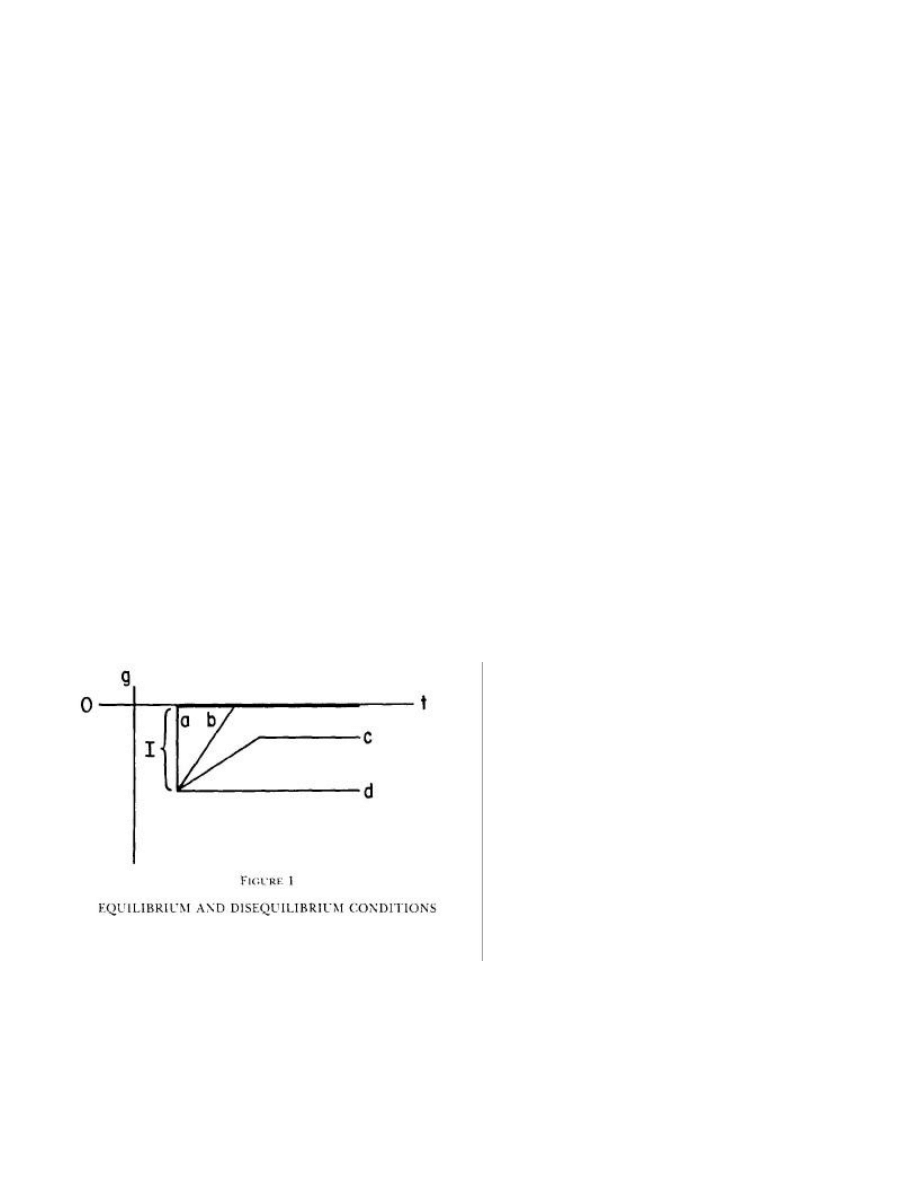
This section describes how the simple entropy model in equation (7) is used to model
disequilibrium conditions. Given an information input I, equilibrium conditions are described in
Figure 1.
Line [a] represents a standard random walk or tâtonnement model where there is an
immediate movement to equilibrium (g = 0, information fully disseminated) at an infinite speed
of adjustment after an information input I. Line [b] represents a finite and constant speed of
adjustment to equilibrium. Since the speed of adjustment to equilibrium is finite, states of dis-
equilibrium exist. Line [c] occurs when only some of the information is disseminated and line [d]
The Financial Review May 1984
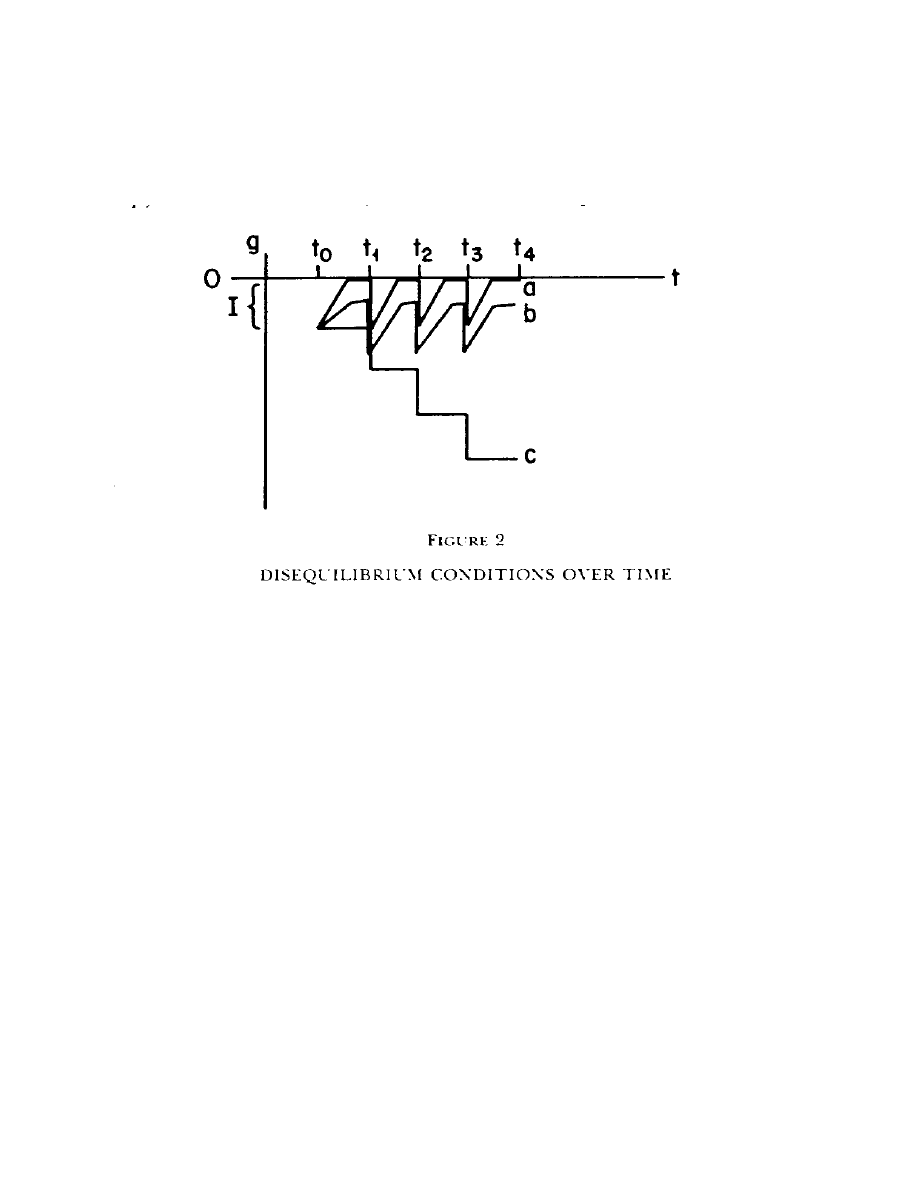
represents a complete disequilibrium where none of the information (I) is disseminated. To make
this model dynamic assume that information inputs I
0
, I
1
, I
2
. . . I
n
arrive during time periods t
0
,
t
1
, t
2
, . . . t
n
, respectively. Figure 2 provides a visual representation of this process.
Line [a] represents a finite speed of adjustment and a complete dissemination of information
until I
1
arrives in t
1
. Line [b] represents a stable disequilibrium where enough of the information
is disseminated to keep g within a stable range. Line [c] is a total disequilibrium where no
information is disseminated. As each information input arrives, the disequilibrium becomes
increasingly severe. The practical implication of a total disequilibrium for financial markets is
that the markets fail to properly allocate financial resources. Eventually, the disequilibrium
becomes so severe that investors and borrowers refuse to participate in the market. This action by
the participants threatens the survival of the market system.
THEORIES OF CATASTROPHE AND BIFURCATION
Recently, catastrophe theory [23, 38] has been used to explain corporate failures. It seems
appropriate to use catastrophe theory in the case of line [c], where the point of the inevitable
market collapse could be determined by catastrophe theory.

The Financial Review May 1984
Unfortunately, catastrophe theory is not appropriate to this problem because it does not allow for
structural changes that can perpetuate the market system. When a disequilibrium in the market
becomes too severe, the market can restructure itself to improve the flow of information. There
can be disequilibrium thresholds where society decides it cannot afford the increasing cost of
misallocated resources as disequilibrium increases. Such a threshold then forces a restructuring
of the market system. In other words, the market restructures in hopes of improving its ability to
disseminate information well before the market reaches a point where the market ceases to exist
or a catastrophic restructuring takes place. This concept of restructuring to maintain the survival
of the system is known as bifurcation theory. A bifurcation in any system is a point (or threshold)
where the system is restructured to operate at a more acceptable or stable level of disequilibrium.
(This can mean the death of the system as well as restructuring a surviving system.)
An example of bifurcation point in the stock market is when different rumors about a company
are flying about, and it is difficult for traders to separate fact from fiction. When faced with such
a noisy information system, the exchange usually suspends trading until the company can
confirm or deny the rumors. The breakdown in communications leads to trades at disequilibrium
prices, and trading is suspended until the information has been disseminated to all participants.
Then trading resumes at the new equilibrium price. This is a short-term restructuring of the
market, since the market did not arrive at the new equilibrium in the usual manner of
disseminating information through trades.
Bifurcation theory is related to catastrophe theory as developed by Thom [39]. The former
theory, however, is different from the latter since the bifurcation point does not have to be
catastrophic. Bifurcations occur as systems react to the stress caused by disequilibrium
conditions. A change in physical structure or operating procedures can relieve the stress.
Boulding [7] and Nicolis and Prigogine [33] state that the stress of disequilibrium conditions and
the resulting bifurcations are the main components of evolutionary theory. However, bifurcations
do not usually lead to equilibrium conditions, only to a stable or comfortable disequilibrium
condition under which the system can continue to survive.
Catastrophe theory is applied in the finance literature to bank failures by Ho and Saunders [23],
and to corporate failures by Scapens, Ryan and Fletcher [38]. It is used to explain why a
company is operating one day and is bankrupt the next day. Although some companies move
gradually toward bankruptcy in a clear trend, some companies go bankrupt suddenly with few
warning signals. Catastrophe theory is the study of sudden changes in a system that results from
smooth changes in those factors that determine the equilibrium state of the system. Nicolis and
Prigogine [33, pp. 174—8] state, however, that catastrophe theory does not have applications in
disequilibrium systems, because it does not allow the relationships between variables to be in
disequilibrium prior to reaching the bifurcation point. Catastrophe theory only explains sudden
changes from one equilibrium state to the next. Majthay [26] points out that since bifurcation
theory is rich enough to include the situations covered by catastrophe theory and does not have
the limitations of catastrophe theory, the only sacrifice required when applying bifurcation
theory is to give up the illusion that catastrophe theory is being applied.
Bifurcation theory is used in this paper to describe a nonstationary disequilibrium process in the
market system. Whenever g reaches a point of sufficient stress, a bifurcation point, some
structural change of the information dissemination process occurs, thereby allowing for increased
speed in disseminating information, as shown in Figure 3.
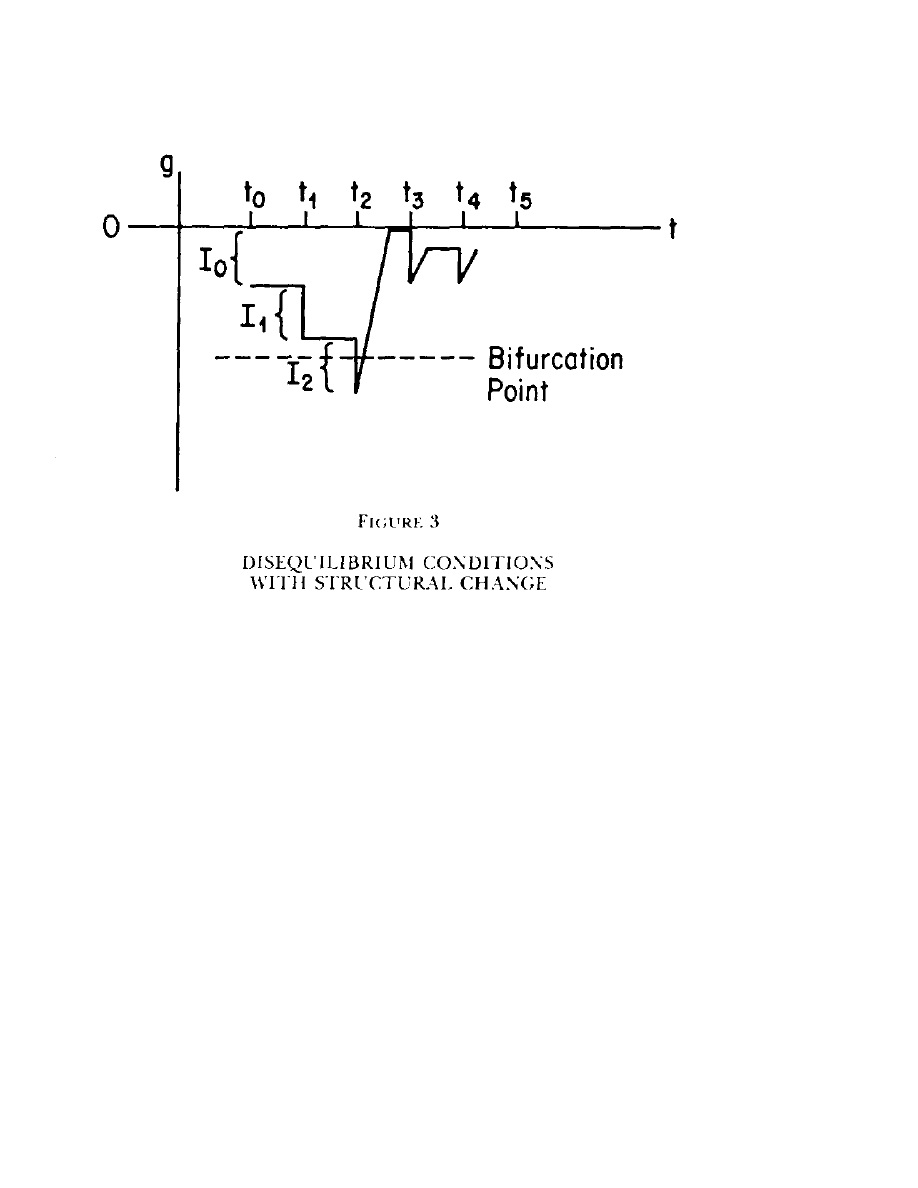
The Financial Review May 1984
In periods t
0
and t
1
, the market is unable to disseminate information sets I
0
and I
1
. The
disequilibrium measure g indicates that the disequilibrium conditions are increasing. Thus when
the information set I
2
arrives in t
2
; g hits a bifurcation point. This bifurcation point may be
determined internally within the market as a self-correction or it may be determined externally
by society as an external correction process. At this time, the market restructures in order to
improve its speed of dissemination so that by periods t
3
and t
4
, the market is operating within an
acceptable (to society) range of disequilibrium. Figure 3 shows the complete dissemination of
information from period t
2
to period t
3
as one possible result of restructuring the system after
reaching a bifurcation point.
There can be many bifurcation points with different responses for each bifurcation point.
Majthay [26] states that depending on how far g deviates away from equilibrium, the change at
the various bifurcation points can involve the entire range from subtle readjustments to drastic
restructuring of the entire system. It is in this richness of responses that the principle strength of
bifurcation theory lies. These results can classify different types of dynamic disequilibrium
conditions and provide avenues for empirical research. The four broad categories are continuous
equilibrium, continuous disequilibrium. stationary disequilibrium and nonstationary
disequilibrium
.
Continuous equilibrium is like the case of the usual random walk where the market is
continuously in equilibrium (equation (2)). Continuous disequilibrium occurs where the amount
of dependence in the market does not vary (equation (3)). Stationary disequilibrium exists where
the amount of dependence in the market varies but the basic structure of the market remains
stationary (equation (6)). Nonstationary disequilibrium prevails where the market dependence
The Financial Review May 1984
varies, and the market is restructured in response to the market dependence reaching various
bifurcation points (Figure 3).
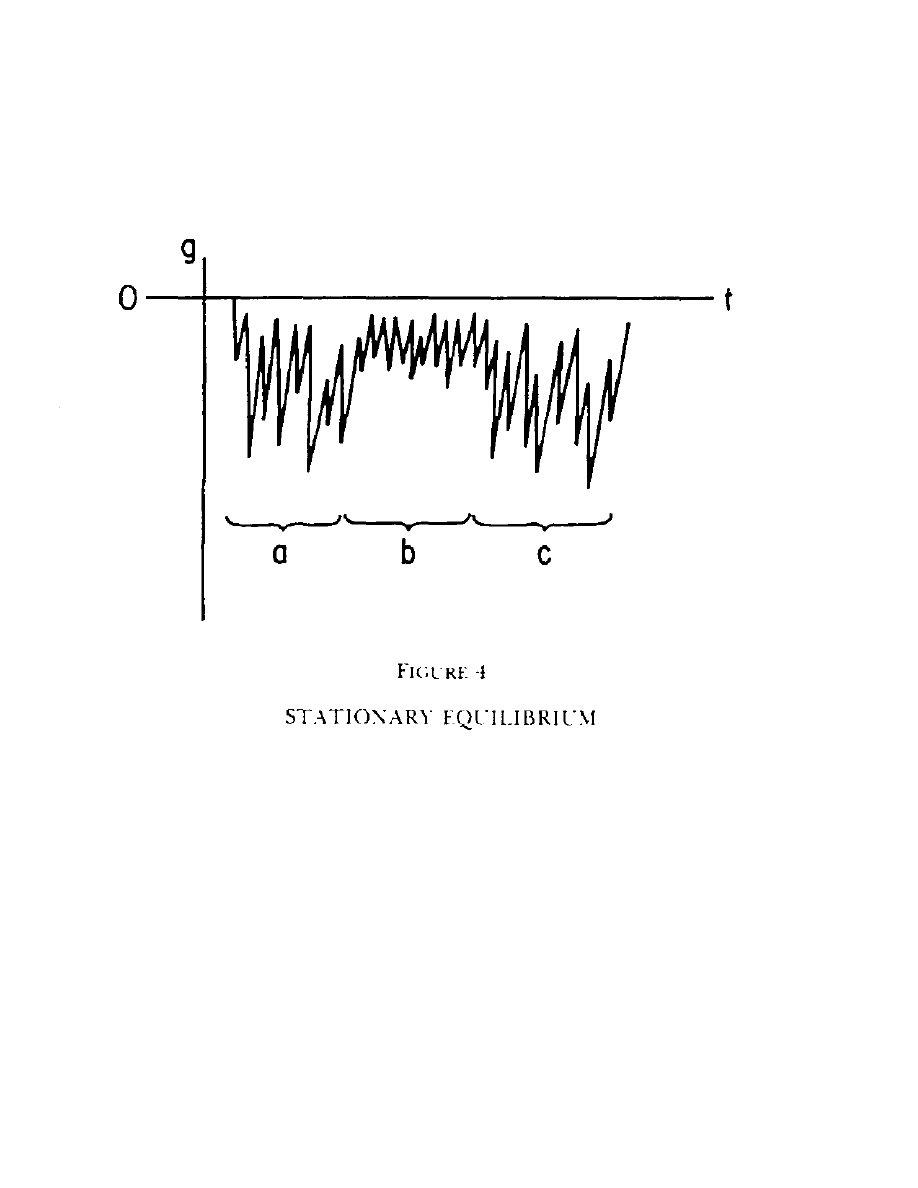
The stationary disequilibrium can look like line h in Figure 2, but it is portrayed more
characteristically in Figure 4.
The disequilibrium conditions in Figure 4 allow for different levels of new information as well as
varying speeds of information dissemination. The speeds are finite in that it takes time to
disseminate information given the friction of the marketplace. However the speed of
dissemination increases as large amounts of new information enter the market. This increase in
speed occurs if the new information causes a sufficient deviation from equilibrium so that
arbitrageurs can generate enough profit to cover transaction and information costs [11, Chapter
8]. Therefore, they enter the market in greater volume, thus increasing the speed of adjustment.
The scenario of varying speeds of information dissemination is suggested by Morse [29], who
found that the volume of trades increases with increases in dependence. The increased volume
serves to increase the speed of information dissemination. During periods [a] and [c] in Figure 4,
information arrives in large doses, shown here by large increases in disequilibrium (dependence)
conditions as measured by g. The speed of information dissemination increases so that
undisseminated information doesn’t have a chance to accumulate to a bifurcation point. In period
[b], amounts of information enter the market in sufficiently small amounts that arbitrageurs do
not enter the market due to information and transaction costs. The volume of trades and the
speed of dissemination declines such that disequilibrium conditions exist even during periods of

The Financial Review May 1984
reduced information flow. This type of disequilibrium condition is known as a stationary
disequilibrium; in it the market maintains a stationary structure without having to restructure.
The disequilibrium conditions in Figure 4 are consistent with the models proposed b Beja and
Goldman [2], Beja and Hakansson [3], Grossman and Stiglitz [19], Groth [20] and Morse [29].
The stationary disequilibrium model has two implications for current research in the operations
of security markets. First, security returns have nonnormal distributions whenever the market is
described as a stationary disequilibrium. Both Black [5] and Fielitz [15] note that nonnormal
distributions are intimately related with long-term dependence. There is more than conjecture on
this point as Nicolis and Prigogine [33, pp. 227—8] provide a proof showing that when systems
are in disequilibrium, there is a general breakdown of the law of large numbers leading to
nonstationary means and infinite variance. This is a strong argument against attempts to associate
stable Paretian distributions with equilibrium conditions as in Fama [14], or to associate
equilibrium conditions with subordinated (contaminated) distributions as in Clark [8]. The
nonnormal distributions require nonparametric statistical measures such as information theory
entropy analysis, which do not have to make distributional assumptions (Philippatos and Wilson
[36,37]).
A second implication concerns the underlying process of the market. Along with most models
the stationary disequilibrium model assumes that the underlying market process generating
security returns is stationary stochastic and that random external shocks contaminate this process
introducing short term nonstationarities into the process [19, footnote 2]. This suggests that the
dependence and the structure of the market are stable long-term with short-term increases in
dependence due to random external shocks.
Bifurcation theory is used to relax the stationary stochastic process assumption by modeling the
market as an adaptive control process (e.g., Murphy [301). Whenever the market disequilibrium
breaches various bifurcation points, corrective action is implemented. A structural change in the
interrelationships that make up the market structure allows the market to achieve a new stable
disequilibrium. This change or transition to a new structure is known as the bifurcation point. If
the market restructures rapidly enough, the data generated by the market process could
approximate the stationary disequilibrium described in Figure 4. In reality, the market is in a
nonstationary disequilibrium since the market structure is constantly changing.
IMPLICATIONS FOR FUTURE RESEARCH
Testing market data to see whether the market process is stationary stochastic or nonstationary
stochastic is difficult. Murphy [30] suggests that if the g value falls within a statistical limit from
zero, then the market is in a stable disequilibrium. He also suggests that deviations outside of the
limit lead to an unstable or nonstationary disequilibrium. However, the setting of this limit so
that it reflects the economic realities of transaction costs, taxes, and noisy information systems is
difficult.
Studies such as those by Groth [20] and Morse [29] support the stationary disequilibrium model.
Groth found that dependence varies over time and that some securities have more dependence
than other securities. Morse found that dependence varies directly with trading volume.
However, studies need to be set up to test for nonstationary disequilibrium.
One method is to test for dramatic shifts in the market dependence structure. An example of this
is provided in Table 1. Daily returns for 1700 observations were obtained from the Wells Fargo
data tape for the Atlas Corporation (1962—1969). The data were divided into seventeen
nonoverlapping 100-observation subperiods. The dependence of each subperiod was calculated
using serial correlations with one day lags and by using conditional entropy to evaluate a two-by-
two contingency table (plus and minus changes with one-day lags). The relative conditional
entropy calculation from a contingency table is described in Murphy [30, pp. 71—82] and in
Hays and Winkler [21, pp. 796—800]. The conditional entropy measure corresponds to the H
t
variable in equation (8), where H* is equal to 1.0. Starting in subperiod 10, the dependence for

The Financial Review May 1984
Atlas Corp. shows a definite decline with both the conditional entropy and serial correlation
measures.
TABLE 1
Conditional Entropy and Serial Correlation
For 100-Day Nonoverlapping Subperiods for
Atlas Corporation for 1962—1969 (One-Day Lag)
Subperiod Entropy Correlation
1
0.7798a
—0.l850b
2
0.7263a
—0.3311b
3
0.7864a
—0.2407b
4
0.7238a
—0.0027
5
0.6897a
—0.5828b
6
0.7798a
—0.4342b
7
0.7681a
—0.2025b
8
0.7814a
—0.3250b
9
0.7126a
—0.1526
10
0.8601
—0.0879
11
0.8992
— 0.2746b
12
0.8425a
—0.2757b
13
0.8934
0.0256
14
0.9279
—0.1357
15
0.8151a
0.0929
16
0.9239
0.0949
17
0.9175
—0.0937
a indicates that chi—square is significant at 5 percent level.
b indicates that t-test is significant at 5 percent level.
Some type of structural change could have occurred to increase the rate of information flow in
the market for the Atlas stock, leading to significant decreases in dependence.
While both the conditional entropy and serial correlation measures indicate the general decline in
dependence after period 10, there is not an exact one-to-one mapping of the two measures for all
periods. During four periods, the conditional entropy and serial correlation measures did not
agree on whether there is significant dependence. The worst disparity is during period 4 where
the serial correlation is for all purposes zero while the conditional entropy measure is exhibiting
one of its lowest values indicating significant dependence (confirmed by the chi-square). An
exact one to one mapping of the two measures does not exist for two possible reasons: (1) The
underlying distributions are nonnormal and (2) the correlation and entropy techniques measure
different characteristics of the distribution. On this latter issue, Philippatos and Wilson [37] state
that the two measures yield different results because entropy analysis depends on the number of
potential states in distribution, whereas correlation analysis depends on the weights attached to
these states.
Another avenue for testing the nonstationary disequilibrium model is to study the behavior
before and after some structural change in the market. For example, the history of Atlas Corp.
can be studied for a structural change that would explain the shift in dependence. Another
example is to study the impact of the disclosure acts as done by Benston [4] and Nawrocki [31]
or the impact of the Arab oil embargo, as done by Hilliard [221. This approach avoids the
problem of statistically estimating control limits and bifurcation points, since the structural
change is known. The Benston results did not support a clear case of nonstationary
disequilibrium during the 1930s while the Nawrocki study found declines in market dependence
after the implementation of the disclosure acts. Other structural changes to be studied include the
Penn Central crisis and the commercial paper market collapse, growth of institutional markets,
institution of options markets, brokerage account insurance, and negotiated commissions.

The Financial Review May 1984
The nonstationary disequilibrium model also has implications for tests of mechanical trading
rules. Since the amount of dependence varies, the mechanical trading rule should be constructed
so that it adapts to changes in dependence.
During periods of increased dependence, the trading rule should trade aggressively; it should
become more passive (buy and hold) as the dependence declines. Traditional trading rules such
as filter rules arc designed on the assumption that the market process is in a continuous
disequilibrium with nonvarying dependence levels. Murphy [30] suggests that adaptive control
processes be used in economic processes that are in stationary or nonstationary disequilibrium.
Studies by Martell and Philippatos [27] with commodity price data and by Nawrocki [32] with
stock market price data found that adaptive trading rules outperform nonadaptive trading rules,
thus supporting the stationary disequilibrium model. However, neither adaptive trading rule
could outperform a buy-and-hold consistently. If the market process is a nonstationary process, it
seems possible that there exists an adaptive strategy that can outperform a buy-and-hold policy,
depending on the speed of the market restructuring. The reader should note, however, that
neither a stationary nor a nonstationary disequilibrium implies an inefficient market. A market in
disequilibrium is not necessarily inefficient because information and transaction costs prevent
investors from consistently’ exploiting nondisseminated information (Grossman and Stiglitz [19]
and Copeland and Weston [11, Chapter 8]).
SOME CAVEATS CONCERNING THE ROLE OF
ENTROPY MODELS IN FINANCE AND ECONOMICS
While entropy models are well integrated into bifurcation theory [33] and evolutionary theory
[7], there are questions concerning the role of entropy theory in economic theory.
First, there is the philosophical question as to how well entropy models have been integrated into
economic theory [24, 40]. Most of the work integrating entropy models with economics has
already been done. Georgescu-Roegen [17] integrate entropy models with the physical
production of goods and services and the depletion of nonrenewable energy resources. Murphy
[30] and Cozzolino and Zahner [12] integrate entropy models into market allocation systems and
Philippatos and Gressis [351 integrate entropy into the economic theory of choice by providing a
proof of the equivalence of mean-entropy, mean—variance, and second-order stochastic
dominance under conditions of uniform. lognormal and normal distributions.
Second, there is the concern that the statistical application of entropy analysis has become a fad
(i.e., it is used because it is new) with the resulting potential for abuse. As suggested in [24], a
number of studies use entropy analysis improperly. Entropy is used in these studies to measure
the meaningfulness or quality of information. Entropy or information analysis is not superior to
standard statistical analysis in this regard. All statistical analyses detect the presence of
information, but they cannot make judgments on the usefulness of the information.
Because both entropy and variance analysis measure the presence of information, there has to be
some justification for using entropy analysis instead of standard variance analysis. Traditionally,
the justification for the new is that it is better than the old. How does entropy meet this test? One
advantage of entropy analysis is that it does not make a distributional assumption, as does
variance analysis. Even so, entropy and variance analysis may provide the same answers at a
statistical level. Is entropy better in this case? The answer can still be in the affirmative when
studying dynamic processes, because entropy analysis will provide the superior analogue. Since
market dynamics and efficiency are defined in terms of information processes, entropy
(information theory) analysis is the appropriate analogue. The superiority of the technique
derives from the analogue, not from the statistical tool. Bifurcation and entropy theories provide

The Financial Review May 1984
an appropriate analogue for the study of dynamic market disequilibrium. The opportunity to
misuse entropy analysis through misinterpretation of results is certainly real, but it should not
detract from the use of entropy models for studying dynamic economic processes.
REFERENCES
[1] Barry, C. B. “Effects of Uncertain and Nonstationary Parameters Upon Capital Market
Equilibrium Conditions.” Journal of Financial and Quantitative Analysis (September 1978):
419—33.
[2] Beja, A., and M. B. Goldman. “On the Dynamic Behavior of Prices in Disequilibrium.”
Journal of Finance (May 1980): 235—47.
[3] Beja, A., and N. H. Hakansson. “Dynamic Market Processes and Rewards to Up-to-Date
Information.” Journal of Finance (May 1977): 291 —304.
[4] Benson, G. “Required Disclosure and the Stock Market: An Evaluation of the Securities
Act of 1934.” American Economic Review (March 1973): 132—55.
[5] Black, S. \V. “Rational Response to Shocks in a Dynamic Model of Capital Asset
Prices.” American Economic Review (December 1976): 767—79.
[6]Boulding, K. E. Ecodynamics: A New Theory of Societal Evolution. Beverly Hills: Sage
Publications, 1981.
[7] Boulding, K.E. Evolutionary Economics. Beverly Hills: Sage Publications. 1981.
[8]Clark, P. B. “A Subordinated Stochastic Process Model With Finite Variance for Security
Prices.” Econometrica (January 1973): 135—55.
[9] Cohen, K. J.: U. A. Hawawini; S. F. Maier; R. A. Schwarz; and D. K. Whitcomb.
“Implications of Microstructure Theory for Empirical Research on Stock Price Behavior.”
Journal of Finance, (May 1980): 249—57.
[10] Copeland, T. E. “A Model of Asset Trading Under the Assumption of Sequential
Information Arrival.” Journal of Finance (September 1976): 1149—68.
[11] Copeland, T.E. and J. F. Weston. Financial Theory and Corporate Policy. Reading,
MA: Addison Wesley, 1979.
[12] Cozzolino, J. M., and M.J. Zahner. “The Maximum-Entropy Distribution of the Future
Market Price of a Stock.” Operations Research (1973): 1200—11.
[13] Dinkel, J. J., and G. A. Kochenberger. “Constrained Entropy Models: Solvability and
Sensitivity.” Management Science, (June 1979): 555—64.
[14] Fama, E. F. “Efficient Capital Markets: A Review of Theory and Empirical Work.”
Journal of Finance (May 1 970): 383 —417.
[15] Fielitz, B. “Macroinformation and the Variability of Stock Market Prices: Discussion.”
Journal of Finance (May 1979): 465—9.
[16]
Friend, I.. and R. Westerfield. ‘Required Disclosure and the Stock Market:
Comment.” American Economic Review June 1975): 467—72.

The Financial Review May 1984
[17] Georgescu-Roegen, N., Entropy Law and Economic Processes. Boston:
Harvard University Press, 1971.
[18] Gonedes, N. J. “Information—Production and Capital Market Equilibrium.” Journal of
Finance (June 1975): 84 1 — 64.
[19] Grossman, S. and J. Stiglitz. “Information and Competitive Price Systems.” American
Economic Review (May 1976): 246—53.
[20] Groth, J. “Security-Relative Information Market Efficiency: Some Empirical
Evidence.” Journal of Financial and Quantitative Analysis (September l979): 573—93.
[21] Hays, W., and R. Winkler. Statistics: Probability, Inference and Decision. Holt,
Rinehart, and Winston, 1971.
[22] Hilliard, J. “The Relationship Between Equity Indices on World Exchanges.” Journal
of Finance (March 1979): 103—14.
[23] Ho, T., and A. Saunders. “A Catastrophe Model of Bank Failure.” Journal of Finance
(December 1980): 1189—1208.
[24] Horowitz, A. and I. Horowitz. “The Real and Illusory Virtues of Entropy-Based
Measures for Business and Economic Analysis.” Decision Sciences (January 1976): 121 —
36.
[25] Kaplan, R. “The Significance and Investigation Cost Variances: Survey and
Extensions.” Journal of Accounting Research (Autumn 1975): 311—37.
[26] Majthay, A. “Bifurcations in Dynamical Systems.” Decision Sciences (April 1980):
384—407.
[27] Martell, T., and G.Philippatos. “Adaptation, Information and Dependence in
Commodity Markets.” Journal of Finance (May 1974): 493—8.
[28] Merton, R. C. “An Intertemporal Capital Asset Pricing Model.” Econometrica
(September 1973): 867—87.
[29] Morse, D., “Assymmetrical Information in Securities Markets and Trading Volume.”
Journal of Financial and Quantitative Analysis (December 1980): 1129—48.
[30] Murphy, R. Adaptive Processes in Economic Systems. Academic Press, 1965.
[31] Nawrocki, D. “Short Sales and Mechanical Trading Rules.” The Financial Review
(Spring 1981): 16—29.
[32] Nawrocki, D. “Adaptive Trading Rules and Dynamic Market Disequilibrium.”
Applied Economics, (February 1984): 1—14.
[33] Nicolis, G., and I. Prigogine. Self-Organization in Nonequilibrium Systems. John Wiley
and Sons, 1977.
[34] Oldfield, G.; R. Rogalski; and R. Jarrow. “An Autoregressive Jump Process for
Common Stock Returns.” Journal of Financial Economics (December 1 977): 389—418.
[35] Philippatos, G., and N. Gressis. “Conditions of Equivalence Among EV, SSD and EH
Portfolio Selection Criteria: The Case for Uniform Normal and Lognormal Distributions.”
Management Science (February 1975): 617—25.

The Financial Review May 1984
[36] Philippatos, G., and C. Wilson, “Entropy, Market Risk, and the Selection of Efficient
Portfolios.” Applied Economics (September 1972): 209—20.
[37] Philippatos, G., and C. Wilson, “Entropy, Market Risk, and the Selection of Efficient
Portfolios: Reply” Applied Economics (September 1972): 76—9.
[38] Scapens, W.: R. Ryan: and L. Fletcher. “Explaining Corporate Failure: A Catastrophe
Theory Approach.”, Journal of Business Finance and Accounting (Spring 1981): 1 —26.
[39] Thom, R. Structural Stability and Morphogenesis. Benjamin-Addison Wesley. 1972.
[40] White. D. “Entropy. Market Risk and the Selection of Efficient Portfolios: Comment.
Applied Economics (September 1974): 73-75.
Wyszukiwarka
Podobne podstrony:
PRICING INTELLIGENCE 2 0 A Brief Guide to Price Intelligence and Dynamic Pricing by Mihir Kittur
Entropy, Area And Black Hole Pairs
Corporate identity corporate branding and corporate marketing
Glaeser Psychology and the Market
Rica de la S , ‘’Social and Labour Market Integration of Ethnic Minorities in Spain’’,
Fishea And Robeb The Impact Of Illegal Insider Trading In Dealer And Specialist Markets Evidence Fr
blurring and stretching marketing tricks key
the genesisi and dynamics of organizational networks
Special Report Home Based Business And Affiliate Marketing Exposed
dynamiczny marketer
Chordia, Sarkar And Subrahmanyam An Empirical Analysis Of Stock And Bond Market Liquidity
Siburg K F The principle of least action in geometry and dynamics (Springer LNM1844, 2004)(ISBN 3540
blurring and stretching marketing tricks
Economic Forces and Stock Market
SegerFeldt Frederik Water For Sale How Business And The Market Can Resolve The World s Water Crisis
Franzen social networks and labour market outcomes
Akerlof The market for lemons quality uncertainty and the market mehcanism
więcej podobnych podstron