
Biomechanic Changes in Passive Properties of Hemiplegic
Ankles With Spastic Hypertonia
Sun G. Chung, MD, PhD, Elton van Rey, PT, Zhiqiang Bai, Elliot J. Roth, MD, Li-Qun Zhang, PhD
ABSTRACT. Chung SG, van Rey E, Bai Z, Roth EJ, Zhang
L-Q. Biomechanic changes in passive properties of hemiplegic
ankles with spastic hypertonia. Arch Phys Med Rehabil 2004;
85:1638-46.
Objective: To investigate quantitatively biomechanic changes
in the passive properties of hemiplegic spastic ankles.
Design: Evaluation of spastic hypertonia by moving the
ankle joint slowly between dorsiflexion and plantarflexion ex-
treme positions under controlled joint torque and position.
Setting: Institutional research center.
Participants: Twenty-four stroke patients with spastic an-
kles and 32 healthy controls.
Interventions: Not applicable.
Main Outcome Measures: Passive resistance torque at con-
trolled dorsiflexion and plantarflexion positions, dorsiflexion
and plantarflexion range of motion (ROM) at controlled
torques, and quasistatic stiffness and energy loss in dorsiflexion
and plantarflexion.
Results: Spastic hypertonic ankles showed significant alter-
ations of the passive properties in plantarflexion (P
⫽.041) as
well as in dorsiflexion (P
⫽.016) directions. Compared with
healthy controls, spastic ankles showed higher resistance
torque (9.51
⫾4.79Nm vs 6.21⫾3.64Nm, P⫽.016), higher qua-
sistatic
stiffness
(.54
⫾.19Nm/deg vs .35⫾.20Nm/deg,
P
⫽.001) at 10° of dorsiflexion, larger normalized dorsiflexion
energy loss (.068
⫾.04J/deg vs .04⫾.02J/deg, P⫽.037), and
decreased dorsiflexion ROM at 10Nm of resistance torque
(10.77°
⫾8.69° vs 20.02°⫾11.67°, P⫽.014). The resistance
torque, ROM, and stiffness of spastic hypertonic ankles in
plantarflexion showed similar changes (P
⬍.05) to those in
dorsiflexion. The passive ROM, joint stiffness, and resistance
torque at controlled positions correlated with each other and
also correlated with the Modified Ashworth Scale (P
⬍.01).
Conclusions: Various biomechanic changes in both plantar-
and dorsiflexors are associated with spastic hypertonia of
chronic stroke patients, and they can be evaluated quantita-
tively under well-controlled conditions. With simplifications,
the various measures in this study can potentially be used to
obtain more comprehensive and quantitative evaluations of
spastic hypertonia in a clinical setting.
Key Words: Ankle; Contracture; Hemiplegia; Muscle spas-
ticity; Rehabilitation.
© 2004 by the American Congress of Rehabilitation Medi-
cine and the American Academy of Physical Medicine and
Rehabilitation
D
ESPITE THE CLINICAL SIGNIFICANCE of spastic hy-
pertonia, its underlying mechanisms are often not clear.
1-4
The increased mechanical resistance to passive movement may
be related to hyperactive reflexes and/or caused by nonreflex
biomechanical changes in muscles and connective tissues.
2
Some investigators
5-10
have shown that the increased resistance
in spastic limb movement is mainly caused by hyperactive
reflexes, as shown in exaggerated tendon jerks and increased
H-reflex responses. On the other hand, other investigators
3,11-17
believe that spastic hypertonia is independent of hyperactive
reflexes, and mechanical changes of muscles are the main
reasons for the increased muscle tone in spasticity. Further-
more, the nonreflex contributions include the dynamic compo-
nent of viscous damping (dashpot-like property with resistance
proportional to velocity) and static component of elastic stiff-
ness (spring-like property with resistance proportional to dis-
placement), and reflex changes may have both phasic (dy-
namic)
and
tonic
(static)
components.
The
different
components may contribute to the increased resistance in pas-
sive movement of spastic limbs. It is often not clear whether
each of these components is enhanced in spastic limbs or
not.
2,3,5,10,11,15,18
Spastic hypertonia at the ankle joint is a major source of
disabilities after stroke. Both reflex and nonreflex changes in
ankles with spastic hypertonia can substantially affect the func-
tional performance of stroke patients. Several studies
11,19-22
have suggested that nonreflex changes had more profound and
consistent effects than did reflex changes. Moreover, some
argued that changes in ankle passive biomechanic properties
could contribute to the internal ankle joint torque in functional
movement, depending on the severity of spasticity.
22-24
There is
a need for more precise evaluation and comprehensive under-
standing of the passive biomechanic changes in hemiplegic
ankles. Although there have been many methods to evaluate
reflex changes in spasticity such as the tendon reflex and
H-reflex tests, less work has been done to quantify passive
mechanical changes of spastic muscles and joints comprehen-
sively over large samples in both plantarflexion and dorsiflex-
ion. Only a few studies
25-27
were carried out using small
samples to evaluate some of the biomechanic changes in spas-
tic ankles with focus on the plantarflexors.
The purpose of this study was to investigate changes in passive
biomechanic properties of both plantarflexors and dorsiflexors in
ankles with spastic hypertonia by using a well-controlled device,
including passive resistance torque at common ankle positions,
passive range of motion (PROM) at controlled resistance torque,
passive elastic stiffness, energy loss involving viscoelasticity, and
correlations of the above quantitative measures with the Modified
Ashworth Scale
28-30
(MAS).
From the Rehabilitation Institute of Chicago, Chicago, IL (Chung, van Rey, Bai,
Roth, Zhang); Departments of Physical Medicine & Rehabilitation (Chung, van Rey,
Bai, Roth, Zhang), Orthopaedic Surgery (Zhang), and Biomedical Engineering
(Zhang), Northwestern University, Chicago, IL; and Department of Rehabilitation
Medicine, Seoul National University, Seoul, South Korea (Chung).
Presented in part at the 4th World Congress of Biomechanics, August 4 –9, 2002,
Calgary, AB, Canada, and at the 2nd World Congress of the International Society of
Physical and Rehabilitation Medicine, May 18 –22, 2003, Prague, Czech Republic.
Supported by the National Institute on Disability and Rehabilitation Research and
National Institutes of Health.
No commercial party having a direct financial interest in the results of the research
supporting this article has or will confer a benefit upon the author(s) or upon any
organization with which the author(s) is/are associated.
Reprint requests to Sun G. Chung, MD, PhD, Sensory Motor Performance Pro-
gram, Rehabilitation Institute of Chicago, 345 E Superior St, Ste 1406, Chicago IL,
60611, e-mail: suncg@plaza.snu.ac.kr.
0003-9993/04/8510-8651$30.00/0
doi:10.1016/j.apmr.2003.11.041
1638
Arch Phys Med Rehabil Vol 85, October 2004

METHODS
Participants
Twenty-four stroke patients (15 men, 9 women) with a mean
age
⫾ standard deviation (SD) of 55.3⫾10.1 years participated
in the study. All patients had hemiparesis caused by cerebro-
vascular accidents at least a year before the experiment
(9
⫾5.7y of mean duration of hemiparesis and evidence of
supratentorial lesion in all cases, with hemorrhage in 11 and
ischemia in 13 patients) and spastic hypertonia in ankles of the
involved sides as determined by physical examination includ-
ing motor, sensory, and reflex examinations and the MAS.
28-30
The MAS was conducted at 60° of knee flexion, the same
position as in the experiment. Patients who did not have spastic
ankles were excluded from the study if they had less than a
grade 3 score of the Achilles’ tendon reflex and a score of 0 on
the MAS (range, 0 – 4). Subjects who had previous ankle in-
jury, surgery, or any kind of neurolytic injections were ex-
cluded. Thirteen subjects had left side weakness, and 11 sub-
jects had right hemiparesis. Thirty-two healthy subjects (17
men, 15 women; mean age, 42.1
⫾20.5y) were included as
controls. None of the control subjects had sustained injury or
had had surgery on the foot or ankle. The study was approved
by the institutional review board of Northwestern University.
All subjects gave informed consent before the experiment.
Experimental Setup
The evaluation was done by using a custom-designed joint
driving device (fig 1). The joint driving device moved the ankle
at a well-controlled speed, and it slowed down as resistance
torque increased. In this way, the joint muscles were moved
under controlled load, and reflex-mediated responses were
minimized.
31
Subjects were seated with the thigh and trunk
strapped to the seat and backrest, respectively. The leg was
strapped to the leg support and fixed at 60° of knee flexion
angle. The foot was held firmly to a footplate by using a
premolded plastic cast and clamps. The footplate was mounted
onto the motor shaft through a 6-axis force sensor
a
that mea-
sured the torques at the ankle joint. The seat was adjusted and
locked in 4 degrees of freedom, and the footplate could be
adjusted in the toe-heel, mediolateral, and superior-inferior
directions to align the ankle flexion axis with the motor shaft
and the axis of the 6-axis force sensor. The ankle flexion axis
was assumed to pass through the inferior tip of medial malle-
olus, perpendicular to the sagittal plane of lower leg. Surface
electrodes were attached on the bellies of tibialis anterior,
medial and lateral gastrocnemius, and soleus muscles to mon-
itor electromyographic activities during the passive movement.
Subjects were asked to relax as much as they could, and
electromyographic signals were used to monitor muscle acti-
vation during the passive movement.
Protocol
Neutral ankle joint position was determined by positioning
the sole of the foot at 90° with respect to the long axis of the
lower leg. To measure initial offset torque of the ankle joint,
the footplate was fixed at the neutral position or at a position as
close to neutral as possible without stretching the potentially
stiff ankle joints. The initial offset torque at the neutral position
was measured while the subject was asked to relax.
The ankle joint was moved passively in both dorsiflexion
and plantarflexion directions by the joint-driving device, which
was controlled digitally based on position/velocity and torque
feedback. Torque limits were set for both directions of passive
movement at 10Nm, with the initial torque offset subtracted.
For safety purpose, position limits were determined by manual
range of motion (ROM) measurement and set for both the
dorsiflexion and plantarflexion directions. The joint-driving
device moved the ankle passively and repeatedly in both di-
rections in 90-second trials. The ankle flexion, 6-axis forces
and torques, and dynamic electromyographic signals from the
tibialis anterior, soleus, and medial and lateral gastrocnemius
muscles were recorded at 500Hz, after antialiasing filtering
with the cutoff frequency of 230Hz.
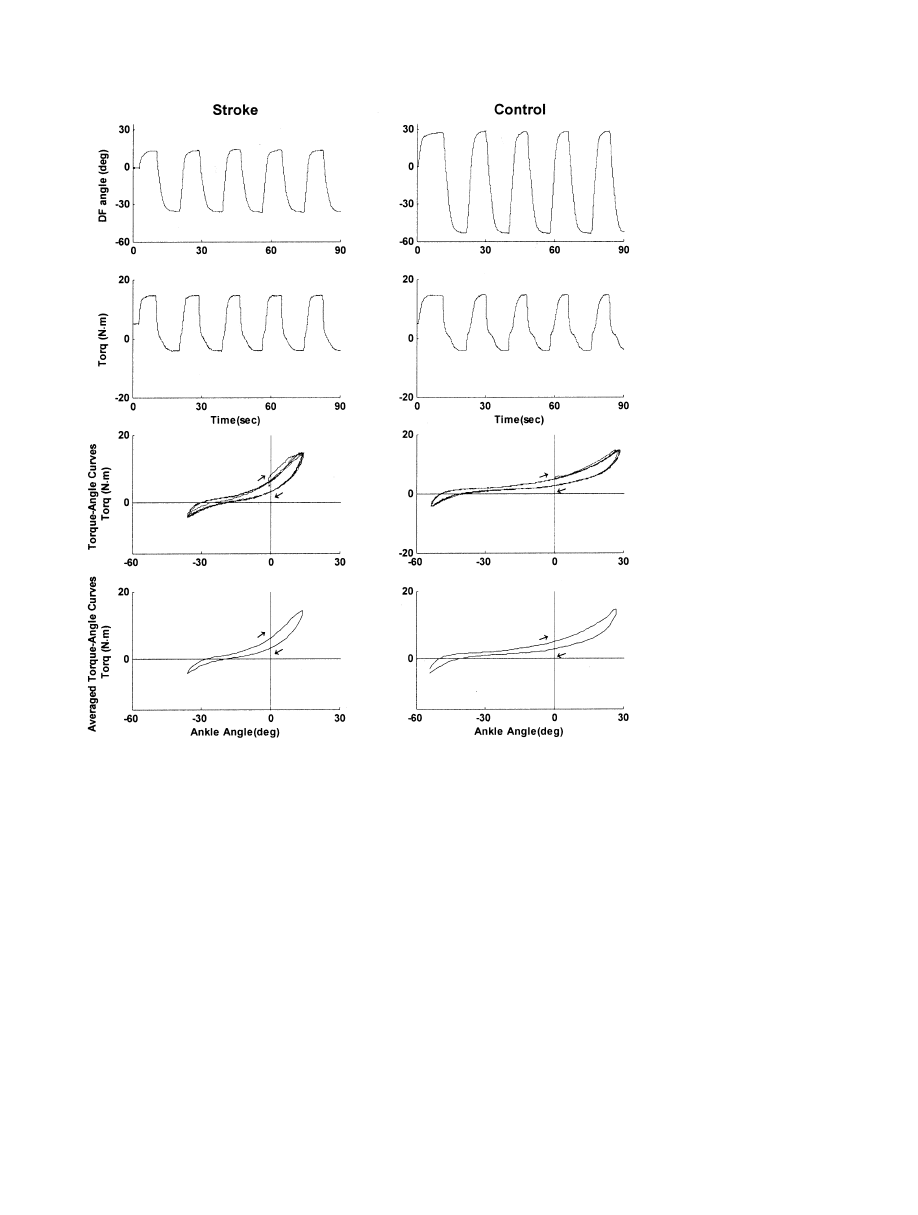
Fig 1. Experimental setup for
evaluating ankle biomechanic
properties. The seat was ad-
justed in 4 degrees of freedom
to align the ankle flexion axis
with the motor shaft. A 6-axis
force sensor was mounted
between the motor shaft and
the foot attachment. The foot
and cast were clamped and
strapped to the attachment
with appropriate alignment.
The leg was strapped to the
leg support at 60° of knee flex-
ion. The thigh and trunk were
strapped to the seat and back-
rest, respectively, with the hip
at 85° of flexion. Abbrevia-
tions: EMG, electromyograph;
PC, personal computer.
1639
BIOMECHANIC CHANGES IN SPASTIC ANKLES, Chung
Arch Phys Med Rehabil Vol 85, October 2004
Data Analysis
Resistance torque, gravity compensation, and offset adjust.
The force and torque signals measured from the 6-axis force
sensors were transformed into anatomic joint torques, with the
passive resistance torque generated by ankle plantarflexors as
positive. Initial torque offset measured at the beginning of the
experiment was subtracted from the joint torque. The gravita-
tional force of the foot and the footplate was calculated and
compensated at each position within the ROM. The weight and
center of mass of the foot were calculated from the anthropo-
metric data including the body weight, foot length, and the
width and height of the malleolus measured from the subject.
32
Torque-angle curves (hysteresis loops).
The anatomic
joint torque and angle were plotted to get torque-ankle hyster-
esis loops. The number of hysteresis loops during each passive
movement trial ranged from 4 to 6, depending on the ROM of
the subject. Each hysteresis loop was divided into 2 limbs, the
ascending limb for dorsiflexion direction movement and the
descending limb for plantarflexion direction movement. Each
limb of multiple hysteresis loops was averaged to generate 1
representative hysteresis loop (averaged torque-angle curve)
for each subject (fig 2). The torques corresponding to every 1°
of joint angle in either the upper or lower limbs of the hyster-
esis loops were averaged to reduce multiple hysteresis loops
into a single representative hysteresis loop (averaged torque-
angle curve) for each subject (see fig 2, row 4).
Several parameters were obtained from the averaged torque-
angle curves to characterize the passive biomechanic properties
of spastic hypertonic ankles: the passive resistance torque at
controlled positions, the passive dorsiflexion and plantarflexion
ROMs at controlled resistances, quasistatic stiffness, and nor-
malized dorsiflexion and plantarflexion energy loss related to
the viscoelastic properties of the joint. All the parameters were
measured in both the ascending and descending limbs of each
hysteresis loop to evaluate the properties of ankle dorsiflexors
and plantarflexors.
Passive resistance torque.
Because the joint torque mea-
sured by the 6-axis force sensor was the resisting torque of
ankle joints to the passive movement, the torque corresponding
to each ankle angle of an averaged torque-angle curve for either
Fig 2. Representative signals dur-
ing passive movement trials on a
stroke patient (left column) with a
spastic ankle and an age- and sex-
matched control (right column).
The top and the second rows cor-
respond to the ankle joint angle
(positive for dorsiflexion [DF]) and
ankle joint torque (positive for
plantarflexion resistance torque),
respectively. The joint torque is
gravity compensated and offset (at
the 0° dorsiflexion angle) adjusted.
The trial lasted 90 seconds and the
joint was held at the extreme
ROMs for 3 seconds. The plots at
the third and bottom rows show
the raw (over multiple cycles) and
averaged torque-angle curves, re-
spectively. The x axis is the dorsi-
flexion angle and the y axis is the
passive resistance torque. Aver-
aged torque-angle curves were cal-
culated by averaging the torque
values at every 1° of the ankle po-
sition to represent the viscoelastic
properties of each ankle with a hys-
teresis loop. The curve moves
clockwise as time progresses as in-
dicated by the arrows.
1640
BIOMECHANIC CHANGES IN SPASTIC ANKLES, Chung
Arch Phys Med Rehabil Vol 85, October 2004

direction of movement was regarded as the passive resistance
torque at that ankle angle. The passive resistance torque of a
stroke subject at
⫺30° ankle angle, for example, was indicated
by the s.PF-PRT point (as defined in fig 3). The passive
resistance torque of ankle plantarflexor (resistance torque to
dorsiflexion direction movement) was measured at 10° of dor-
siflexion and that of ankle dorsiflexor (resistance torque to
plantarflexion direction movement) was sampled at 30° of
plantarflexion for comparison between the groups. In addition
to these sampled passive resistance torques, torque-angle
curves for dorsiflexion and plantarflexion directions were com-
pared between the stroke and control groups at each ankle
angle at a 1° interval to assess the alterations of passive torques
in a continuous profile (fig 4).
Passive dorsiflexion and plantarflexion ROM.
PROMs
were defined as the ankle joint angles at controlled dorsiflexion
and plantarflexion torques. The dorsiflexion ROM was taken
from the upper limb of the representative hysteresis loop (dor-
siflexion direction movement) at the 10Nm torque level (the
ankle angle at s.DF and c.DF points in fig 3) and the plantar-
flexion ROM from the lower limb of the representative hyster-
esis loop (plantarflexion direction movement) at
⫺3Nm (the
angle at s.PF and c.PF in fig 3).
Quasistatic stiffness.
To investigate the changes in the
static component of passive mechanical properties, the stiffness
of ankle plantar- and dorsiflexors were assessed as K
⫽⌬T/⌬
,
where K is the quasistatic stiffness (spring-like property char-
acterized by the elastic stiffness of the spring), and
⌬T is the
passive torque increment during a certain amount of ankle
angular movement (
⌬
). As ⌬ becomes infinitely small, the
quasistatic stiffness approaches the slope of a tangential line of
the torque-angle curve at a specific ankle position.
33
Quasistatic
stiffness was calculated at every 1° of ankle angle in the ROMs
of the averaged torque-angle curves in both dorsiflexion and
plantarflexion directions by taking the slope of the regression
curve to fit 6 data points (3 points before and after) around a
specific ankle angle. Quasistatic stiffness of ankle plantarflexor
(stiffness in dorsiflexion direction movement) was evaluated at
10° of dorsiflexion and that of ankle dorsiflexor (stiffness in
plantarflexion direction movement) at 30° of plantarflexion (fig
3). To assess the differences of quasistatic stiffness of the ankle
joint in a continuous profile, quasistatic stiffness for either
dorsiflexion or plantarflexion direction was compared between
the stroke and control groups at each ankle angle at a 1°
interval throughout ankle ROMs.
Normalized dorsiflexion and plantarflexion energy loss.
Because the area under the upper limb of the hysteresis loop
represents the energy needed to move the muscle-tendon unit
and the area under the lower limb represents the energy during
the release, the difference in the area under the 2 curves—the
area enclosed within the hysteresis loop—represents the energy
loss within the joint muscles involved.
33
The energy loss was
calculated for both dorsiflexion and plantarflexion ROMs (fig
3). Because different subjects had different ROMs, the energy
loss was normalized to the corresponding maximum dorsiflex-
ion or plantarflexion ROM (eg, the dorsiflexion range in fig 3).
Statistical Analysis
To examine whether passive biomechanic properties of an-
kle plantarflexors and dorsiflexors were changed in spastic
hypertonia, the 4 parameters characterizing the passive prop-
erties of ankle joints—(1) the passive resistance torque at
controlled positions, (2) the dorsiflexion and plantarflexion
ROMs measured at controlled torques, (3) quasistatic stiffness,
and (4) normalized energy loss—were compared between the
spastic hemiplegic ankles and controls. Because spastic hyper-
Fig 3.
Representative aver-
aged
torque-angle
curves
(hysteresis
loops)
from
a
stroke and a healthy subjects.
The x axis is the dorsiflexion
angle, and the y axis is the
passive resistance torque. The
curve
moves
clockwise
as
time (and the passive move-
ment)
progresses,
as
indi-
cated by the 2 bigger arrows.
Dorsiflexion
ROMs
(s.DF
[stroke] c.DF [control]) taken
at 10Nm of the passive plan-
tarflexor
resistance
torque
and plantarflexion (PF) ROMs
(s.PF [stroke] c.PF [control])
at
ⴚ3Nm of the passive dorsi-
flexor resistance torque are
shown. The s.PF-PRT point is
an example of passive resis-
tance torque measured at a
ⴚ30° (plantarflexion) ankle an-
gle in the stroke subject. The
slopes of 2 curve-fitted lines
(s.stiff, c.stiff) are the quasis-
tatic stiffness of the plantar-
flexor at the corresponding
torque levels. The shaded area
(DF E Loss) is the energy loss
in dorsiflexion position, which
is divided by the dorsiflexion
ROM (dorsiflexion range) to
get
normalized
dorsiflexion
energy loss. Normalized plan-
tarflexion energy losses are
calculated similarly.
1641
BIOMECHANIC CHANGES IN SPASTIC ANKLES, Chung
Arch Phys Med Rehabil Vol 85, October 2004

tonia in stroke may affect the 4 parameters simultaneously and
the parameters may be interrelated, multivariate analysis of
variance (MANOVA) procedures
b
were used to compare the 4
parameters as a whole between the 2 groups in dorsiflexion and
plantarflexion directions. Normality and equality of covari-
ances were tested by Kolmogorov-Smirnov and Levene tests,
respectively. Statistical significance was accepted if the P value
of the Pillai trace was less than .05.
34
If the MANOVA test for
dorsiflexion or plantarflexion direction showed significant dif-
ference between the 2 groups, univariate analysis of variance
(ANOVA) procedures were used to evaluate which parameters
of the passive properties were significantly changed by spastic
hypertonia.
In addition to alterations determined by the univariate
ANOVA tests following MANOVA, the extent of the alter-
ations were shown in continuous profiles of the passive resis-
tance torque and quasistatic stiffness during dorsiflexion and
plantarflexion direction movement throughout ankle ROMs.
Passive resistance torque and quasistatic stiffness were com-
pared between 2 groups at each ankle joint angle at a 1° interval
by using independent-samples t test after determination of
normality by Kolmogorov-Smirnov test.
34,b
Correlations be-
tween the MAS and the 4 quantitative parameters of the passive
properties were investigated. Because the quantitative param-
eters were continuous while the MAS was ordinal, both the
Pearson product-moment correlation coefficient (r) and the
Kendall rank-correlation coefficient (
) were calculated.
34
A
Pearson r greater than .353 or a Kendall
greater than .346
with a P value less than .01 was considered significant.
RESULTS
Passive Properties in Dorsiflexion Direction Movement
The parameters of the passive properties in the dorsiflexion
direction movement showed a significant difference between
the stroke and control group by the MANOVA test (P pertain-
ing to Pillai trace
⫽.016). All of the subsequent univariate
ANOVAs for each parameter also demonstrated meaningful
differences between the 2 groups: spastic hypertonic ankles
showed higher passive resistance torque at the common 10° of
dorsiflexion (9.51
⫾4.79Nm vs 6.21⫾3.64Nm, P⫽.016),
higher quasistatic stiffness (.54
⫾.19Nm/deg vs .35⫾.20Nm/
deg, P
⫽.001) at 10° of dorsiflexion, larger normalized dorsi-
flexion energy loss (.06
⫾.04J/deg vs .04⫾.02J/deg, P⫽.037),
and decreased dorsiflexion ROM at a controlled 10Nm torque
(10.77°
⫾8.69° vs 20.02°⫾11.67°, P⫽.014) than the controls
(fig 5).
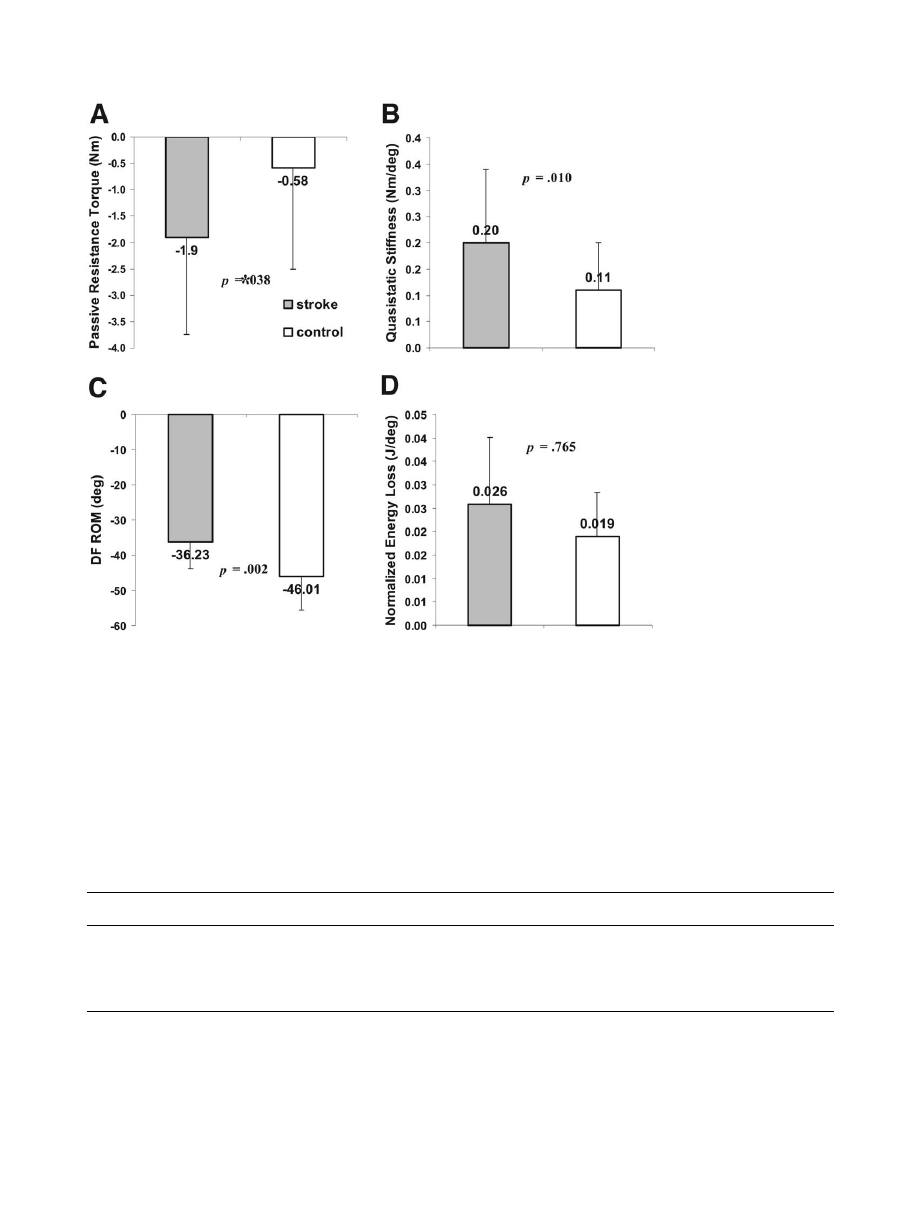
Passive Properties in Plantarflexion Direction Movement
In plantarflexion direction movement, the passive properties
as a whole also showed a significant difference between the
stroke and control groups (MANOVA, P pertaining to Pillai
trace
⫽.041). Subsequent univariate ANOVA tests for each
parameter revealed significantly higher passive resistance
torque (
⫺1.90⫾1.84Nm vs ⫺.58⫾1.92Nm, P⫽.038), higher
quasistatic stiffness (.20
⫾.14Nm/deg vs .11⫾.09Nm/deg,
P
⫽.001) at 30° of plantarflexion, and decreased plantarflexion
ROM at a
⫺3Nm torque (36.23°⫾7.63° vs⫺46.01°⫾9.65°,
P
⫽.002) in the stroke group than in the control group. The
Fig 4. Continuous profiles of
the passive resistance torque
and quasistatic stiffness in the
stroke and control groups.
Torque-angle curves are aver-
aged across subjects in each
group at every 1° joint angle.
Quasistatic stiffness at each
ankle angle is calculated and
also averaged across subjects
in each group. Both (A) aver-
aged torque and (B) stiffness
curves are plotted for stroke
and
control
groups
during
dorsiflexion
direction
and
plantarflexion direction move-
ment as indicated with ar-
rows. The curves were poly-
nomially
fitted,
and
the
symbols are shown at 2° inter-
vals in the common ankle
ROM. The vertical error bars
(shown in 1 direction for sim-
plicity) represent the standard
error of mean. Significant dif-
ferences are marked with as-
terisks.
1642
BIOMECHANIC CHANGES IN SPASTIC ANKLES, Chung
Arch Phys Med Rehabil Vol 85, October 2004

normalized plantarflexion energy loss was not statistically sig-
nificant (.03
⫾.01J/deg in stroke vs .02⫾.01J/deg in controls,
P
⫽.765; fig 6).
Continuous Profiles of Passive Torques and Stiffness
Throughout Ankle ROMs
For investigation of continuous profiles of passive proper-
ties, the passive resistance torque during each direction move-
ment was averaged and compared between the 2 groups at
every 1° of ankle angle (fig 4). The stroke group showed higher
passive resistance torque especially at 4° and higher of dorsi-
flexion ROMs in the upper graph (dorsiflexion direction move-
ment) and showed higher resistance torque at
⫺28° and lower
of plantarflexion ROMs in the lower graph (plantarflexion
direction movement) than control group (independent-samples
t test, P
⬍.05). Although the passive resistance torques at each
joint angle differed statistically only in extreme ROMs, the
quasistatic stiffness was significantly higher in the spastic
ankles throughout almost the whole ROMs in both dorsiflexion
and plantarflexion directions (fig 4).
Correlations Between the MAS Scores and the 4
Biomechanic Parameters
The MAS scores of the spastic hypertonic ankle plantarflex-
ors showed significant correlations with the quantitative pa-
rameters of passive properties, except for the normalized en-
ergy loss (table 1). Among the significant correlations, the
Kendall
between the MAS and the passive resistance torque
at 10° of dorsiflexion (
⫽.255), dorsiflexion ROM at 10Nm
(
⫽⫺.323), and quasistatic stiffness at 10° of dorsiflexion
(
⫽.312) were relatively low, whereas the 4 quantitative bio-
mechanic parameters had strong correlations between each
other with the Pearson r of
⫺.895 between the dorsiflexion
ROM and passive torque, r of .687 between the stiffness and
passive torque, and r of
⫺.721 between the stiffness and
dorsiflexion ROM (P
⬍.01).
DISCUSSION
Passive properties of spastic hypertonic ankles in stroke
patients were investigated and compared with their counter-
parts in healthy subjects by moving ankle joints passively
under precise control without provoking considerable reflex-
mediated electromygraphic responses. Spastic hypertonic an-
kles showed significant alterations of the passive properties in
both dorsiflexion and plantarflexion directions. In the dorsiflex-
ion direction, where the ankle plantarflexors were stretched, the
spastic group showed increased quasistatic stiffness and pas-
sive resistance torques, decreased dorsiflexion ROMs, and
larger normalized energy loss. In the plantarflexion direction
movement, where ankle dorsiflexors were preferentially
stretched, the 4 parameters of spastic hypertonic ankles showed
similar changes as in the dorsiflexion direction movement,
except the increased normalized energy loss was not signifi-
cant. Continuous profiles of passive resistance torques and
quasistatic stiffness showed that the passive resistance torques
differed only at extreme ROMs, whereas the quasistatic stiff-
ness differed across almost the whole ROM. The 4 parameters
of altered passive properties had strong and significant corre-
Fig 5.
Comparisons of pas-
sive properties in dorsiflexion
direction movement between
groups. Mean and SDs of the
parameters are shown. The
stroke group shows higher (A)
passive resistance torque, (B)
quasistatic stiffness at 10° of
dorsiflexion, (C) larger normal-
ized dorsiflexion energy, loss
and (D) decreased dorsiflexion
ROM at 10Nm torque level.
Statistical
significances
are
shown with P values by uni-
variate ANOVAs following a
MANOVA testing 4 parame-
ters
together
(P
of
Pillai
trace
ⴝ.016).
1643
BIOMECHANIC CHANGES IN SPASTIC ANKLES, Chung
Arch Phys Med Rehabil Vol 85, October 2004
lations with each other, whereas weaker but still significant
correlations were found between the MAS of spastic hyper-
tonic ankle plantarflexors and the quantitative parameters of
passive properties in the dorsiflexion direction movement.
These findings indicate that there are significant changes in the
passive mechanical properties in spastic hypertonia of chronic
stroke patients in both dorsiflexion and plantarflexion direc-
tions, which correlated with the routine clinical measurement
of the MAS.
Reflex and/or Nonreflex Changes of Spastic Hypertonia
It has been reported that spastic hypertonia is associated with
reflex
5-10
and/or nonreflex changes.
11-13
The former is sup-
ported by the exaggerated tendon jerks and the increased H-
reflex response.
5-10
and the latter is associated with mechanical
changes.
11-13
Several reports supported the predominant con-
tribution of nonreflex component. Dietz et al
11,12
have sug-
gested that changes in mechanical muscle properties were
mainly responsible for muscle hypertonia. Lee et al
13
reported
that, for voluntarily activated muscles of spastic hemiparetic
patients, the stretch reflex gains of spastic and contralateral
limbs did not differ significantly. O’Dwyer et al
14,15
reported
that hypertonia in the upper limbs of stroke patients within 13
months of their stroke was associated with contracture but not
with reflex hyperexcitability. Sinkjaer et al
3,16,17
reported that
spastic muscles in stroke patients had an increased nonreflex
Fig 6.
Comparisons of pas-
sive properties in plantarflex-
ion direction movement be-
tween groups. The stroke
group
shows
significantly
higher (A) passive resistance
torque, (B) quasistatic stiff-
ness at 30° of plantarflexion,
(C) decreased plantarflexion
ROM at a
ⴚ3Nm torque level.
However, (D) normalized plan-
tarflexion
energy
loss
was
slightly higher in the stroke
group but was not statistically
significant. Statistical signifi-
cances are shown with P values
by univariate ANOVAs pro-
tected by a MANOVA with 4
parameters together (P of Pillai
trace
ⴝ.041).
Table 1: Correlations Between the Biomechanic and Clinical Measures
Measures
MAS
Resistance Torque
at 10° of DF
DF ROM at 10Nm
Stiffness at 10° of DF
DF Energy Loss
MAS
1.00
.294*
⫺.380
†
.297*
.230*
Resistance torque at 10° of DF
.255
†
1.00
⫺.895
†
.687
†
.487
†
DF ROM at 10Nm
⫺.323
†
⫺.826
†
1.00
⫺.721
†
⫺.464
†
Stiffness at 10° of DF
.312
†
.517
†
⫺.597
†
1.00
.377
†
DF energy loss
.139
.438
†
⫺.407
†
.223*
1.00
NOTE. The Kendall
values are in italics (calculated for the correlations between the MAS scores and quantitative parameters), and the
Pearson coefficients are in roman (for the correlations among the quantitative parameters). The correlation analysis was done only with the
parameters in the dorsiflexion (DF) direction, because the MAS was measured in the ankle plantarflexors. A Pearson r
⬎.353 or a Kendall
⬎.346 with P⬍.01 was considered significant.
*P
⬍.05.
†
P
⬍.01.
1644
BIOMECHANIC CHANGES IN SPASTIC ANKLES, Chung
Arch Phys Med Rehabil Vol 85, October 2004

stiffness but that reflex-mediated stiffness during sustained
voluntary contraction did not differ significantly from normal
subjects. In our study, passive properties were measured under
well-controlled conditions by moving the ankle without acti-
vating the reflex component, which showed significant alter-
ations of passive properties in the spastic hypertonic ankles in
hemiparesis. Furthermore, the alterations were found in both
dorsiflexion and plantarflexion.
Correlations Between Clinical Measurements and Altered
Passive Properties
The MAS is the most widely used method for assessing
muscle spasticity in clinical practice and research. However,
controversial results were reported with regard to the properties
being measured by the MAS. Although it was reported that the
MAS was influenced more by a velocity-dependent response of
spasticity than passive structure,
14,28
a conflicting result has
been reported recently that the MAS measures muscle hyper-
tonia rather than spasticity.
35
In our study, the Pearson corre-
lation coefficients among the 4 parameters were significantly
strong, except for the energy loss, but the correlations (by the
Kendall
) between the MAS and the passive properties were
significant but not as strong as the relationships among the
quantitative parameters when we considered the level of a
strong correlation defined as a Pearson r greater than .512 or a
Kendall
greater than .340 at P less than .01. These findings
indicate that the MAS as a clinical measurement could reflect
the alterations in the passive properties of spastic hypertonic
ankles in part but not as good as quantitative measurements
would. Better ways to quantify passive biomechanic properties
are needed whether they would be simple or sophisticated.
Comparison With Previous Studies
The PROM of hemiplegic ankles in our study, 10.77°
⫾8.69°
at a 10Nm resistance torque, was comparable to the results
reported by Singer et al.
27
The PROM of the control group
(n
⫽18; 19.0°⫾1.9°) of Singer
27
was also similar to our result
(n
⫽32; 20.02°⫾11.67°). The quasistatic stiffness of ankle
plantarflexor measured at 10° of dorsiflexion (.54Nm/deg for
stroke, .35Nm/deg for control) was comparable to the 2 previ-
ous studies, which reported 4.4Nm/10°
25
and .53Nm/deg
27
in
hemiplegic ankles and 3.6Nm/10°
25
and .44Nm/deg
27
in con-
trols. Harlaar et al
25
reported lower stiffness in both hemiplegic
and unaffected contralateral ankles than that reported by Sing-
er
27
or by our study, possibly because they measured the
stiffness in a wider ROM that included neutral ankle position.
On the other hand, little work has been published about the
stiffness or PROM of ankle dorsiflexors in hemiplegic ankle
joints, which was investigated in our study (table 2).
CONCLUSIONS
Spastic hypertonic ankles showed significant alterations of
passive biomechanic properties in dorsiflexors as well as in
plantarflexors, including decreased ROM at controlled torques,
increased resistance at controlled positions, and increased stiff-
ness and energy loss. The biomechanic measures also corre-
lated with the routine clinical measurement of the MAS. With
simplifications and using a portable device, the various mea-
sures in this study can potentially be used to obtain more
comprehensive and quantitative evaluation of spastic hyperto-
nia in a clinical setting.
References
1. Dietz V. Spastic movement disorder. Spinal Cord 2000;38:389-
93.
2. Rymer WZ, Katz RT. Mechanisms of spastic hypertonia. Phys
Med Rehabil State Art Rev 1994;8:441-54.
3. Sinkjaer T, Magnussen I. Passive, intrinsic and reflex-mediated
stiffness in the ankle extensors of hemiparetic patients. Brain
1994;117:355-63.
4. Young RR. Spasticity: a review. Neurology 1994;44(11 Suppl
9):S12-20.
5. Gottlieb GL, Agarwal GC, Penn R. Sinusoidal oscillation of the
ankle as a means of evaluating the spastic patients. J Neurol
Neurosurg Psychiatry 1978;41:32-9.
6. Levin MF, Hui-Chan C. Are H and stretch reflexes in hemiparesis
reproducible and correlated with spasticity? J Neurol 1993;240:
63-71.
7. Meinders M, Price R, Lehmann JF, Questad KA. The ankle reflex
response in the normal and spastic ankle: effect of ankle position.
Arch Phys Med Rehabil 1996;77:487-92.
8. Pierrot-Deseilligny E, Mazieres L. Spinal mechanisms underlying
spasticity. In: Delwaide PJ, Young RR, editors. Clinical neuro-
physiology in spasticity. Amsterdam: Elsevier Science; 1985. p
63-76.
9. Rack PM, Ross HF, Thilmann AF. The ankle stretch reflexes in
normal and spastic subjects. Brain 1984;107:637-54.
10. Thilmann A, Fellows S, Garms E. The mechanism of spastic
muscle hypertonus. Variation in reflex gain over the time course
of spasticity. Brain 1991;114:233-44.
11. Dietz V, Berger W. Normal and impaired regulation of muscle
stiffness in gait: a new hypothesis about muscle hypertonia. Exp
Neurol 1983;79:680-7.
12. Dietz V, Trippel M, Berger W. Reflex activity and muscle tone
during elbow movements in patients with spastic paresis. Ann
Neurol 1991;30:767-79.
Table 2: Comparison With Previous Studies
Parameters
Current Study
Singer et al
27
Harlaar et al
25
Subjects
Controls
Subjects
Controls
Subjects
Controls
Sample
24
32
13
18
8
8
Characteristics
Hemiplegia
Healthy
Brain injury
Healthy
Hemiplegia
Contralateral
PRT at 0° (Nm)
4.53
⫾2.40
3.60
⫾2.54
NA
NA
1.7 (.2–2.7)
1.1 (.6–1.4)
DF PROM (deg)
10.77
⫾8.69
20.02
⫾11.67
10.0
⫾4.7
19.0
⫾1.9
20.3 (13.6–31.8)
25.9 (18.4–28.0)
PF PROM (deg)
36.23
⫾7.63
46.01
⫾9.65
NA
NA
NA
NA
DF stiffness (Nm/deg)*
.54
⫾.19
.35
⫾.20
.53
⫾.36
.44
⫾.21
.44 (.31–.61)
.36 (.32–.47)
PF stiffness (Nm/deg)*
.29
⫾.18
.13
⫾.13
NA
NA
NA
NA
Energy loss (J/deg)
†
.08
⫾.05
.06
⫾.03
NA
NA
NA
NA
NOTE. Values are expressed as mean
⫾ SD or mean (range).
Abbreviations: NA, not available; PRT, passive resistance torque.
*DF or PF stiffness is stiffness measured in dorsiflexion or plantarflexion passive movement. The methods used to measure the stiffness
differed slightly among the articles.
†
Normalized total energy loss.
1645
BIOMECHANIC CHANGES IN SPASTIC ANKLES, Chung
Arch Phys Med Rehabil Vol 85, October 2004

13. Lee WA, Boughton A, Rymer WZ. Absence of stretch reflex gain
enhancement in voluntarily activated spastic muscle. Exp Neurol
1987;98:317-35.
14. O’Dwyer NJ, Ada L. Reflex hyperexcitability and muscle con-
tracture in relation to spastic hypertonia. Curr Opin Neurol 1996;
9:451-5.
15. O’Dwyer NJ, Ada L, Neilson PD. Spasticity and muscle contrac-
ture following stroke. Brain 1996;119:1737-49.
16. Sinkjaer T, Andersen JB, Nielsen JF. Impaired stretch reflex and
joint torque modulation during spastic gait in multiple sclerosis
patients. J Neurol 1996;243:566-74.
17. Sinkjaer T, Toft E, Larsen K, Andreassen S, Hansen H. Non-reflex
and reflex mediated ankle joint stiffness in multiple sclerosis
patients with spacidity. Muscle Nerve 1993;16:69-76.
18. Young RR. Hypertonia: diagnosis and management. In: Lazar RB,
editor. Principles of neurologic rehabilitation. McGraw-Hill: New
York; 1998. p 329-36.
19. Dietz V, Quintern J, Berger W. Electrophysiological studies of
gait in spasticity and rigidity. Evidence that altered mechanical
properties of muscle contribute to hypertonia. Brain 1981;104:
431-49.
20. Berger W, Horstmann G, Dietz V. Tension development and
muscle activation in the leg during gait in spastic hemiparesis:
independence of muscle hypertonia and exaggerated stretch re-
flexes. J Neurol Neurosurg Psychiatry 1984;47:1029-33.
21. Ada L, Vattanasilp W, O’Dwyer NJ, Crosbie J. Does spasticity
contribute to walking dysfunction after stroke? J Neurol Neuro-
surg Psychiatry 1998;64:628-35.
22. Lamontagne A, Malouin F, Richards C. Contribution of passive
stiffness to ankle plantarflexor moment during gait after stroke.
Arch Phys Med Rehabil 2000;81:351-8.
23. Siegler S, Moskowitz G, Freedman W. Passive and active com-
ponents of the internal moment developed about the ankle joint
during human ambulation. J Biomech 1984;17:647-52.
24. Tardieu C, Lespargot A, Tabary C, Bret M. Toe-walking in
children with cerebral palsy: contributions of contracture and
excessive contraction of triceps surae muscle. Phys Ther 1989;69:
656-62.
25. Harlaar J, Becher J, Snijders C, Lankhorst G. Passive stiffness
characteristics of ankle plantar flexors in hemiplegia. Clin Bio-
mech (Bristol, Avon) 2000;15:261-70.
26. Vattanasilp W, Ada L, Crosbie J. Contribution of thixotropy,
spasticity, and contracture to ankle stiffness after stroke. J Neurol
Neurosurg Psychiatry 2000;69:34-9.
27. Singer B, Dunne J, Singer K, Allison G. Evaluation of triceps
surae muscle length and resistance to passive lengthening in
patients with acquired brain injury. Clin Biomech (Bristol, Avon)
2002;17:151-61.
28. Bohannon RW, Smith MB. Interrater reliability of a modified
Ashworth scale of muscle spasticity. Phys Ther 1987;67:206-7.
29. Bates B. A guide to physical examination and history taking. 5th
ed. Philadelphia: Lippincott; 1991.
30. Meythaler JM, DeVivo MJ, Hadley M. Prospective study on the
use of bolus intrathecal baclofen for spastic hypotonia due to
acquired brain injury. Arch Phys Med Rehabil 1996;77:461-6.
31. Zhang LQ, Chung SG, Bai Z, et al. Intelligent stretching of ankle
joints with contracture/spasticity. IEEE Trans Neural Syst Rehabil
Eng 2002;10:149-57.
32. Vaughan CL, Davis BL, O’Connor JC. Dynamics of human gait.
2nd ed. Western Cape: Kiboho; 1999.
33. Burstein AH, Wright TM. Fundamentals of orthopaedic biome-
chanics. Baltimore: Williams & Wilkins; 1994.
34. Field AP. Discovering statistics using SPSS for Windows: ad-
vanced techniques for the beginner. London: Sage; 2000.
35. Bakheit AM, Maynard VA, Curnow J, Hudson N, Kodapala S.
The relation between Ashworth scale scores and the excitability of
the alpha motor neurones in patients with post-stroke muscle
spasticity. J Neurol Neurosurg Psychiatry 2003;74:646-8.
Suppliers
a. JR3 Inc, 22 Harter Ave, Woodland, CA 95776.
b. SPSS Inc, 233 S Wacker Dr, 11th Fl, Chicago, IL 60606.
1646
BIOMECHANIC CHANGES IN SPASTIC ANKLES, Chung
Arch Phys Med Rehabil Vol 85, October 2004
Document Outline
- Biomechanic Changes in Passive Properties of Hemiplegic Ankles With Spastic Hypertonia
Wyszukiwarka
Podobne podstrony:
Changes in passive ankle stiffness and its effects on gait function in
Changes in Brain Function of Depressed Subjects During
Changes in the quality of bank credit in Poland 2010
Changes in passive ankle stiffness and its effects on gait function in
Lord of the Flies Character Changes in the Story
Changes in Levels of Phosphorus Metabolites in Temporal Lobes of Drug Naive Schizophrenic Patients
16 Changes in sea surface temperature of the South Baltic Sea (1854 2005)
Hypothesized Mechanisms of Change in Cognitive Therapy for Borderline Personality Disorder
Changes in Negative Affect Following Pain (vs Nonpainful) Stimulation in Individuals With and Withou
Woziwoda, Beata; Kopeć, Dominik Changes in the silver fir forest vegetation 50 years after cessatio
Jażdżewska, Iwona The Warsaw – Lodz Duopolis in the light of the changes in the urban population de
19 Mechanisms of Change in Grammaticization The Role of Frequency
Stages of change in dialectical behaviour therapy for BPD
Influence of different microwave seed roasting processes on the changes in quality and fatty acid co
Barwiński, Marek Changes in the Social, Political and Legal Situation of National and Ethnic Minori
Changes in personality in pre and post dialectical behaviour therapy BPD groups A question of self
więcej podobnych podstron