
Corrosion behaviour of stressed
magnesium alloys
P.L. Bonora
a
, M. Andrei
a,*
, A. Eliezer
b
, E.M. Gutman
b
a
Department of Materials Engineering, Laboratory of Industrial Corrosion Control, University of Trento,
via Messiano 77, I-38050 Trento, Italy
b
Department of Materials Engineering, Ben-Gurion University of the Negev, Beer-Sheva, Israel
Received 3 July 2000; accepted 28 May 2001
Abstract
Potentiodynamic polarisation and impedance measurements are used to examine the cor-
rosion aspects of some Mg-based alloys, which were previously stressed in order to established
the eect of mechanical deformation on surface electrochemical reactions. A ®rst approach
was made for the unstressed alloys. The electrochemical tests were carried out in a sodium
borate buer solution. Ó 2002 Elsevier Science Ltd. All rights reserved.
Keywords: Mechanochemical eect; Magnesium alloys; Potentiodynamic polarisation; Electrochemical
impedance
1. Introduction
The perception of magnesium as a rapidly corroding material has been a major
obstacle to its growth in structural applications despite its other desirable physical
properties. More importantly, the problem of stress corrosion is becoming a major
one today in Mg alloys.
New Mg alloys have been developed in recent years to meet the needs of structural
applications. Many cast alloys were tested for stress corrosion cracking and their
high sensitivity to stress corrosion was demonstrated [1,2]. Some magnesium and
magnesium alloys applications, especially in the transportation industry require
www.elsevier.com/locate/corsci
Corrosion Science 44 (2002) 729±749
*
Corresponding author. Tel.: +39-461-882403; fax: +39-461-881977.
E-mail address: andrei@ing.unitn.it (M. Andrei).
0010-938X/02/$ - see front matter Ó 2002 Elsevier Science Ltd. All rights reserved.
PII: S0010-938X(01)00101-9

good fatigue properties [1]. Corrosion fatigue is the simultaneous action of corrosion
and alternating stress on an alloy, leading to a lower fatigue limit than in the case of
fatigue without any environmental impact.
In general, the aim of every stress corrosion study is to develop a basis for
quantitative prediction and qualitative diagnostic of the incidence of cracking and
failure under impact of environments and stresses. A more realistic way is to separate
stress corrosion with in¯uencing signi®cant phenomena and to study these phe-
nomena with the hope to develop a more general mechanism in future. Such im-
portant phenomena are mechanochemical eects (MCEs) and creep at crack tip [3].
2. Experimental method
In this work, AM50 and AZ91D magnesium alloys were studied. The most
common die casting alloy is AZ91D with 9% Al content. The combination of ¯u-
idity, strength and ductility of an alloy with 9% Al is undeniably one of the reasons
for which AZ91D alloys usage is widespread. Nevertheless, AZ91D has some dis-
advantages for use in a die casting. Firstly, although the material has good short-
term strength at elevated temperatures, the creep resistance is poor. This has been
attributed to the large amount of the presence of low melting eutectic (Mg
17
Al
12
).
Another disadvantage of higher Al content containing alloys is that ductility is usual
sacri®ced to grain strength [4]. But Mg alloys having lower Al content, for example
AM50 (5% Al) were found to be more ductile, especially during impact situation.
However, many structural applications require an appreciable amount of energy
absorption during their operation [3]. Thus, it is essential to study corrosion fatigue
resistance of Mg alloys and to investigate the correlation of corrosion fatigue with
the mechanochemical behaviour of the Mg alloys. The Mg alloys were submitted to
the standard mechanical tests before the electrochemical ones. The behaviour of
both stressed and non-stressed magnesium alloys was investigated by using poten-
tiodynamic polarisation measurements (DC polarisation) and electrochemical im-
pedance spectroscopy (EIS).
All the electrochemical measurements were performed in a tetraborate buer
solution that is a stable solution with a pH (9.7) at which Mg can cover itself with
more or less protective oxide or hydroxide which checks the dissolution reaction
[5]. A very used solution for the corrosion common studies of Mg alloys is
NaCl Mg(OH)
2
with a pH about 10.5. This solution does not have a stable pH
value in the electrode surface and thus, the corrosion conditions are not stable. In
our study the borate solution eliminate this unstable and the undesirable presence of
anions Cl that even in small amounts, usually break down the protective ®lm on
Mg [6,10]. The electrochemical testing was employed to study the main features of
the processes taking place at the alloy/solution interface. The eect of dierent ap-
plied tensile stresses on the Mg-alloy corrosion resistance was studied. The corrosion
resistance of Mg alloys was pointed out by EIS measurements performed during the
free immersion time and under polarisation and the eect of the dierent tensile
stresses was studied. The evolution of the electrode/electrolyte interface at dierent
730
P.L. Bonora et al. / Corrosion Science 44 (2002) 729±749

immersion times was also studied. The corrosion rate has been calculated by the
analysis of the potentiodynamicpolarisation that was carried out by the linear po-
larisation method.
The ¯at specimens of magnesium alloys (AM50 and AZ91D) used for this study
were prepared by the casting procedure (t
cast
660°C and 650°C, respectively).
Chemical composition (wt.%) and mechanical properties are given in Tables 1 and 2.
The electrochemical tests using both DC (potentiodynamic polarisation) and AC
techniques (EIS) were carried out in an aerated 0.05 M sodium tetraborate solution
(pH 9:7). For all measurements a three electrode electrochemical cell was used,
with an Ag/AgCl as reference electrode and a platinum counter electrode. The
working electrode was prepared from the Mg-alloy samples after the application of
the tensile strength. Mg-alloy samples were embedded in an acrylic resin to provide
electrical isolation of the sample surface. The samples were air dried at room tem-
perature.
The potentiodynamiccurves were obtained using a PAR 273 potentiostat, with a
voltage scan rate of 0.2 mV/s. The impedance measurements were carried out using a
Solartron 1250 frequency response analyser coupled with the potentiostat. All the
experiments were controlled by a PC, which was also used for the acquisition,
storage and plotting of data. The scanned frequency ranged from 6 mHz to 100 kHz
and the perturbation amplitude was of 5 mV (it was observed that a variation of the
amplitude did not change the frequency response of the electrode/electrolyte inter-
face). The impedance measurements were performed at open circuit potential (E
OC
)
and also under potentiostaticconditions.
Table 1
Chemical analysis after die casting in wt.%
Mg alloy
Al
Mn
Zn
Si
Cu
Fe
Ni
Be
AM50
5.1
0.57
0
0.013
0.0007
0.0074
0.0006
0.0013
AZ91D
8.4
0.17
0.85
0.01
0.0008
0.0013
0.0007
0.0003
Table 2
Mechanical properties of samples
Mg alloy
TYS
a
(MPa)
UTS (MPa)
Elongation (%)
AM50
Without
Loading
AM50
120.3
125.4
0.30
AM50
129.9
147.6
1.94
AM50
131.2
152.1
2.13
AM50
129.9
151.7
2.26
AM50
135.6
166.0
3.56
AM50
118.7
160.4
4.39
AZ91D
Without
Loading
AZ91D
166.4
174.2
0.29
AZ91D
166.7
180.4
0.45
AZ91D
179.2
193.7
0.71
a
TYS is the tensile yield strength.
P.L. Bonora et al. / Corrosion Science 44 (2002) 729±749
731
All the measurements of this study were taken after stabilisation of the open
circuit potential, i.e. 20 min after immersion of the electrode in the solution. All the
potential values are reported with respect to the reference electrode (E
Ag=AgCl
0:210
V versus ENH).
3. Results and discussion
3.1. Potentiodynamic polarisation measurements
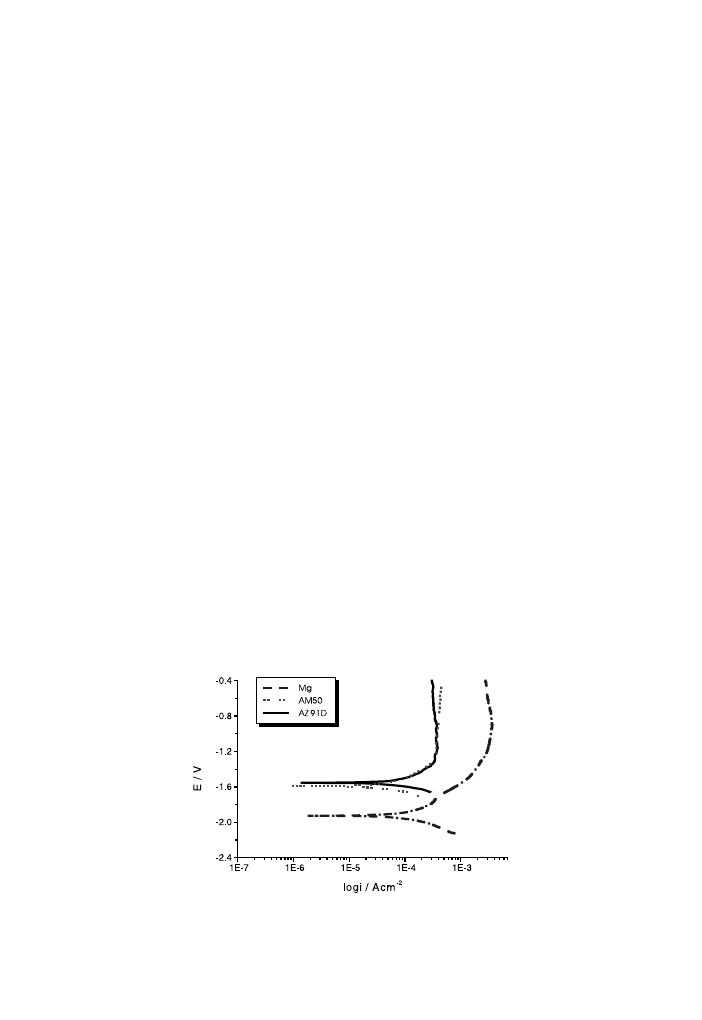
The potentiodynamiccurves in 0.05 M sodium tetraborate solution (pH 9:7) of
unstressed Mg alloys and pure Mg are shown in Fig. 1. As a ®rst remark we note that
the shape of the polarisation curves is almost the same for the two alloys. In addi-
tion, a current plateau begins at 1:2 and 1:3 V for AM50 and AZ91D, respec-
tively, the current values being quite similar and relatively high. We can assume that
the alloy samples present a ``pseudo-passivation'', which diers with respect to pure
magnesium. We also note that by alloying the corrosion potential values become
much nobler and the anodic current densities reduce.
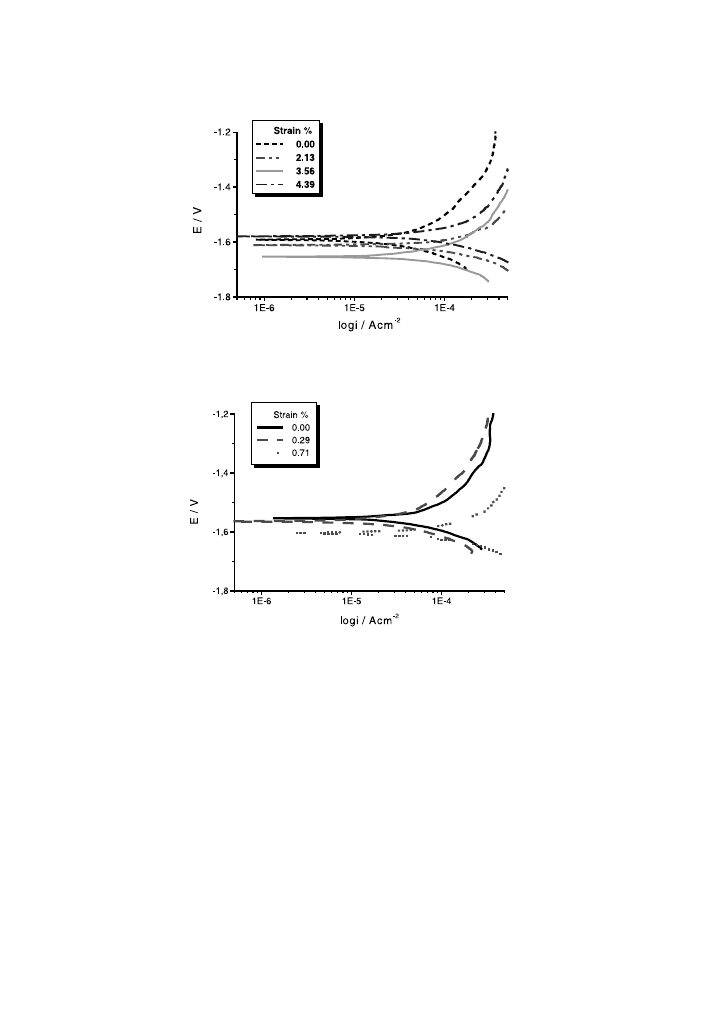
Figs. 2 and 3 show the potentiodynamiccurves obtained for both Mg alloys as a
function of the applied stress. The eect of mechanical deformation on the corrosion
behaviour can be seen. The corrosion parameters estimate the MCE, which means
the increasing of the anodic current densities and the disennobeling of the potential
values caused by the deformation.
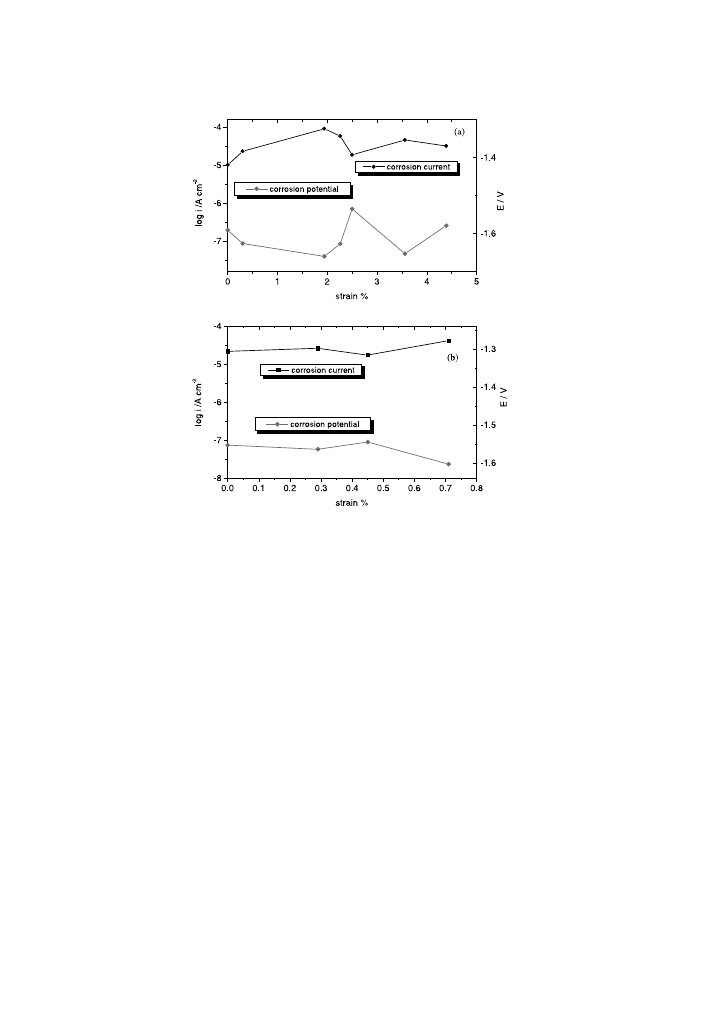
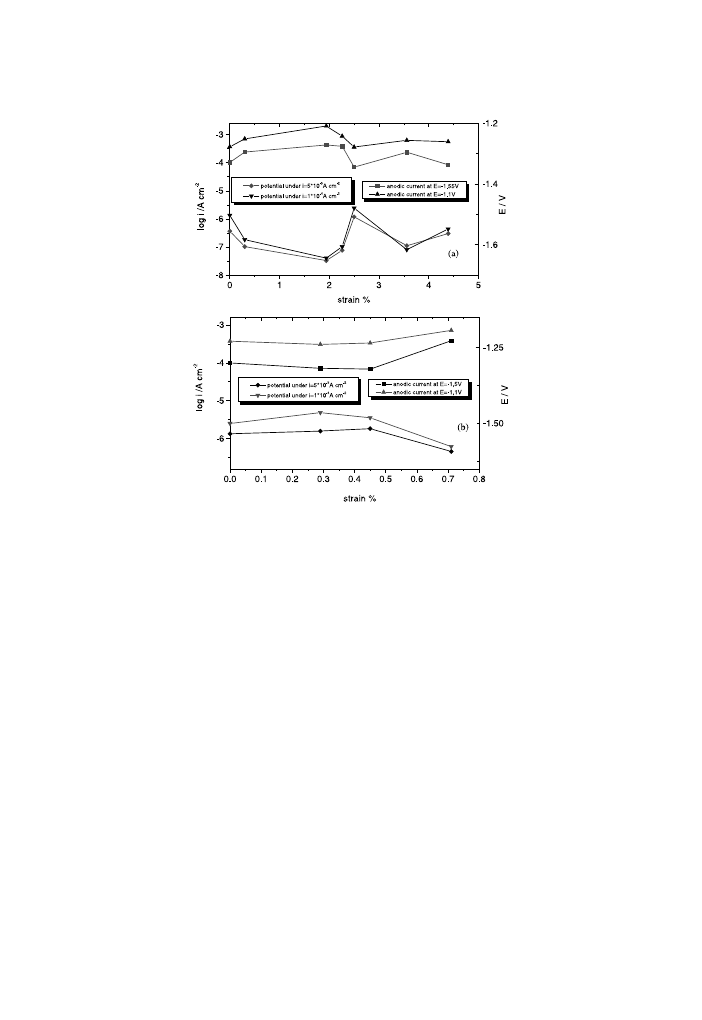
The corrosion rate (i
corr
) was determined for small deviations from the corrosion
potential. The obtained values are plotted as a function of strain in the Fig. 4. The
graphs in Fig. 4 also contain the corrosion potential values. First of all, we remark
that both corrosion current and corrosion potential depend strongly on the applied
stress. So, we can note that i
corr
increases with the elongation up to a value of 1.94%
and 0.29% for AM50 and AZ91D, respectively. After that, the corrosion current is
Fig. 1. Potentiodynamiccurves of pure Mg and of AM50 and AZ91D alloys at v 0:2 mV/s.
732
P.L. Bonora et al. / Corrosion Science 44 (2002) 729±749
reduced. Thus, the corrosion rate passes over a maximum in relation to the increase
in plasticdeformation, according to the general theory [2]. For the same values of the
strain for that a maximum value of the corrosion current was obtained, the corrosion
potential reaches the most negative values. A signi®cant MCE for both corrosion
rate and corrosion potential manifests itself in the magnesium alloys under study. It
can be also seen that a new slower increase of i
corr
is produced at 3.56% and after
0.45% of residual strain for AM50 and AZ91D, respectively.
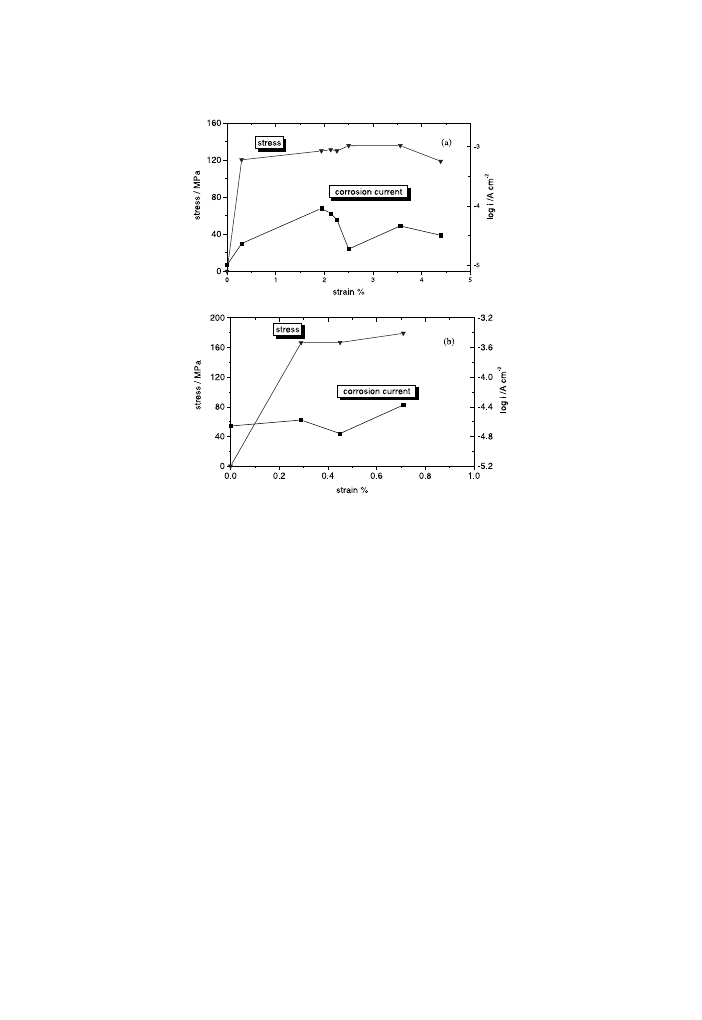
Experimental con®rmation of the correlation between the mechanochemical be-
haviour and the strain hardening stages (intensive strain hardening and dynamic
recovery) could be see in Fig. 5, which regroups the stress±strain curves and the
corrosion rate variations for both magnesium alloys. The observed correlation could
be explained by the change of dislocation substructure during the plastic deforma-
tion as was already done in the case of other materials alloys [7]. Under intense strain
Fig. 2. Potentiodynamiccurves of stressed and unstressed AM50 alloy at v 0:2 mV/s.
Fig. 3. Potentiodynamiccurves of stressed and unstressed AZ91D alloy at v 0:2 mV/s.
P.L. Bonora et al. / Corrosion Science 44 (2002) 729±749
733
hardening, stresses grow and planar dislocation pile-ups appear. This leads to a
sharp increase in the MCE. At the ®nal stage of the dynamic recovery, planar pile-
ups are destroyed due to dislocation cross-slip and partial annihilation. This leads to
a decrease in the MCE value, which, thus, should pass over a maximum in the
process of plastic deformation. The MCE should grow intensively under plastic
deformation at the stage of strain hardening. In particular, the acceleration of metal
anodic dissolution is caused by a local reduction of equilibrium potential in the
vicinity of dislocations. This eect is much lower at the ®nal recovery stage. At this
stage, strain hardening is suppressed because of the development of dislocation
cross-slip processes.
In a previous stress corrosion study [1] a signi®cant mechanoelectrochemical eect
for corrosion rate, anodic current under constant potential and corrosion potential
for the dierent Mg alloys in alkaline media (pH 10:5) was already observed. It
was also noted that for the AM20 and AM50 alloys the mechanical eect show a
maximum when the strain hardening stage transfers to the dynamicrecovery stage.
It is also important that the features of mechanical behaviour are the same in both
active and pseudo-passive states, independently of surface ®lm existence. Thus, the
analysis of the potentiodynamic curves was also carried out at the cross-sections of
Fig. 4. Corrosion current and corrosion potential for AM50 (a) and AZ91D (b) magnesium alloys as a
function of strain.
734
P.L. Bonora et al. / Corrosion Science 44 (2002) 729±749
curves at dierent selected potential levels to ®nd the corresponding current densi-
ties. The potential levels were chosen in both active and ``pseudo-passive'' ranges.
The obtained values are plotted in Fig. 6. For a better illustration of the MCE, Fig. 6
also regroups the potential values under constant current densities. All the values are
plot as a function of strain. Therefore, it can be seen that the anodic current in-
crement and the decrease of potential manifest itself in both active and passive states
in the case of AM50 alloy. For the AZ91D magnesium alloy, a slight decrease in
anodic current and a slow increment of potential are observed in both active and
passive states at the beginning of the applied stress, contrary to the corrosion current
and potential.
The two alloys under study contain the intermetallic compound Mg
17
Al
12
. A low
content of Al leads to a reduced amount of phase Mg
17
Al
12
[4].
It was observed that the b-phase is inert to the chloride solution in comparison to
the magnesium matrix and acts as a corrosion barrier depending on the manner that
the phase Mg
17
Al
12
is distributed in the alloy matrix [8]. So, the b-phase present in the
cast alloy is generally more resistant than the surrounding matrix alloy. Corrosion
resistance of the b-phase is related to its passive behaviour within a much wider pH
range than its pure components.
Fig. 5. Anodic current (under constant potential) in the active state and stress curves as a function of
strain for AM50 (a) and AZ91D (b) magnesium alloys.
P.L. Bonora et al. / Corrosion Science 44 (2002) 729±749
735
Corrosion rate measurements of binary alloys showed that Al was the only ele-
ment which caused a decrease in the corrosion rate of Mg; the corrosion rate de-
creased with increasing Al content [9].
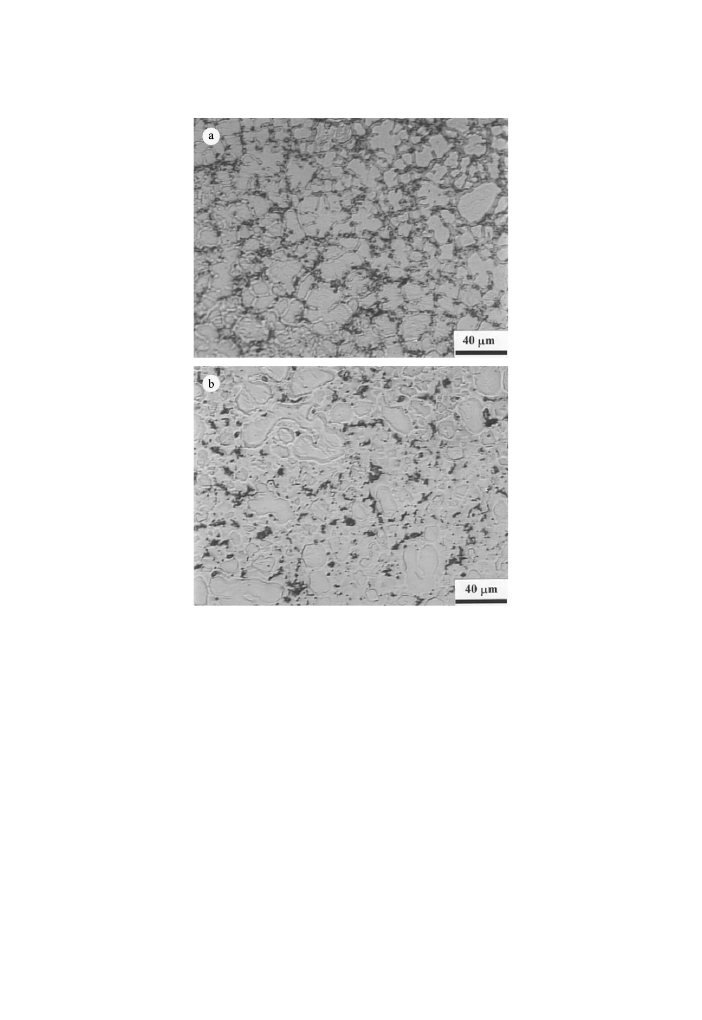
Indeed, in our study realised in a free chloride media it was seen that in the non-
stressed conditions, the corrosion rate of the alloy with higher Al content is lower
than that for the alloy with less Al. This is largely due to the presence and distri-
bution of the b-phase (Fig. 7a) that better protects in the AZ91D alloy with a higher
content of Al and so with an elevated amount of b-phase. For AM50 with low Al
content, the fraction b-phase is small and is only formed as discrete islands in the
structure (Fig. 7b).
But hard secondary phase promotes strain hardening and thus, increases chemical
potential of atoms, i.e. they create the necessary conditions for mechanochemical
dissolution [2]. Consequently it is expected that most resistance to developing MCE
will be obtained for the alloys with highest Al contents. Indeed, deep pitting cor-
rosion occurs and the lifetime of the alloy decreases as the amount of b-phase in-
creases [10].
Our potentiodynamicstudy demonstrated that the AZ91D had high corrosion
rate in deformed state that AM50 under stress. In addition, some recent studies
Fig. 6. Anodic current densities (under constant potential) and potential values (under constant current)
in both active and pseudo-passivation states for AM50 (a) and AZ91D (b) magnesium alloys, as a function
of strain.
736
P.L. Bonora et al. / Corrosion Science 44 (2002) 729±749
proved that the highest sensitivity to corrosion creep and corrosion fatigue [11] in a
corrosive environment is observed in the alloy with highest Al content. It was also
shown that the borate anions act as a corrosion inhibitors at the ®rst stage of creep
[10].
3.2. Electrochemical impedance spectroscopy measurements
A corroding metal is, as a ®rst approximation, modelled as a simple electro-
chemical system consisting of a double-layer capacitance, a solution resistance and a
charge transfer resistance. A system like this can be studied by using an AC signal,
which can provide more information than a DC polarisation. Thus, applying a 5 mV
sinusoidal potential through a potentiostatic circuit, the potential±current response
plots provide the impedance values.
Fig. 7. Typical microstructures of die casting AZ91D (a) and AM50 (b) alloys by optical microscope.
P.L. Bonora et al. / Corrosion Science 44 (2002) 729±749
737
The impedance diagrams are recorded at the initial time (t 0 h) immediately
after the stabilisation of the steady-state potential.
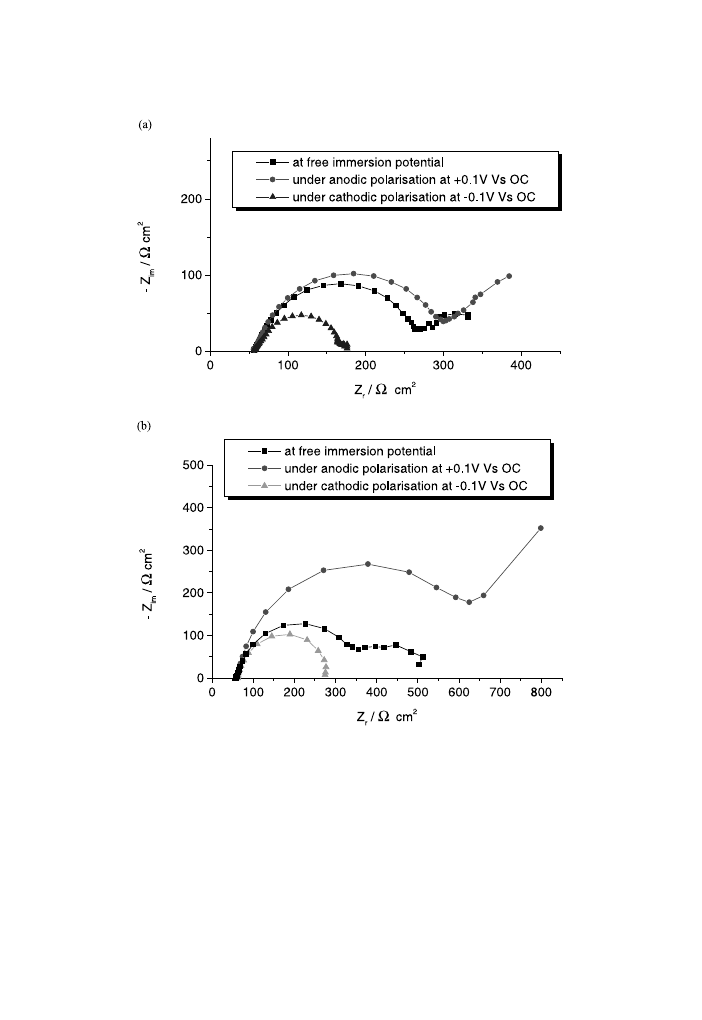
In the present study, EIS measurements were performed at open circuit and also
under polarisation. Thus, the typical Nyquist impedance plots showed in Fig. 8 are
obtained for unstressed Mg alloys in the tetraborate solution at free immersion
potential and under anodicand cathodicpolarisation.
Fig. 8. Nyquist plots at free immersion potential and under anodicand cathodicpolarisation for AM50
(a) and AZ91D (b) magnesium alloys.
738
P.L. Bonora et al. / Corrosion Science 44 (2002) 729±749

The Nyquist plots of both magnesium alloys at open circuit exhibit two capacitive
loops, one for high and intermediate frequencies and the other, the small one, for low
frequencies. The ®rst capacitive loop is attributed at the charge transfer process.
Thus, for the frequencies higher than 1 Hz, a resistor R
p
and a capacitor C
dl
in
parallel can model the electrode/electrolyte interface. A partial data ®tting made with
the Boukamp circuit equivalent software [12] for the charge transfer process pro-
duced the R
p
(polarisation resistance) and C
dl
(double-layer capacitance) values.
The R
p
of the charge transfer process is 207.7 and 374 Xcm
2
for unstressed AM50
and AZ91D alloys, respectively. The obtained capacitance values are 22.6 and
68 lFcm
2
, for AM50 and AZ91D, respectively and they are associated at a double-
layer capacity, C
dl
, (50 lFcm
2
). The slightly lower value of C
dl
for the AM50 alloy
implies the formation of a thick, protective ®lm on the electrode surface; the much
lower C
dl
values being already reported for other Mg-based alloys [13]. The second
small capacitive loop is generally attributed at the masse transfer in the solid phase
[14], which consists of the oxide/hydroxide layers.
The EIS spectra (Fig. 8) obtained under anodic polarisation inside the potential
range of the MgO formation exhibit one capacitive loop followed by a linear part for
both magnesium alloys. As a ®rst remark we note the increase of the R
p
, which is
signi®cant in the case of AZ91D alloy. The increment of R
p
suggests the layer
growing on the electrode surface. The linear part of the Nyquist diagrams suggests
the diusion process.
The impedance data obtained under anodic polarisation was simulated with the
Boukamp equivalent circuit software. Thus the values of R
p
are 236:8 Xcm
2
for
AM50 and 596:4 Xcm
2
for AZ91D, whereas the C
dl
values are 63.84 and 127.31
lFcm
2
for AM50 and AZ91D, respectively. The equivalent circuit consists of a
resistor (R
p
) in series with a constant phase element (CPE), the two being connected
with a capacitor (C
dl
) in parallel. The CPE can be assumed to be a Warburg diusion
according to the n values close to 0.5. Thus, under anodic polarisation, the corrosion
process is controlled by the mass transfer of the corrosion products through the
oxide layers [15].
The Nyquist plots for both Mg alloys obtained under cathodic polarisation
present one loop capacitive (Fig. 8), which is attributed at water reduction.
The EIS data under polarisation show that both magnesium alloys have quite
similar behaviour in free immersion conditions and under anodic polarisation.
Moreover, for the AZ91D alloy, the charge transfer parameters obtained under
anodic polarisation in the active state indicate that the formation and growth of
corrosion layer products is more signi®cant than in the case of AM50 alloy.
The EIS measurements are further performed at the free immersion potential.
For the stressed alloys, the Nyquist diagrams (Fig. 9) obtained at the potential of
open circuit present a capacitive loop at high and intermediate frequencies as in the
case of unstressed magnesium alloys. In addition, at low frequencies a small ca-
pacitive loop was always observed for all the samples, this loop being more or less
reproducible. For a good clarity of the pictures in Fig. 9, the small capacitive loop
was not plotted. The EIS data for the ®rst capacitive loop associated at the transfer
charge process can be ®tted with the Boukamp circuit equivalent as in the case of
P.L. Bonora et al. / Corrosion Science 44 (2002) 729±749
739
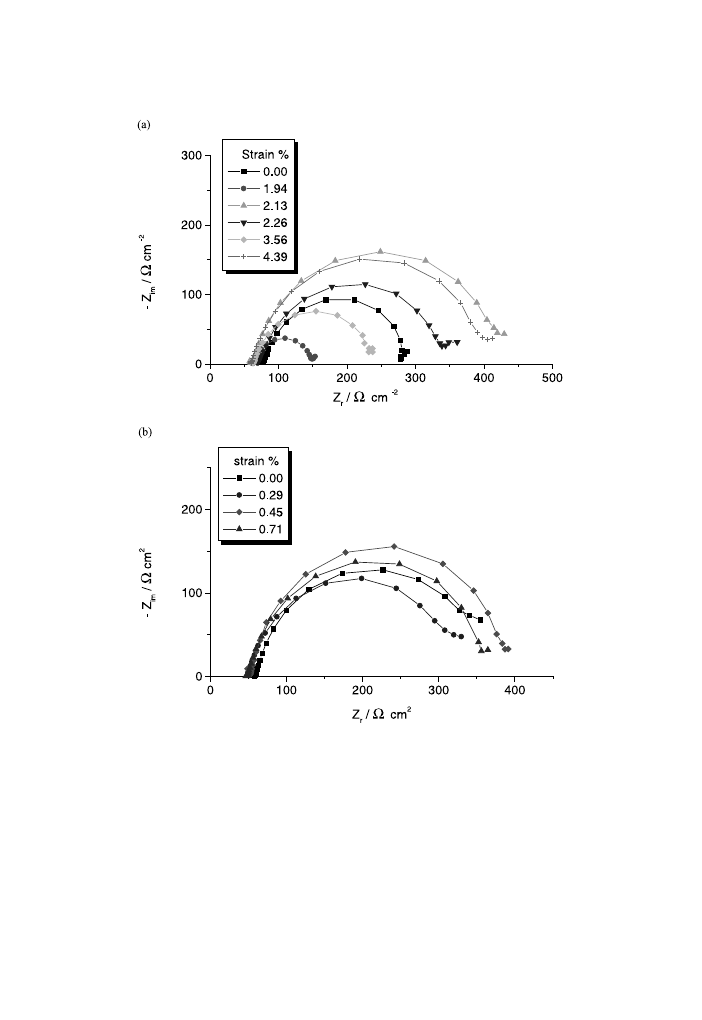
unstressed alloys, the equivalent circuit consisting of a R
p
and a C
dl
in parallel. The
obtained 1=R
p
(which is proportional to the corrosion rate) and C
dl
values are plotted
as a function of strain (Figs. 10 and 11), for both AM50 and AZ91D alloys.
Moreover, Fig. 10 regroups the corrosion current values determined on the poten-
tiodynamic polarisation curves (DC measurements). It can be seen that the maximal
1=R
p
value is obtained for a strain of 1.94% and of 0.29% for AM50 alloy and
Fig. 9. Nyquist plots at free immersion potential for stressed and unstressed AM50 (a) and AZ91D (b)
magnesium alloys.
740
P.L. Bonora et al. / Corrosion Science 44 (2002) 729±749
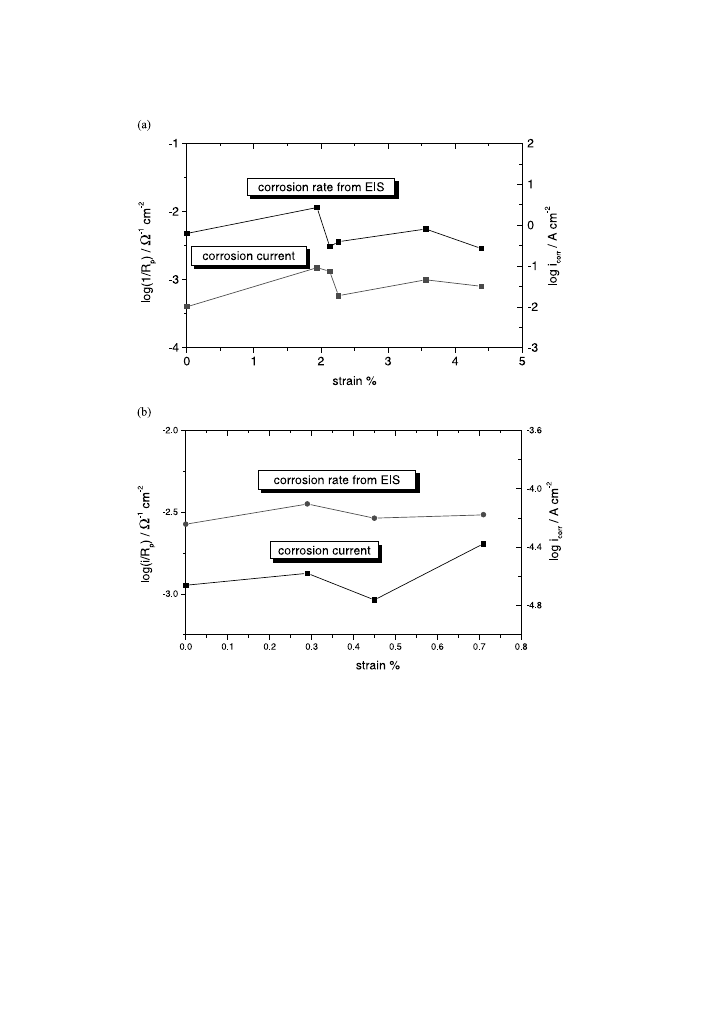
AZ91D, respectively. Thus the 1=R
p
values obtained on the EIS measurements pass
over the maximum as the amount of increase in the plastic deformation, in the same
way as the corrosion current determined on the DC polarisation. Moreover, the C
dl
values plotted as a function of strain (Fig. 11) also pass over a maximum. Fig. 11
also plots the stress±strain curves for both magnesium alloys, in order to emphasise
the correlation between the strain hardening stages and the electrochemical
parameters. The strain values for the maximum of C
dl
are of 1.94% and 0.29% for
AM50 and AZ91D, respectively. The corrosion rate, proportionally with 1=R
p
, and
Fig. 10. Corrosion rate (1=R
p
) from EIS measurements and corrosion current from potentiodynamic
polarisation as a function of strain for AM50 (a) and AZ91D (b) magnesium alloys.
P.L. Bonora et al. / Corrosion Science 44 (2002) 729±749
741
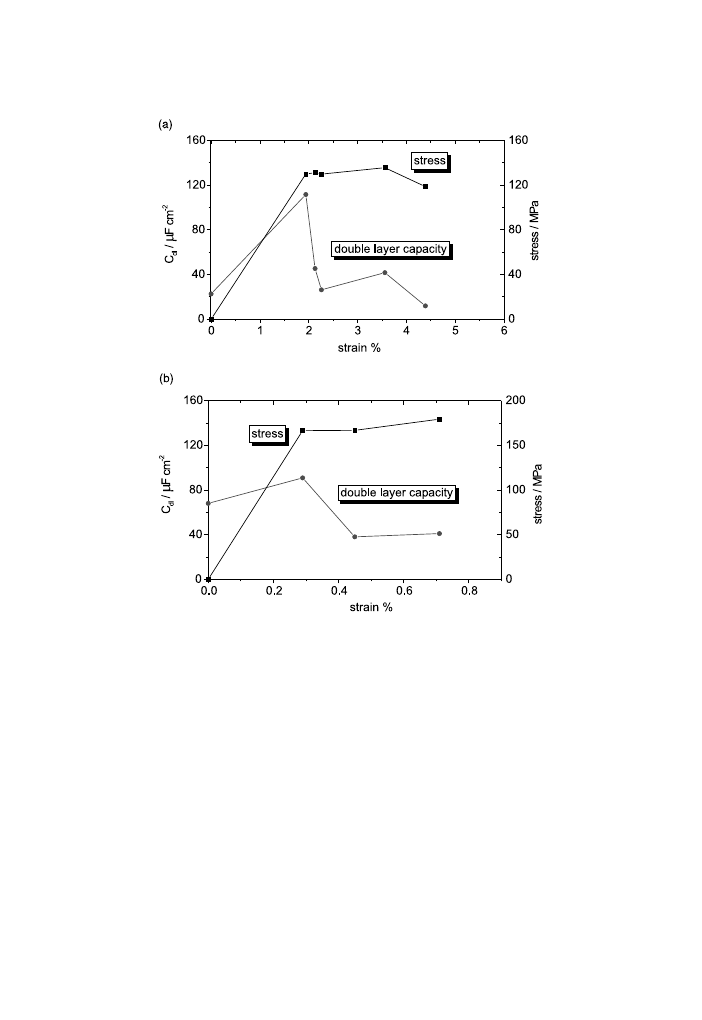
also the C
dl
values manifest a signi®cant MCE. These results show that the EIS
measurement could be a rapid and ecient test to highlight the MCE.
The electrode/electrolyte interface behaviour as a function of immersion time was
also studied. The Nyquist and Bode diagrams obtained at dierent immersion times
are plotted in Figs. 12, 13, 15 and 16 for unstressed alloys and also for dierent levels
of stress for magnesium alloys. For both magnesium alloys (stressed and unstressed),
the capacitive loop attributed to the charge transfer process generally increases with
time, whereas the capacitive tail of the low frequencies does not show a uniform
evolution.
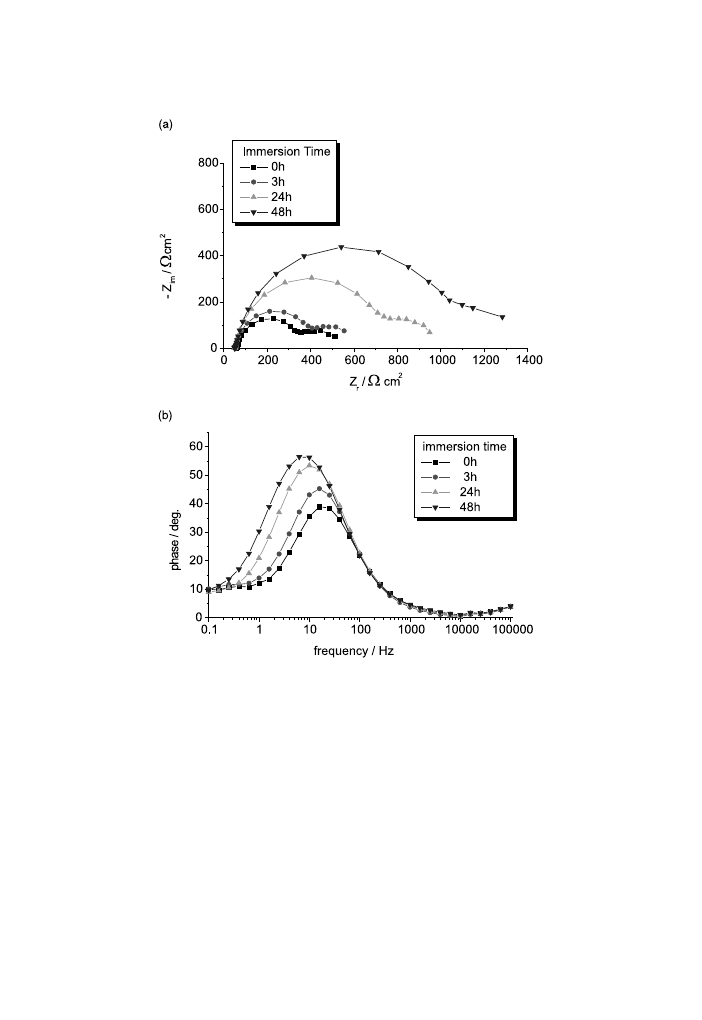
For unstressed AM50 alloy (Fig. 12), for a relatively short immersion time (1 and
3 h), the electrode/electrolyte interface does not undergo important modi®cations.
For a time of over 24 h the polarisation resistance increases and so the surface
protection is increased because of the formation of corrosion products layers. In
Fig. 11. Double-layer capacity from EIS measurements as a function of the strain and the stress±strain
curves for AM50 (a) and AZ91D (b) magnesium alloys.
742
P.L. Bonora et al. / Corrosion Science 44 (2002) 729±749
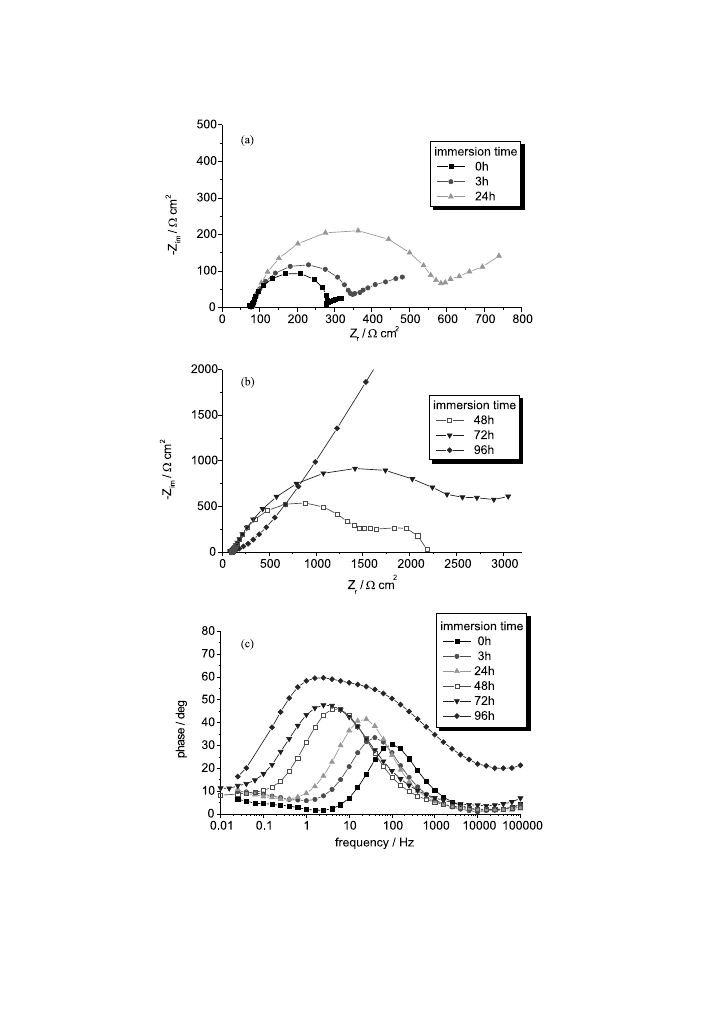
Fig. 12. Nyquist (a,b) and Bode-phase (c) diagrams for the unstressed AM50 alloy at dierent immersion
times.
P.L. Bonora et al. / Corrosion Science 44 (2002) 729±749
743
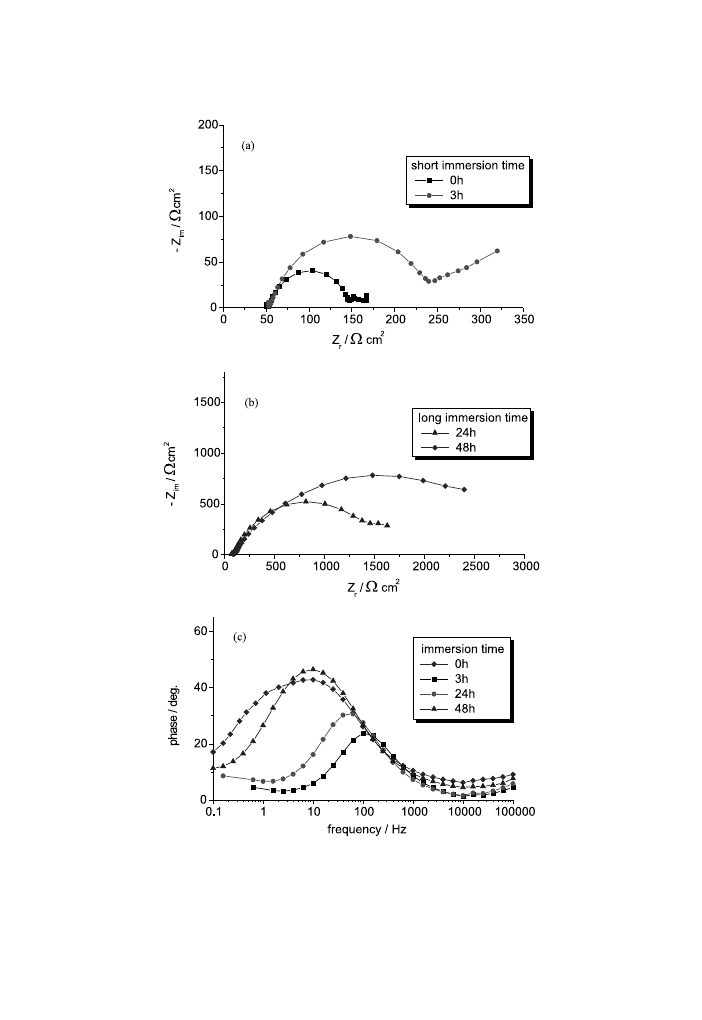
Fig. 13. Nyquist (a,b) and Bode-phase (c) diagrams for the AM50 alloy at strain of 2.26% at dierent
immersion times.
744
P.L. Bonora et al. / Corrosion Science 44 (2002) 729±749
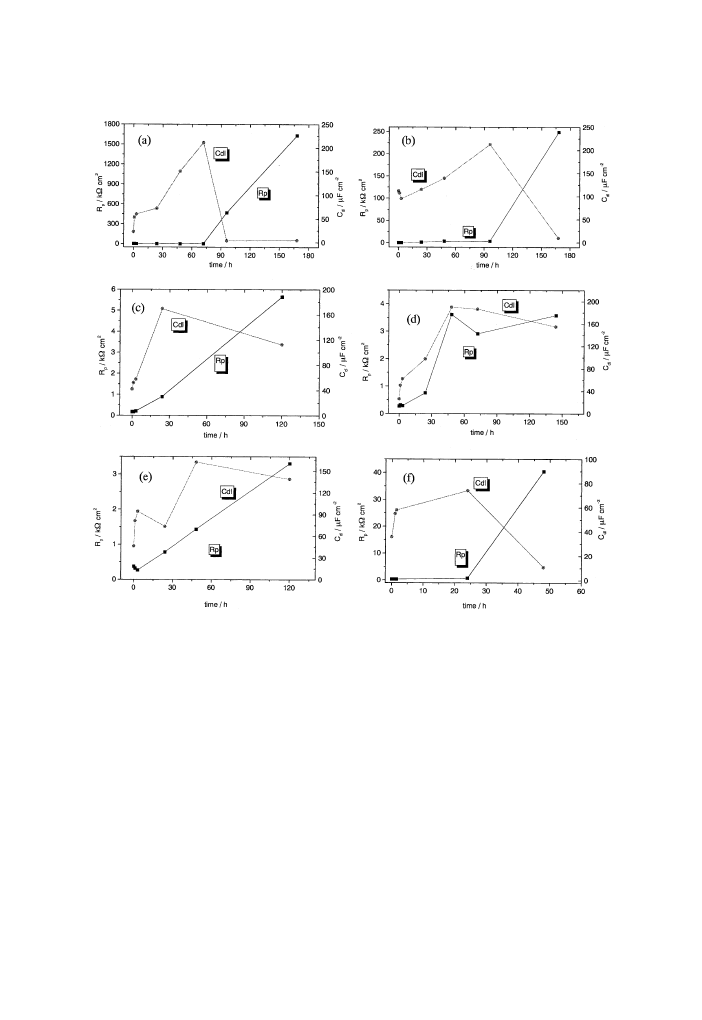
addition, the double-layer capacity increases as can be seen in Fig. 14(a), which plots
the R
p
and C
dl
values obtained with the Boukamp ®tting equivalent circuit. For a
time of under 96 h the corrosion process can be ®tted with only one time constant,
which corresponds at the charge transfer. For t P 96 h the Bode-phase diagram
presents two time constants and the equivalent circuit for the process ®tting changes.
The same behaviour was practically observed for all the stressed AM50-alloy sam-
ples that can be seen, for example, in Fig. 13. This behaviour suggests that after an
immersion time, which diers from a sample to another (but falls between 24 and 96
h), the corrosion mechanism changes; the charge transfer occurs through the cor-
rosion products layers, which can also be suggested by the drastic decrease in the C
dl
values. The equivalent circuit, which ®ts the impedance results, consists of two
parallel RC circuits connected in series. The ®rst equivalent circuit corresponds to
the oxide/hydroxide magnesium ®lm, which becomes quite protective so that the
Fig. 14. Charge transfer resistance (R
p
) and double-layer capacity (C
dl
) as a function of immersion time for
AM50 alloy at strain of (a) 0%; (b) 1.94%; (c) 2.13%; (d) 2.26%; (e) 3.56% and (f) 4.39%.
P.L. Bonora et al. / Corrosion Science 44 (2002) 729±749
745
charge transfer process ®tted with the second equivalent circuit reaches a high
polarisation resistance (Fig. 14).
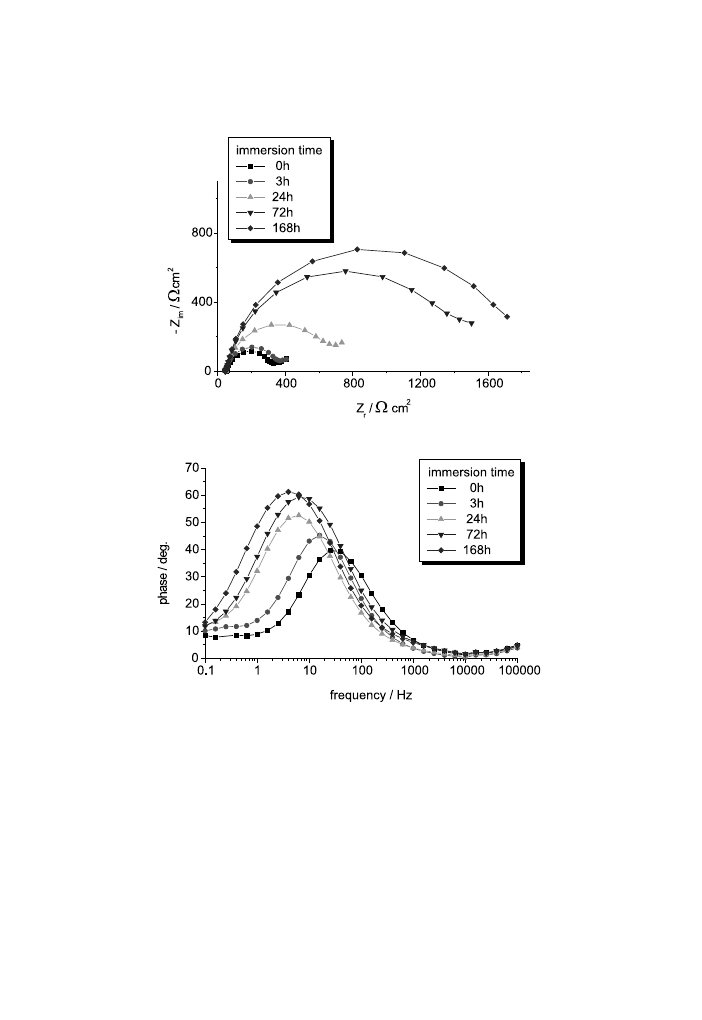
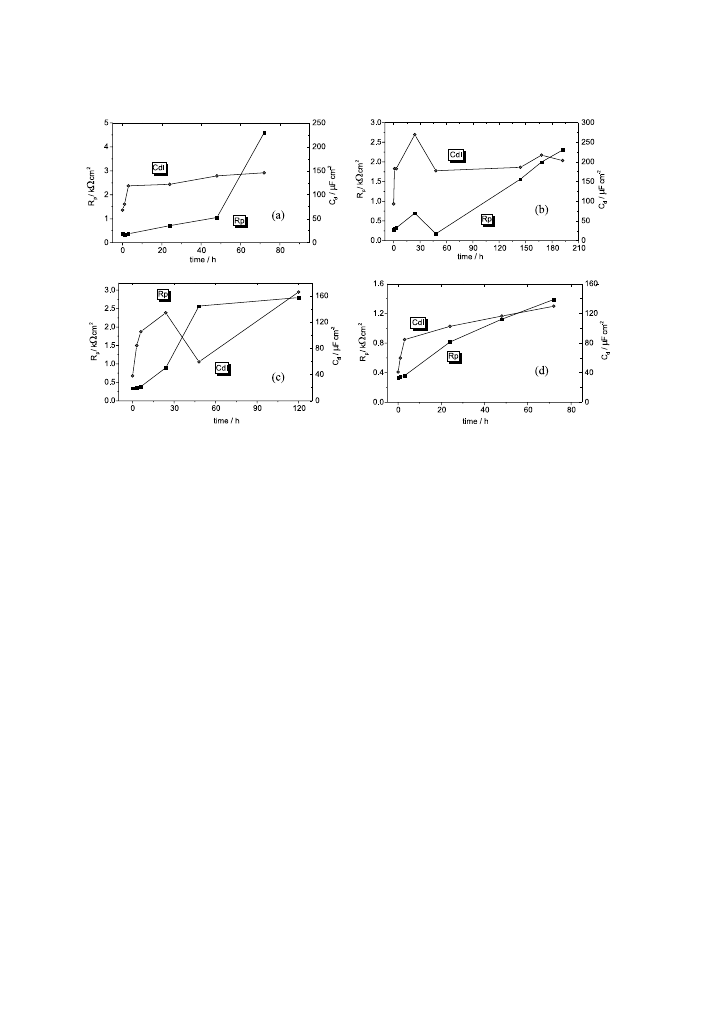
For the AZ91D alloy (Figs. 15 and 16) the evolution of the electrolyte/electrode
interface is not similar. No change of corrosion mechanism is produced even for
longer immersion times. The values of R
p
and C
dl
of the corrosion process obtained
with a Boukamp partial ®tting are plotted in Fig. 17 for the AZ91D-alloy samples
under study. Generally, both corrosion parameters increase with time, which
suggests the formation of corrosion products layers.
A suitable equivalent circuit relevant to the lower frequencies is hardly found due
to the irregular behaviour of the Mg-alloy samples.
Fig. 15. Nyquist (a) and Bode-phase (b) diagrams for unstressed AZ91D alloy at dierent immersion
times.
746
P.L. Bonora et al. / Corrosion Science 44 (2002) 729±749
4. Conclusion
The plastic deformation eects on both potentiodyanmic polarisation curves and
impedance diagrams have been studied in the case of two magnesium-based alloys
(AM50 and AZ91D, respectively).
For both magnesium alloys, it was obtained that the anodiccurrent density de-
termined on the potentiodynamic curves passes over a maximum as a function of the
level of the plasticdeformation (as predicted in the theory). It was also shown that
(a)
(b)
Fig. 16. Nyquist (a) and Bode-phase (b) diagrams for the AZ91D alloy at strain of 0.29% at dierent
immersion times.
P.L. Bonora et al. / Corrosion Science 44 (2002) 729±749
747
the disennobeling of potential manifests itself in both magnesium alloys. The cor-
relation between the mechanochemical behaviour and strain hardening stages (in-
tensive strain hardening and dynamicrecovery) was also related to the known
change of dislocation substructure during the plastic deformation.
It was also shown that the AZ91D had a high corrosion rate in deformed state
that AM50 under stress, while in the non-loading state, the corrosion rate was found
to be higher for the AM50 alloy. This behaviour con®rms the MCE theory and also
the alloys behaviour at creep.
In addition, the inverse of resistance polarisation 1=R
p
and the double-layer
capacitance (C
dl
) determined on the EIS spectra pass also over the maximum as the
amount of increase of the plastic deformation for both Mg alloys. The obtained
results indicate that the EIS measurement could be a suitable and ecient exper-
imental test in order to evidence the MCE.
Thus experimental con®rmation of the correlation between the MCE and the
strain hardening stages by both electrochemical techniques (DC polarisation and
EIS, respectively) was provided. Only DC polarisation was generally used in order to
de®ne the mechanochemical properties of dierent alloys that will be employed
under stress corrosion conditions.
References
[1] A. Eliezer, E.M. Gutman, E. Abramov, E. Aghion, Mater. Sci. Forum 289±292 (1998) 517.
[2] E.M. Gutman, Mechanochemistry of Solid Surfaces, World Scienti®c Publishing, 1994, pp. 1±322.
Fig. 17. Charge transfer resistance (R
p
) and double-layer capacity (C
dl
) as a function of immersion time for
AZ91D alloy at strain of (a) 0%; (b) 0.29%; (c) 0.45% and (d) 0.71%.
748
P.L. Bonora et al. / Corrosion Science 44 (2002) 729±749

[3] A. Eliezer, E.M. Gutman, E. Abramov, Ya. Unigosky, G. Agiv, E. Aghion, in: E. Aghion, D. Eliezer
(Eds.), Magnesium 2000, Proceedings of the Second Israeli International Conference on Magnesium
Science and Technology, 2000, p. 356.
[4] C.F. Baker, New alloys and Shot Delivery System Developments, in: B.L. Mordike, F. Hehmann
(Eds.), Magnesium Alloys and their Applications, Informationsgesellschaft, 1992, pp. 77±87.
[5] M. Pourbaix, Atlas of Electrochemical Equilibria in Aqueous Solutions, Cebelcor, Brussesls, 1974,
p. 141.
[6] Metal Handbook, ninth ed., vol. 13, ASM, Metal Parks, Ohio, 1979, p. 742.
[7] E.M. Gutman, G. Solovio, D. Eliezer, Corros. Sci. 38 (7) (1996) 1141.
[8] O. Lunder, J.E. Lein, T.Kr. Aune, K. Nisancioglu, Corrosion 45 (1989) 741.
[9] G.L. Makar, J. Kruger, J. Electrochem. Soc. 137 (2) (1990) 414.
[10] E.M. Gutman, A. Eliezer, Ya. Unigovski, E. Abramov, Mechanoelectrochemical behavior and creep
corrosion of magnesium alloys, Material Science Engineering A, vol. A302, 2001, p. 63.
[11] A. Eliezer, E.M. Gutman, E. Abramov, Y. Unigovski, E. Aghion, Corrosion fatigue and corrosion
creep of magnesium alloys, Proceedings of the International Congress: Magnesium 2000, Magnesium
Alloys and their Applications, 27±28 September, 2000, Munich, Germany, p. 498.
[12] Boukamp, Equivalent Circuit Software, Users Manual, The Netherlands University of Twente, 1988,
pp. 6±26.
[13] R. Udhayan, D.P. Prokash Bhatt, J. Power Sources 63 (1996) 103.
[14] S. Turgoose, R.A. Cottis, The impedance response of ®lm-covered metals, in: Scully, Silverman,
Kendig (Eds.), Electrochemical Impedance: Analysis and Interpretation, 1993, pp. 173±191.
[15] C.H. (Raymond) Tsai, Analysis of EIS data for common corrosion processes, in: Scully, Silverman,
Kendig (Eds.), Electrochemical Impedance: Analysis and Interpretation, 1993, pp. 37±52.
P.L. Bonora et al. / Corrosion Science 44 (2002) 729±749
749
Wyszukiwarka
Podobne podstrony:
Corrosion behaviour of commercially pure titanium shot blast
The corrosion behaviour of Ti
Burnat, Barbara; Blaszczyk, Tadeusz; Leniart, Andrzej Effects of serum proteins on corrosion behavi
Corrosion behavior of titanium nitride
Corrosion behavior and surface characterization of titanium
Minimum Quantity Lubrication Drilling of Lightweight Aluminum and Magnesium Alloys Used in A
16 197 208 Material Behaviour of Powder Metall Tool Steels in Tensile
36 495 507 Unit Cell Models for Thermomechanical Behaviour of Tool Steels
43 597 609 Comparison of Thermal Fatique Behaviour of Plasma Nitriding
50 707 719 Thermal Fatique and Softening Behaviour of Hot Work Steels
44 611 624 Behaviour of Two New Steels Regarding Dimensional Changes
Electrochemical behavior of exfoliated NiCl2–graphite intercalation compound
DYNAMIC BEHAVIOUR OF THE SOUTH Nieznany
49 687 706 Tempering Effect on Cyclic Behaviour of a Martensitic Tool Steel
Ecology and behaviour of the tarantulas
Fatigue Behavior of Polymers
67 961 977 Investigating Tribochemical Behaviour of Nitrided Die Casting Die Surfaces
Walęcka Matyja, Katarzyna; Kurpiel, Dominika Psychological analisys of stress coping styles and soc
więcej podobnych podstron