
A small introduction to the use of ReportIt
Cacti-ReportIt
v0.6.1

Copyright (c) 2009 Andreas Braun
Permission is granted to copy, distribute and/or modify this document
under the terms of the GNU Free Documentation License, Version 1.2
or any later version published by the Free Software Foundation;
with no Invariant Sections, no Front-Cover Texts, and no Back-Cover Texts.

Dear Cacti Community,
2.5 years ago I wrote my thesis at the University of Applied Sciences, Cologne, and I
never thought that this project would become one of my hobbies.
This exercise concentrates on the steps, which are necessary to set up a report by
solving a typical problem:
“I have to report each month over utilized network links to our customer.
My threshold value is 80%”. How can I solve that issue using ReportIt?
From my point of view it’s a good way to get an overview about ReportIt even though not
all available flags and configuration parameters will be discussed within this script.
Thanks to all those who have spent a lot of time to improve ReportIt! This exercise is
long overdue, so I braced myself up to fulfill your wish for help. I’ll extend it from time to
time with some new topics.
Best regards
-Andreas-

A small introduction to the use of ReportIt
4
Purpose
ReportIt is designed as a plugin for Cacti, the RRDtool-based graphing solution. It
provides the fast creation of customized reports with thousands of data items, self-
defined measurands and variables - particularly with regard to individual working days
and working hours.
Features
•
Definition of individual report templates by using measurands and variables in a
mathematical way
•
Definition of report configurations depending on report templates and with
different data items
•
Individual configuration of working days, working time, time zone and subhead
per data item
•
Scheduled reporting with sliding time frames
•
Rounding with binary or decimal SI-Prefixes
•
Export to CSV and XML
•
Different ways of connecting RRDtool
•
Working in local time supports change to DST and vice versa
•
Auto dispatch of scheduled reports via email
•
Creation of top 10 charts
•
Report history
Installation
The installation of ReportIt is simular to other plugins based on Plugin Architecture 1.x,
so we only have to extract the archive file to Cacti’s plugin folder.
Furthermore it is necessary to activate this plugin by editing one of the following files.
Cacti 0.8.6x: /cacti/include/config.php
Cacti 0.8.7x: /cacti/include/global.php
Near the top of the right configuration file we will find the section where plugins can be
registered:
$plugins
= array();
//$plugins[]
= ‘thold’;
$plugins[]
= ‘settings’;
$plugins[]
= ‘reportit’;
A small introduction to the use of ReportIt
5
User Groups:
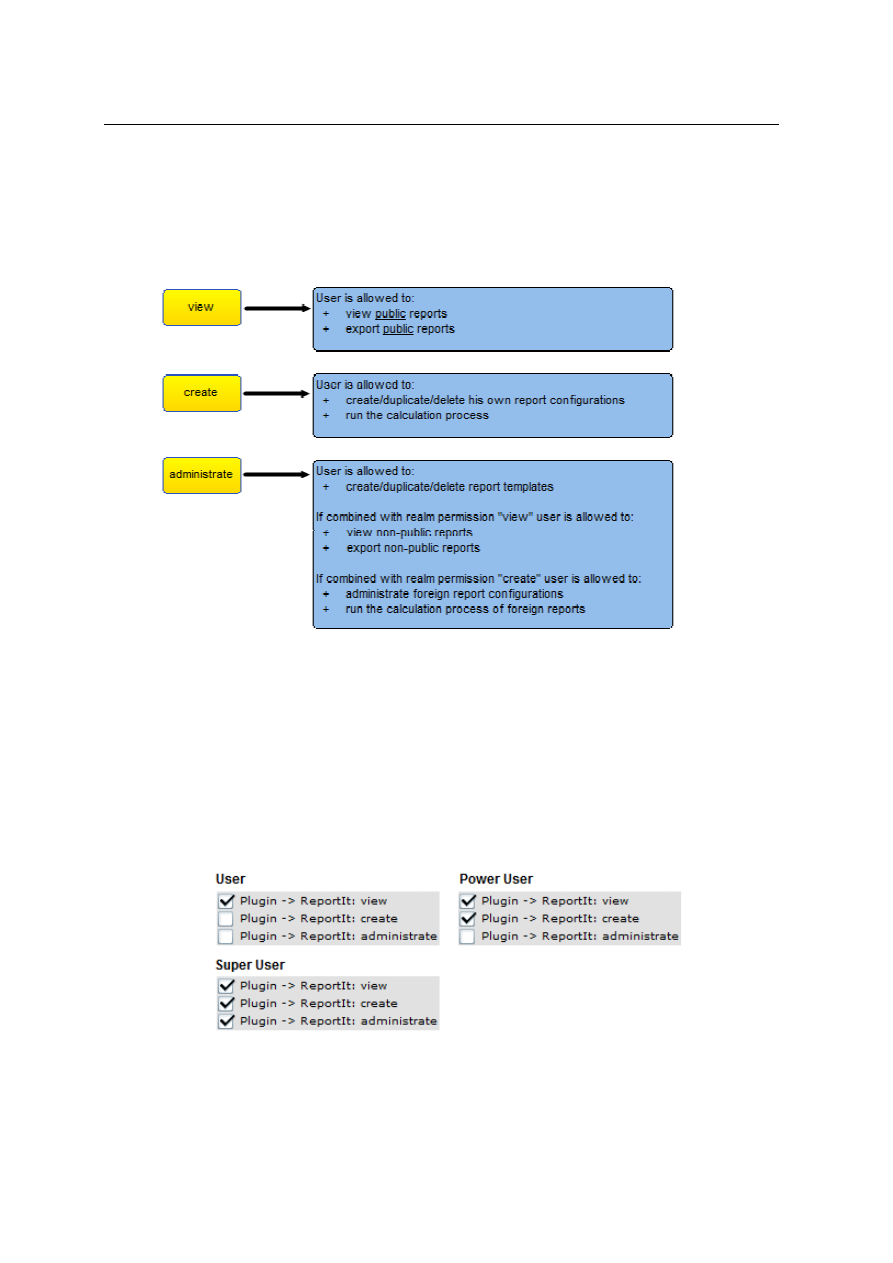
The user rights can be defined by the following realm permissions under Cacti's user
management:
Please note that the realm permissions will be renamed in release 0.7.0:
“Power User Configuration”
becomes “administrate”
“Owner Configuration“
becomes “create“
“View“
becomes „view“
Theoretically this allows creating 7 different types of user accounts. However, for a
typical use of ReportIt (in a multi-user environment) the following combinations are the
most interesting:
Please note that in this case a super user has the right to create report templates, which
requires a sufficient knowledge about the internal structure of RRD files.
A small introduction to the use of ReportIt
6
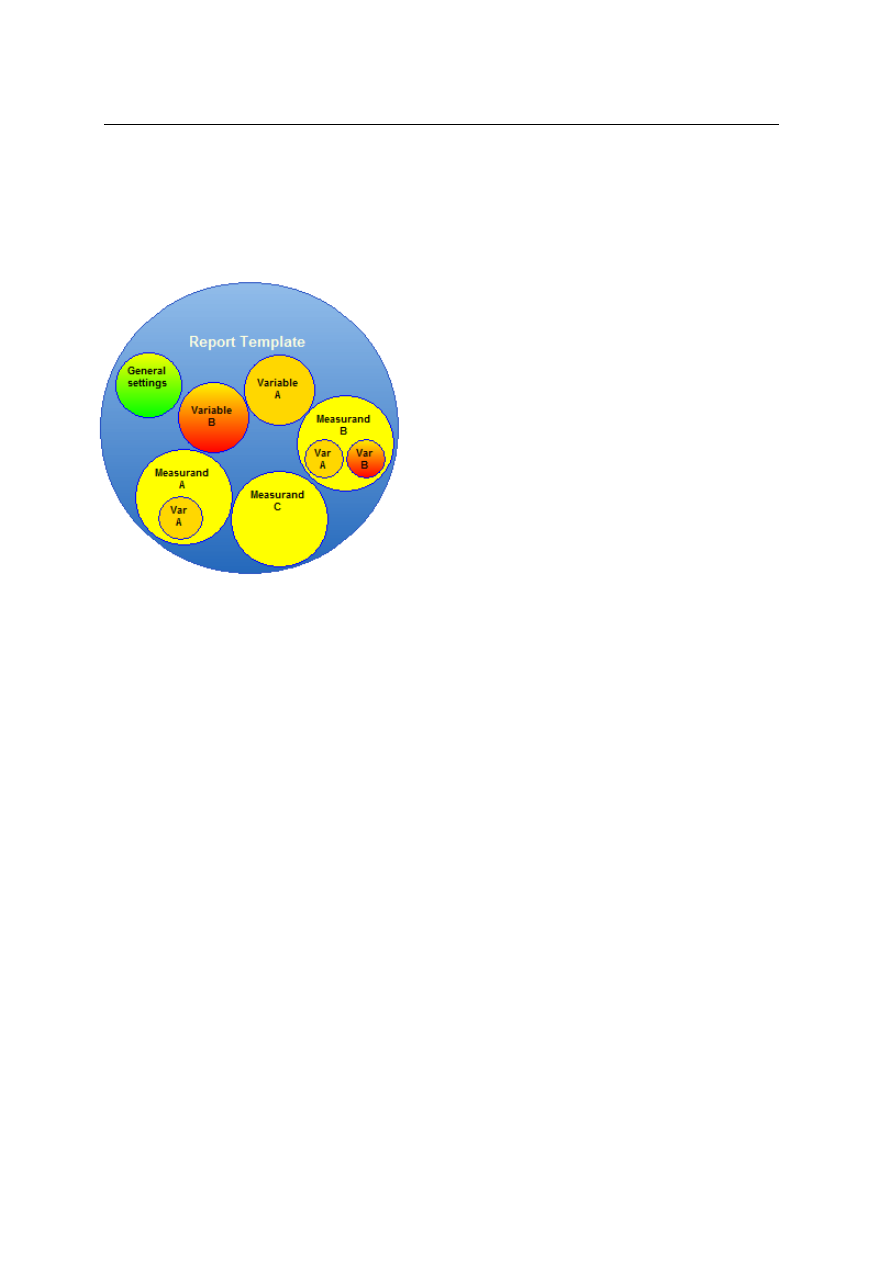
What is a report template?
A report template is the base plate for creating reports. It contains the definition of
measurands, which should be displayed in every derived report. Furthermore it's allowed
to use variables within the definition of a measurand, which have been declared before.
This allows us to create a lot of different
templates for several scenarios like the
analysis of "CPU Utilization", "Interface Traffic"
and so on. Honestly, creating new report
templates is not so easy, because it is
indispensable
to
have
a
fundamental
knowledge
about
RRDtool
and
your
environment as well. That's the point where a
lot of Cacti users begin to struggle and the
reason why it is important to concentrate on
the basics first.
For this very reason it is advisable that a
simple user should not have access to that
section.
What is a report configuration?
A report configuration combines a report template with the right data items (e.g. network
interfaces), which should be part of the report. Therefore a power user has the
permission to select a template, to define the reporting period, to set up variables
(defined within the report template) and to add several data items besides changing a
bunch of additional settings.
ReportIt supports different types of users and makes a distinction between different
ownerships. The creator of a report configuration becomes automatically the owner of it
and is entitled to make it public or not. Additionally it’s possible to set up office hours,
time zones, email recipients and so on.
A small introduction to the use of ReportIt
7
Let’s go! We want to create a report template!
After we have ensured the correctness of our permissions we will find new entries in
Cacti’s console. At first we take a look at the section called “Templates” and we select
“Report Templates”.
Now we have to fill up the empty table with our first report template. A simple click on
“Add” in the right upper corner opens the dialogue box.
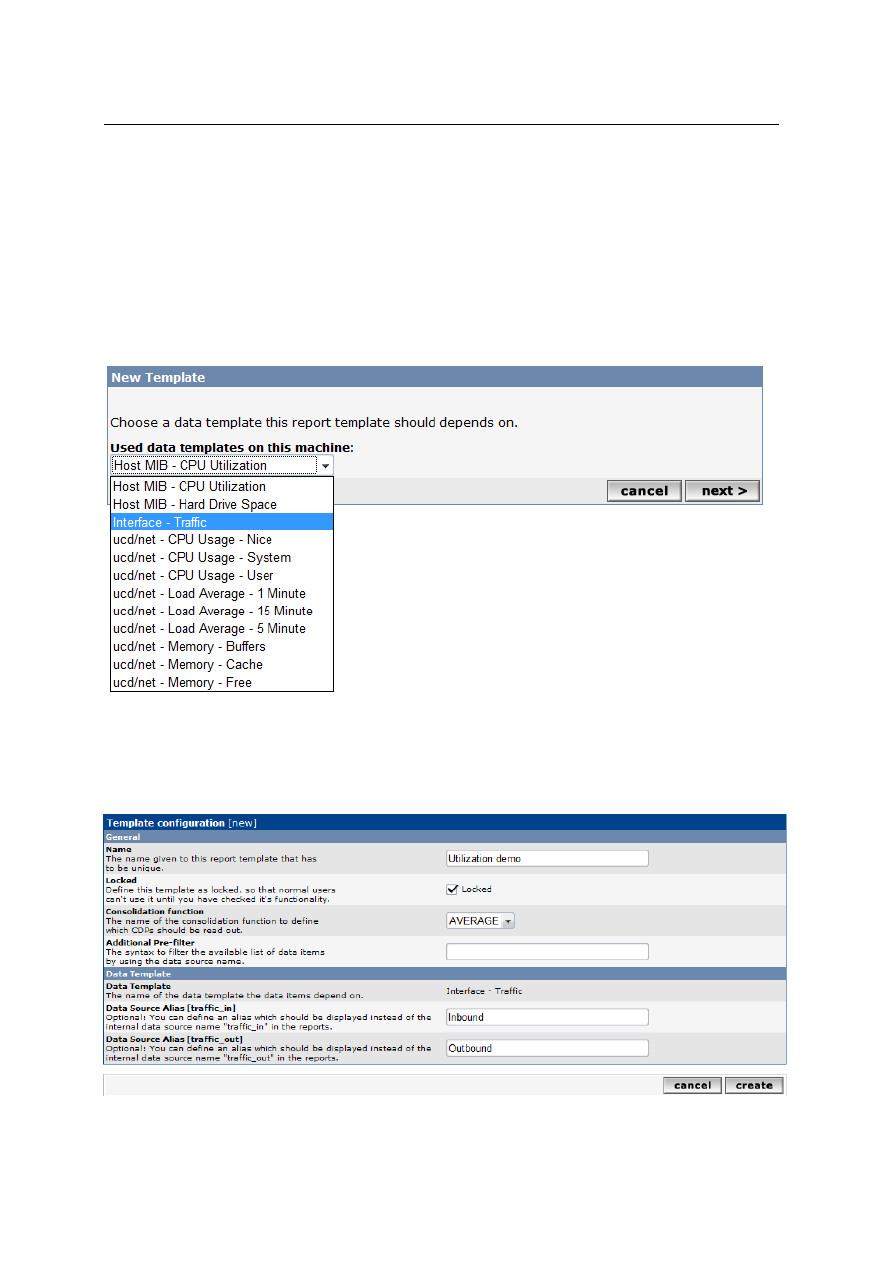
As you can see below ReportIt
offers us a lot of data templates, which are all in use. We choose data template
"Interface Traffic" from the drop down list.
With a short click on “next” we arrive an individual configuration page where we can
name our new template. Until we have not finished the whole template configuration
including a minimum of one new measurands, the template will be automatically locked.
So it will be unusable for power users during that time.
A small introduction to the use of ReportIt
8
As we know RRDtool supports several functions to consolidate measured values.
Excluding ReportIt 0.7.0 it becomes necessary that we choose which CDPs
(Consolidated Data Points) should be readout during the calculation process. (With the
upcoming release this selection will be shifted to the measurand configuration to
increase the flexibility)
Under “Data Template” we see the data template chosen within the last step and the
included data source items. The names of these items will be used automatically within
the report. In certain circumstances it will make sense we define an aliases instead of
using the original name.
After fulfilling the form as shown above and a click on “create”, two new (blue) links will
appear in the right upper corner. We want to create directly a flexible template instead of
using a static threshold value of 80%. So we select "Create a new variable" to create our
first variable.
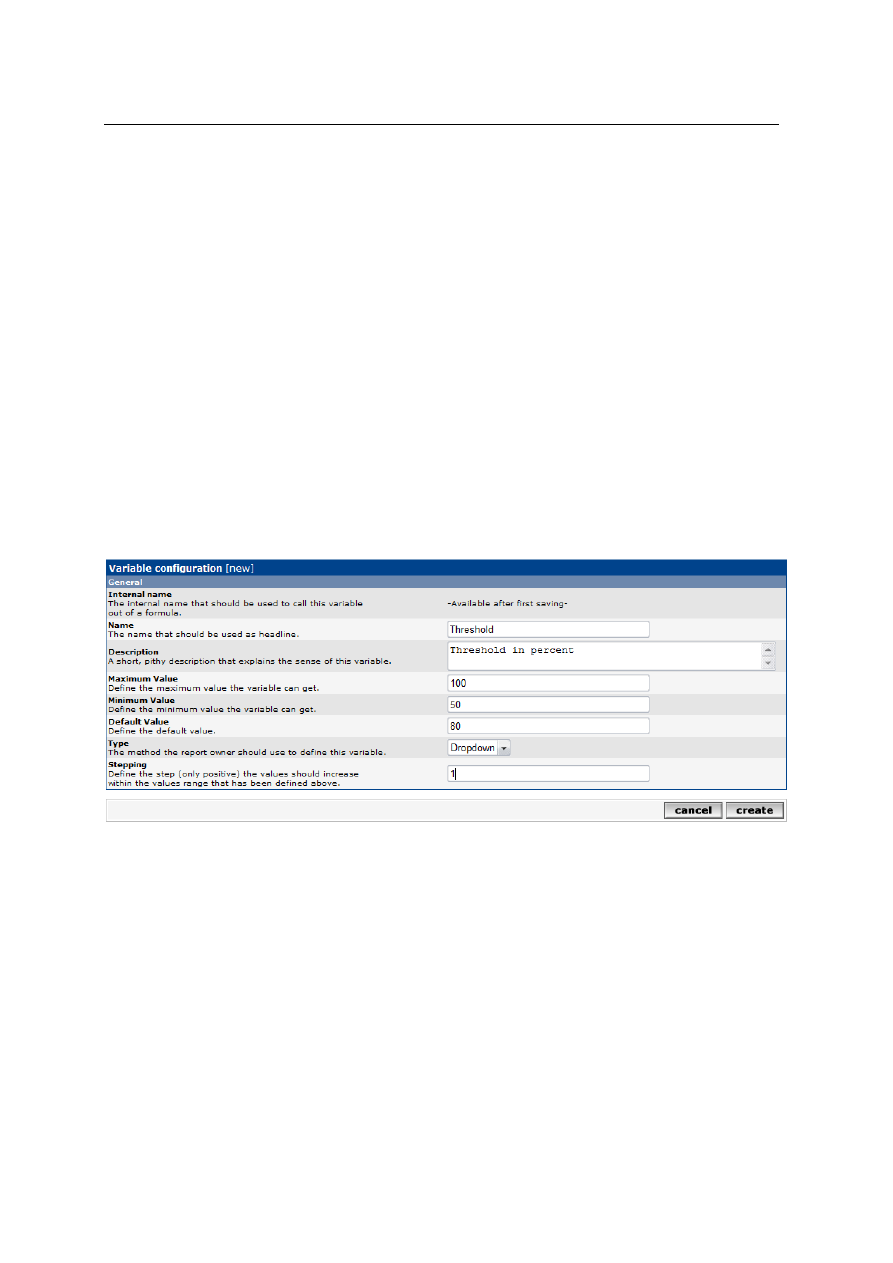
This variable will define the threshold value selectable for all power users (and super
users as well) within their report configurations. Therefore we want to offer them a drop-
down list that shows values from 50 to 100 % with a step size of 1. The description will
explain power users the sense of the variable.
With the successful creation of that variable we can see the list with all defined variables
for our report template. Okay, we have only a single one till now, but we can take a look
at the internal (unique) name given for it (e.g. "c1v"). We will need this information later,
but we do not have to write it down.
☺
By using the yellow link "Utilization demo" shown in the table header we will get back to
the configuration of our template. Let’s create our first measurand that will show us the
bandwidth of every interface. Therefore we select the second link called “Create a new
measurand”.
A measurand will be calculated automatically for every data source defined in Cacti’s
data template. In this exercise it will return two results per data item: one for the inbound
and one for the outbound traffic. So it becomes important to find a good name and a
better unique abbreviation, because that abbreviation will allow us to address these
interim results within the calculation process of subsequent measurands.
ReportIt also provides the possibility of creating auxiliary calculations, which can be
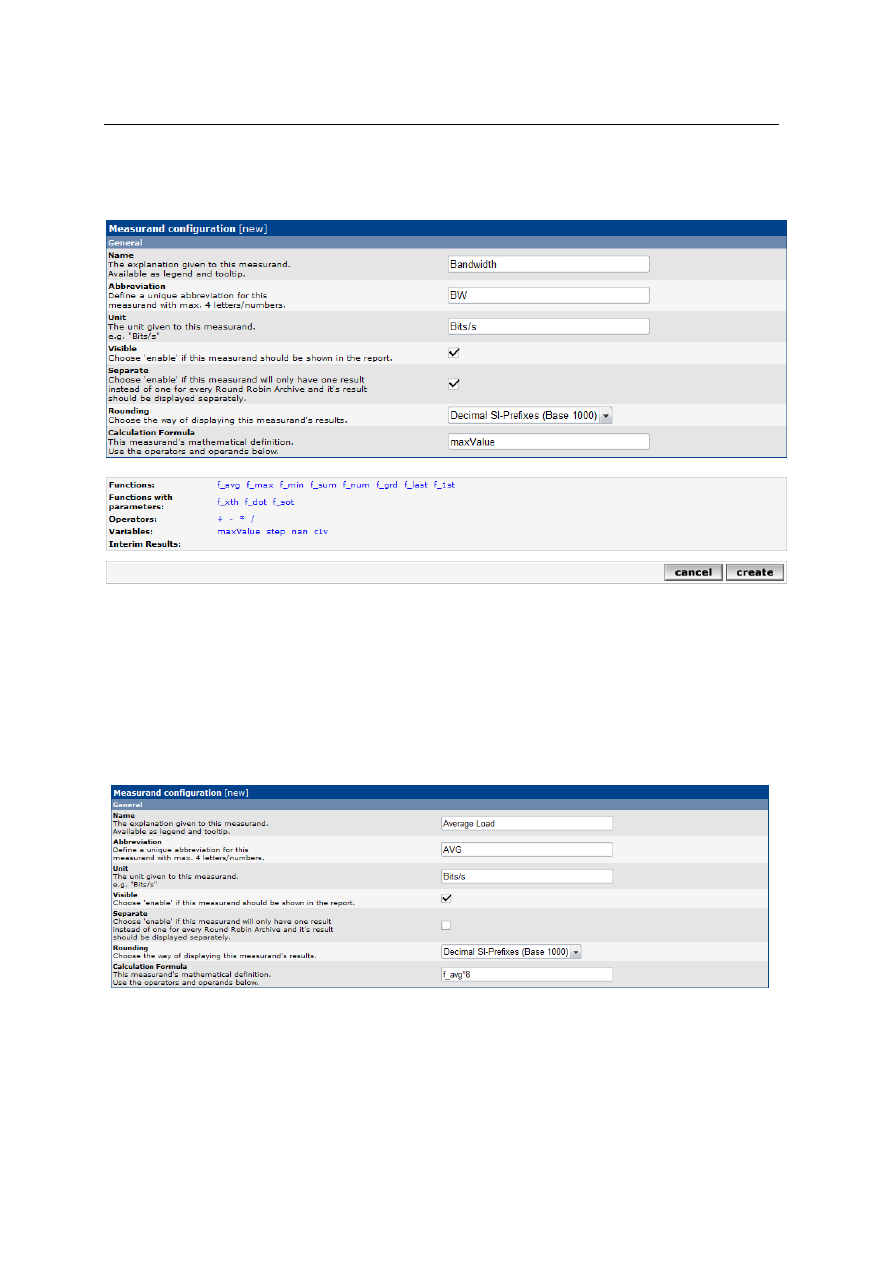
A small introduction to the use of ReportIt
9
hidden within the report through the deactivation of the “visible” flag. If we need only a
single result instead of one for every data source then we have to select “separate”.
The calculation formula describes in a “pseudo” - mathematical way what ReportIt has to
do with the measured values readout of the RRD file. Therefore we are allowed to
combine functions, constants and variables with operators. Don’t be reluctant to improve
the readability of your formula by using round brackets! And moving the pointer over the
different functions will display us more information about it.
☺
Clicking on these items will automatically add them to our calculation formula. After we
fulfilled all fields and clicked on “create” we will see a list of defined measurands for your
report template. The “Add” link allows proceeding with another new measurand.
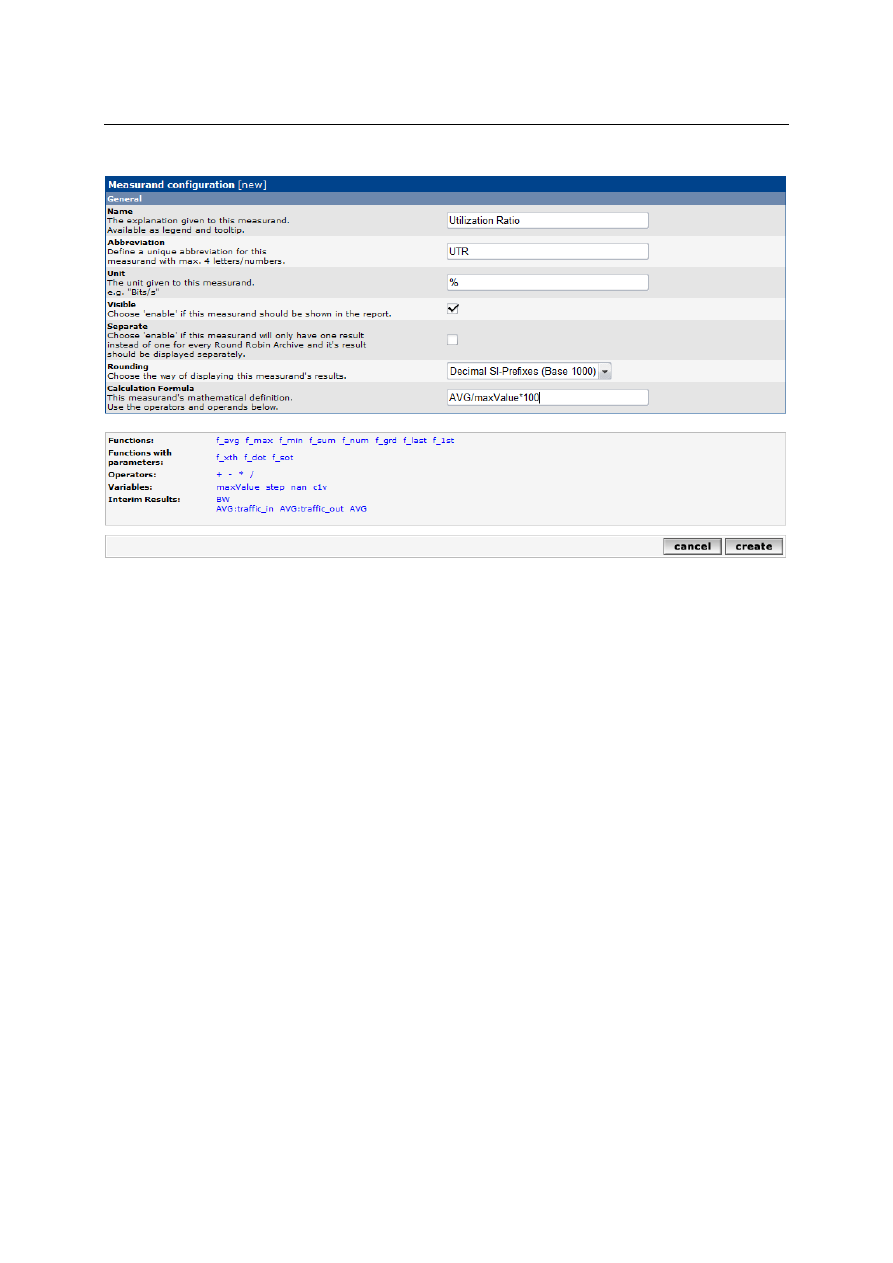
The second measurand should display the average load of every data source, which will
be “traffic _in” (alias Inbound) and “traffic_out” (alias Outbound) in our case:
"f_avg*8" means that ReportIt has to calculate the average of all valid measured values
per data source during a reporting period. As you know routers use to count "Bytes/s",
instead of "Bits/s". So we have to multiply it with 8 being inline with our traffic graphs.
A small introduction to the use of ReportIt
10
Here comes the third measurand that should display the "Utilization Ratio. Take a look
at the bottom of the screenshot. Did you recognize the variable we have defined at the
beginning? We will use it soon, but we have to concentrate on the interim results first.
☺
This plugin permits us to bring back into use, what have been calculated before: Using
the abbreviation of another measurand within the calculation formula instructs ReportIt
to fill in automatically the corresponding result per data source. If the calculation of that
older measurand will only return a single result (We remember the separate flag!), then
this one will be filled in. Furthermore it can be very helpful to address directly these
results returned per data source. For example we can calculate the sum of the averaged
inbound and outbound traffic with a simple “AVG:traffic_in+AVG:traffic_out”.
Last but not least we should get back to the sense of that measurand.
This measurand will return separately the averaged utilization ratio of inbound and
outbound, which we have during the reporting period.
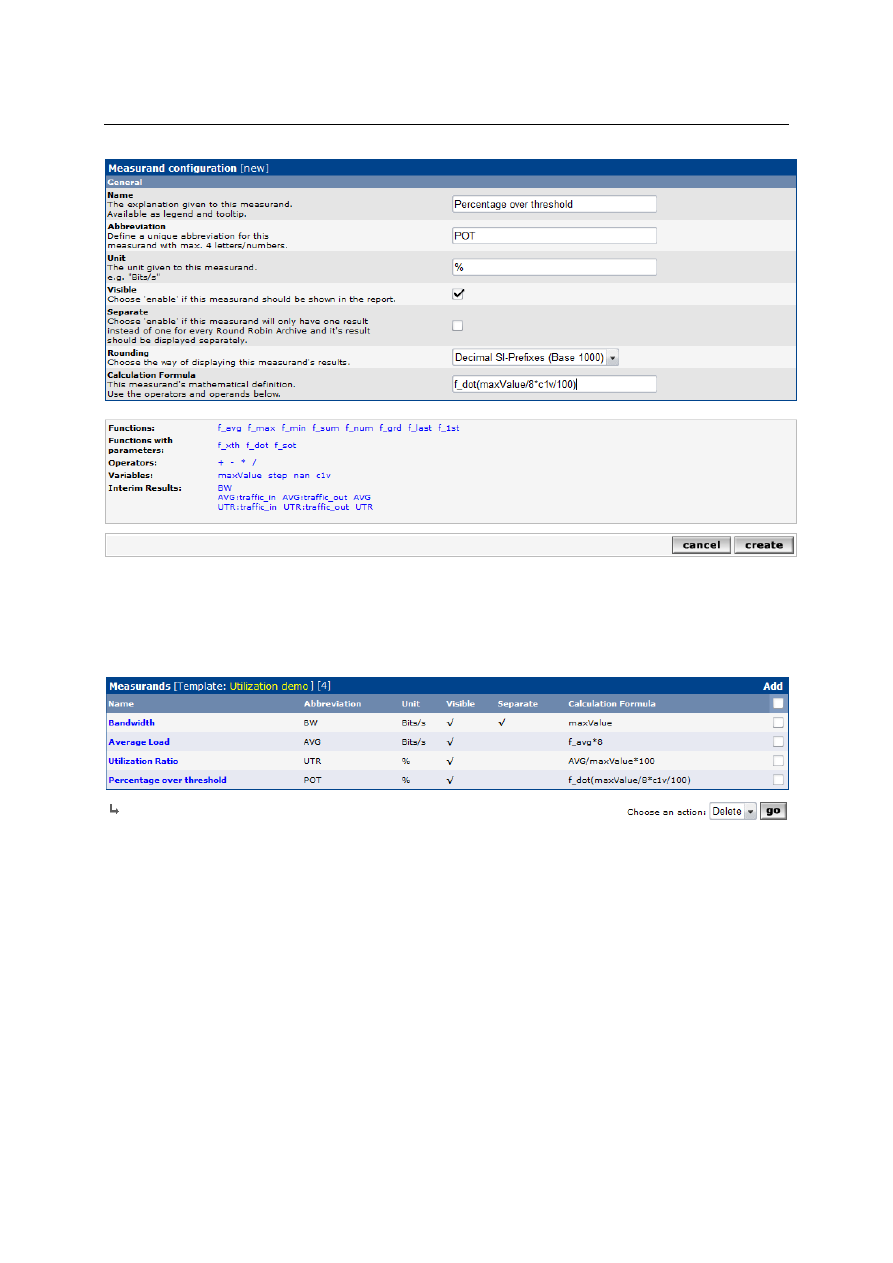
Okay, let's create our last and most important measurand "Percentage over threshold"
or “POT” for short. So, what does this mean? It will reveal how many percent of our
business time was the threshold for inbound and outbound exceeded during the
reporting period. That sounds complicated.
ReportIt supports working hours within a report configuration. The default is always set
to 24 hours, but e.g. we use to work for 8 hours. So if we created a report over the last
month with a “POT” of 60%, then we would know that 60% of our working hours the
interface utilization was over the threshold we’ve defined (e.g. 90% of max bandwidth).
With 8 working hours, the guys of our district office could not work properly for around
4,8 hours per business day. In that case we should ask the upper management for
money to increase the bandwidth of our WAN link or we have to find the guy who tries to
backup the Internet.
A small introduction to the use of ReportIt
11
As you see above there's our variable used within the calculation formula and with a
click on “create” we will get back to the overview of our measurands. Click once again
on the yellow link and disable the checkbox "locked" within the template configuration.
Cool! Now we finished the most difficult part!
Come on! Let's set up a new report configuration:
At first we select “Report Configuration” under Cacti’s Console to get an overview of all
defined report configuration. The table is empty so we click on “Add” to fill it up now.
Within the next dialogue box we are requested to select the report template we would
like to use. We choose the report template "Utilization demo" from the drop down list and
go on with “next”.
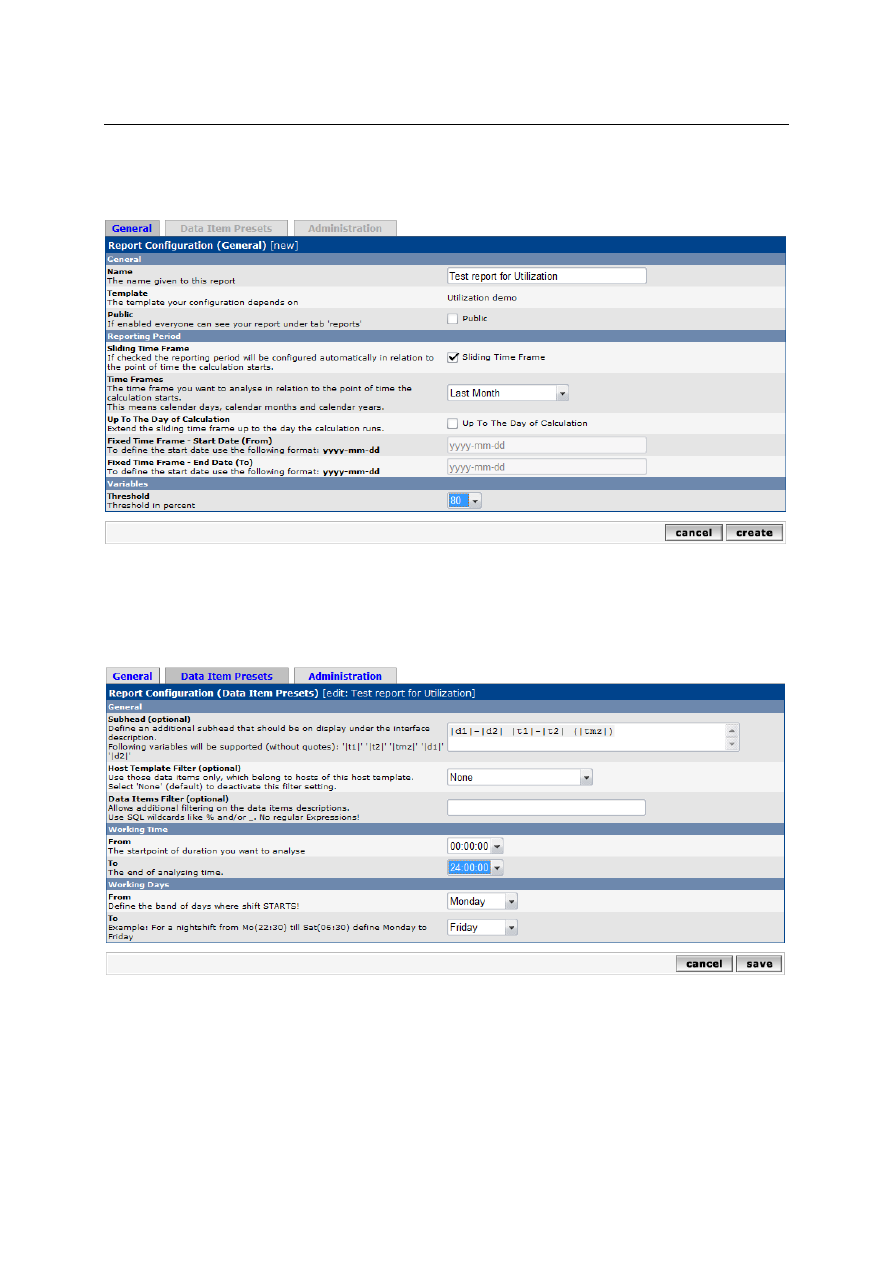
After we typed in a name, we have to decide if our report should be public or restricted.
The reporting period can be divided into two different types: Using a sliding time frame
means that ReportIt automatically calculates the start and the end date in relation to the
predefined time frame selected by us. This is very useful if you want to schedule the
report. The second type allows us to define a static time frame.
A small introduction to the use of ReportIt
12
The threshold variable enters the stage at the end and she’s pre-configured to 80% as
requested.
After saving our settings for the first time the other tabs will be activated automatically.
Now we choose the second tab called "Data Item Presets" to define presets, which will
be used to pre-configure automatically new data items (here we've network interfaces)
for this report.
Maybe we are not interested in the data traffic over a weekend, because a district office
will be opened only on weekdays. If there are no backup jobs running at night it might
make sense to reduce our working time. Using the whole day instead will distort the
results in that case, because the threshold value cannot be exceeded at night under
these circumstances. We should keep this in mind!
A small introduction to the use of ReportIt
13
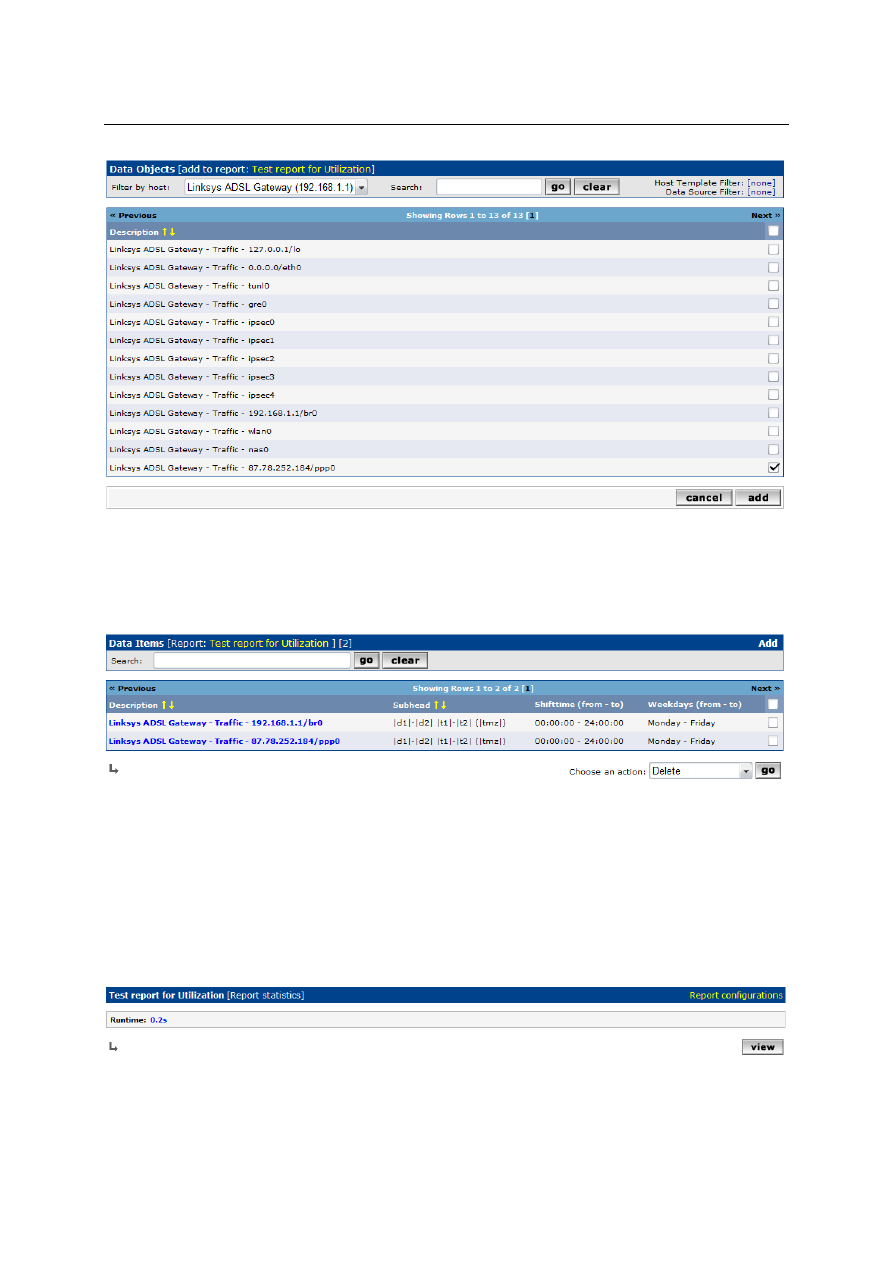
Additional information of a data item can be display within the subhead. Now we have to
add some data items: With a click on "Add data items" in the right upper corner we will
get an overview of the network interfaces. All of them are matching the data template
used within our report template.
Having all interesting interfaces added we can get a list of all selected data items with a
short click on “cancel”. To edit the working days and working time individually we can
select the name of the interface.
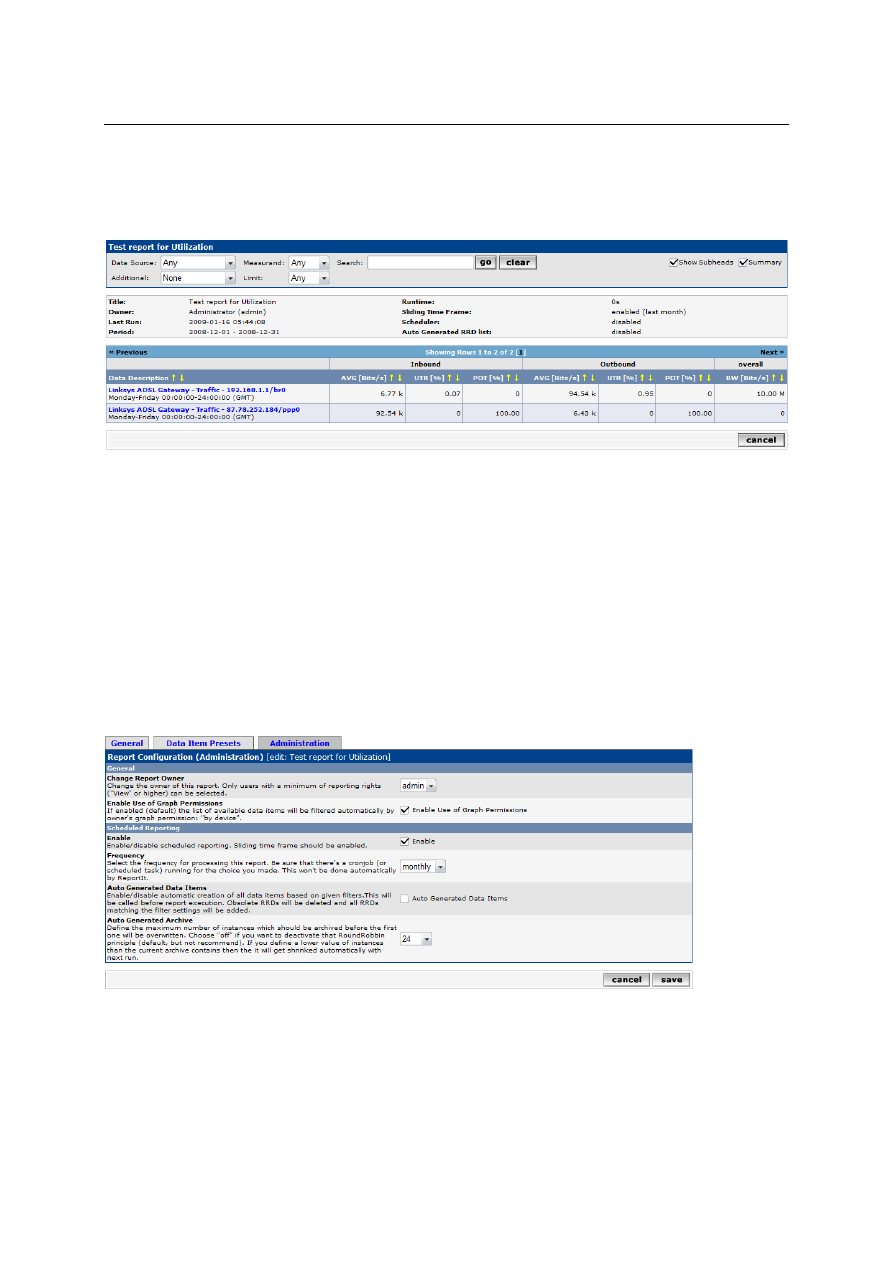
Mmmh...We created a report configuration and added some pre-configured data items.
Let's go! We are keen on seeing some results!
So we change to section “Report Configurations” once again, where we select our report
configuration and choose “Run Report” from the drop-down list. Go!
☺
Perfect! ReportIt has nothing to grumble about and we go on with a click on "view".
A small introduction to the use of ReportIt
14
Here we have our report:
We move the mouse over the abbreviations of the measurands to get a tool tip with their
description.
Very interesting! Can we explain why POT stays at 100% in the second row? Take a
look at the bandwidth. There's no “ifspeed” parameter available and the maximum value
is configured to zero within Cacti.
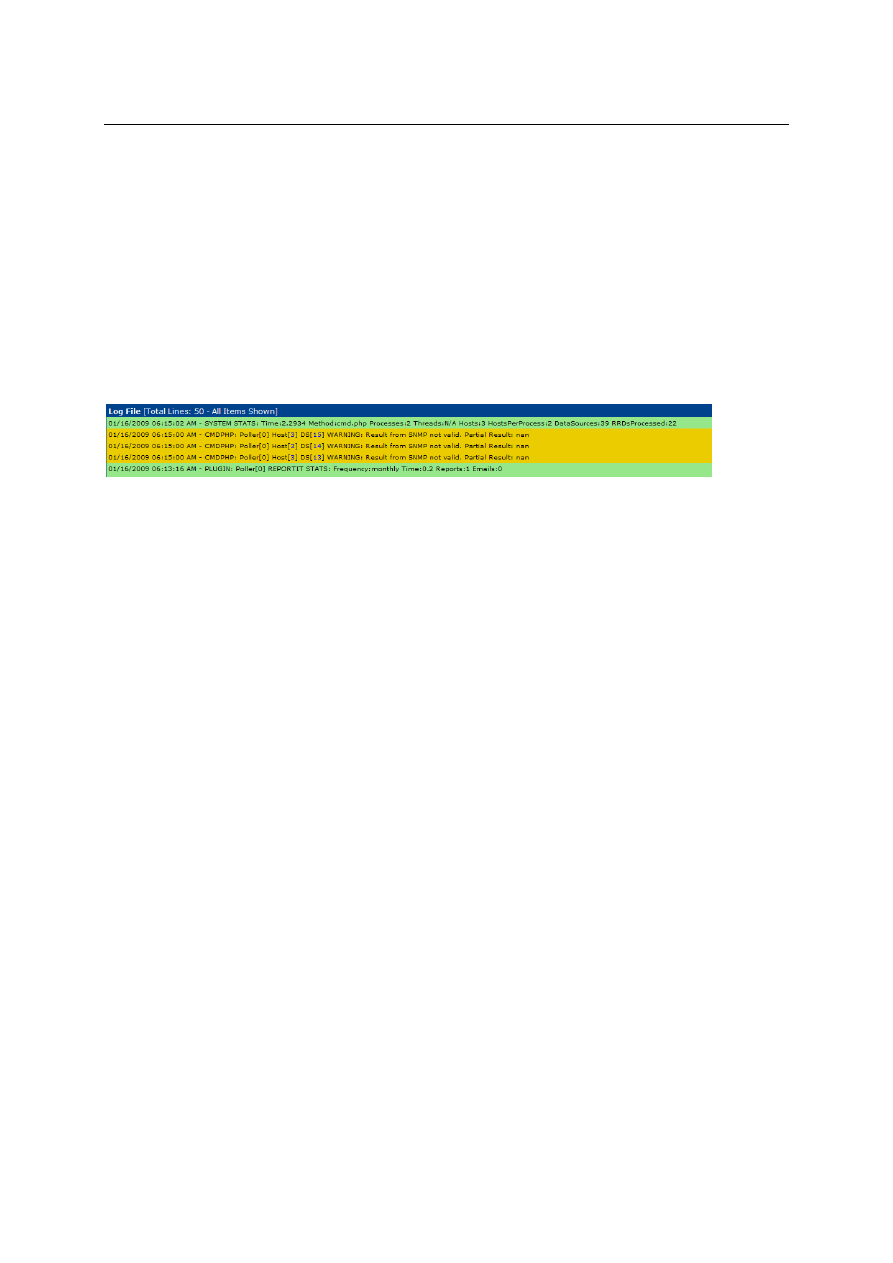
Okay, we configured a report, we have seen results, but we do not want to run it
manually (and old reports should be saved in an archive automatically). For this purpose
we can activate a feature called “Auto Archiving” within the global configuration of that
Plugin. Therefore we go to Cacti’s global settings and select the tab called “Reports”.
After that we edit our report configuration and activate “Scheduled Reporting” within the
admin tab. Frequency has to be set to “monthly”. Under “Auto generated Archive” we
use the possibility to define the maximum size of our report archive. Set to “24” means
that ReportIt has to save a maximum of 24 report instances before the oldest one will be
overwritten automatically after two years.
A small introduction to the use of ReportIt
15
Now there is only a scheduled task missing that executes our calculation automatically.
Therefore the configuration depends on the OS running at your server!
If it executes the following command all monthly reports will be recalculated:
php <path_to_the_reportit_folder>\runtime.php -m
e.g. "php c:\Apache2\htdocs\cacti\plugins\reportit\runtime.php -m"
We can leave the parameter away to see all features of that CLI script, but I will explain
them in a later article.
☺
After the scheduled task has run a similar message can be found in the Cacti log:
Wyszukiwarka
Podobne podstrony:
reported speech introductory verbs
IntroductoryWords 2 Objects English
lecture3 complexity introduction
Introduction to VHDL
ZMPST 01 Introduction
061 Literatura firmowaid 6544
PNADD523 USAID SARi Report id 3 Nieznany
Lecture1 Introduction Femininity Monstrosity Supernatural
Introduction Gencontroller C620 Nieznany
Ludzie najsłabsi i najbardziej potrzebujący w życiu społeczeństwa, Konferencje, audycje, reportaże,
REPORTAŻ (1), anestezjologia i intensywna terapia
268257 Introduction to Computer Systems Worksheet 1 Answer sheet Unit 2
Reportaż
Raport FOCP Fractions Report Fractions Final
reported speech
Reportaże telewizyjne
p08 061
Lab 03 C introduction
więcej podobnych podstron