Spectrochimica Acta Part B 58 (2003) 1715–1721
Analytical note
Slurry sampling for the determination of silver and gold in soils and sediments using electrothermal atomic absorption spectrometry Ignacio Lopez-Gar
ćıa,
Ńatalia Campillo, Isabel Arnau-Jerez, Manuel Hernandez-Cor
´
´ doba*
Department of Analytical Chemistry, Faculty of Chemistry, University of Murcia, Campus of Espinardo, Murcia E-30071, Spain Received 23 April 2003; accepted 17 June 2003
Abstract
Procedures for determining silver and gold in soil and sediment samples using electrothermal atomic absorption spectrometry are discussed. Slurries are prepared from the samples and fast-program methodology is used for the heating cycle. To determine silver, suspensions are prepared by weighing 5–200 mg of sample and adding 25 ml of a solution containing 3% vyvconcentrated nitric acid, 50% v yvconcentrated hydrogen peroxide and 25% v
yv
concentrated hydrofluoric acid. For gold determination, slurries are prepared by weighing up to 200 mg of sample and then adding 1 ml of concentrated hydrofluoric acid. For both cases, the slurries are submitted to a 10 min mild heating stage. After cooling to ambient temperature, the suspensions are introduced directly into the atomizer. No modifier other than hydrofluoric acid and hydrogen peroxide (for silver determination) are required and calibration is carried out using aqueous standards. The detection limits are 0.02 and 0.01 mg kgy1 for silver and gold, respectively.
䊚 2003 Elsevier Science B.V. All rights reserved.
Keywords: Electrothermal atomic absorption spectrometry; Slurry sampling; Silver; Gold; Soils; Sediments 1. Introduction
been reported for silver determination in human
scalp hair w2x and another related to several bio-The use of slurries in electrothermal atomic
logical standard reference materials w3x. A method absorption spectrometry (ETAAS) is a well-estab-for determining gold in high-purity silver by sus-
lished methodology whose advantages have been
pending undissolved particulates of sample in
recently reviewed w1x. However, relatively few nitric acid has also been proposed w4x. In other papers have been published on the determination
cases, the dissolved metal is concentrated using
of silver and gold by means of this approach. To
different materials and then slurried and analyzed
the best of our knowledge, only one procedure has
by ETAAS w5x.
The advantages of slurrying soil and sediments
*Corresponding author. Tel.: q34-968-367406; fax: q34-samples in a medium containing hydrofluoric acid
968-364148.
E-mail address: hcordoba@um.es (M. Hernandez-
´
have been widely demonstrated w6–8x. This Cor
´ doba).
approach was first used by Bendicho and de Loos-
0584-8547/03/$ - see front matter 䊚 2003 Elsevier Science B.V. All rights reserved.
doi:10.1016/S0584-8547(03)00135-6
I. Lopez-Gar
´
cıa
ét al. / Spectrochimica Acta Part B 58 (2003) 1715–1721
Vollebregt in their studies on glass analysis w9,10x
land) and diluted as necessary to obtain working
and later proved successful in the analysis of
standards. High quality concentrated (40% myv)
several samples containing silicaysilicate w11x. As hydrofluoric acid, concentrated (40% myv) hydro-far as we know, there are no previous reports
gen peroxide and concentrated (65% myv) nitric
regarding silver or gold determination in soils and
acid were also obtained from Fluka.
sediments using slurry-ETAAS methodology. In
this paper, rapid and reliable procedures for such
2.3. Samples
a purpose are discussed. These procedures are
based on slurrying the samples in a hydrofluoric-
The method was validated by using four refer-
nitric acid mixture followed by measuring the
ence materials, namely, Montana Soil (SRM
metal concentrations by ETAAS, using a fast-
2711), San Joaquin Soil (SRM 2709), domestic
heating program w12x.
sludge (SRM 2881) and estuarine sediment (CRM
277). In addition, two soil samples were obtained
2. Experimental
in the neighborhood of a mining zone and a third
sample was collected from an agricultural soil.
2.1. Instrumentation
Two samples of river sediment obtained in Murcia
A Perkin–Elmer Model 1100B atomic absorp-
(Spain) were also analyzed.
tion spectrometer equipped with deuterium-arc
2.4. Procedures
background correction and an HGA-400 (Perkin–
Elmer) electrothermal atomizer were used. Pyro-
The samples were ground by ball-mill for 15
lytic graphite platforms were obtained from the
min and the resulting powders were kept in tightly
same manufacturer. Measurements were carried out
closed plastic containers until analysis. No sieving
using hollow cathode lamps operated in the exper-
was carried out. For silver determination the sus-
imental conditions given in Table 1. Argon was pensions were prepared by weighing the samples
used as the inert gas, the flow rate being 300 ml
miny1 in all stages except during atomization,
(typical amounts were in the 5–200 mg range) in
plastic beakers and then adding 25 ml of a suspen-
when the flow was stopped. Background-corrected
sion medium containing 3% concentrated nitric
integrated absorbance was used as the analytical
acid, 25% vyvconcentrated hydrofluoric acid solu-
signal.
tion and 50% concentrated hydrogen peroxide. For
A Fritsch Pulverisette (Idar–Oberstein, Germa-
gold and owing to the low content in the samples
ny) ball-mill of 80 ml capacity with 20 agate balls
studied, the suspensions were prepared by slurry-
of 1 cm diameter was used for grinding the
ing up to 200 mg of sample in 1 ml of concentrated
samples. A domestic microwave oven (maximum
hydrofluoric acid
heating power 1450 W) was used to mildly heat
(caution: this is a dangerous
chemical and suitable safety precautions must be
the suspensions. Plastic (polypropylene) vessels
adopted
were found to be suitable for preparing and storing
). No other reagent was necessary for gold
determination. For both analytes, the suspensions
the solutions and the suspensions. Pipette tips were
were submitted to a 30 s mild heating stage using
also of polypropylene. Mineralization of the sam-
a domestic microwave oven at maximum power
ples for comparison purposes was carried out in
or, alternatively, to a 10 min heating stage in a
closed Teflon cups using a MLS-1200 MEGA
steam bath. After cooling, aliquots
microwave oven (Milestone, Bergamo, Italy) and
(20 ml) were
taken while the solution was being continuously
a MDR-1000y6 Rotor (Radiometer, Copenhagen,
stirred with a magnetic stirrer and manually inject-
Denmark).
ed into the electrothermal atomizer. The heating
2.2. Reagents
programs given in Table 1 were used.
To confirm the reliability of the procedures, the
Standard solutions (1000 mg ly1) of silver and
samples, with the exception of SRMs, were pre-
gold were obtained from Fluka (Buchs, Switzer-
viously analyzed. Fractions (50–250 mg) of the
´
cıa
ét al. / Spectrochimica Acta Part B 58 (2003) 1715–1721
1717
Table 1
Instrumental settings and heating programs
Parameter
Gold
Silver
Current lamp (mA)
10
12
Wavelength (nm)
242.8
328.1
Bandpass (nm)
0.7
0.7
Atomizer type
Platform
Platform
Injection volume (ml)
20
10
Calibration (ng mly )
1
0–200
0–20
Characteristic mass (pg)
20
3
Detection limit (mg gy1)
0.01
0.02
R.S.D.a(%)
"3.1
"2.3
(100 ng mly1)
(10 ng mly1)
Furnace heating programs
Element
Step
Parameter
Gold
Silver
Dry
T (8C)
300
300
Ramp (s)
20
20
Hold (s)
10
10
T (8C)
2400
1800
Ramp (s)
0
0
Hold (s)
6
4
Clean
T (8C)
2650
2650
Ramp (s)
1
1
Hold (s)
3
3
a n s10.
b The flow of argon was stopped.
samples were weighed into Teflon cups and 5 ml
influence of the atomization temperature on the
of concentrated hydrofluoric acid, 0.2 ml of con-
analytical signals was studied in the presence of
centrated nitric acid and 5 ml of water were added.
hydrofluoric acid for both aqueous solutions of the
The program used in the MLS-1200 microwave
metals and suspensions prepared from two differ-
oven consisted of 8 min to reach 1000 W and 7
ent samples. For silver determination, the atomi-
min hold at 1000 W. After this treatment, the
zation temperatures were varied in the 1500–2100
samples were maintained in the closed cups in an
8C range and 1800 8C was selected as optimal.
ice bath for 10 min before being diluted with de-
When the optimal atomization temperature for
ionized water in 25 ml volumetric flasks. Solutions
gold was studied, the aqueous solutions and the
were analyzed by ETAAS.
slurries prepared from the samples behaved differ-
ently, the study being made quite difficult by both
3. Results and discussion
the very low level of analyte and the high back-
3.1. Optimization of the heating programs
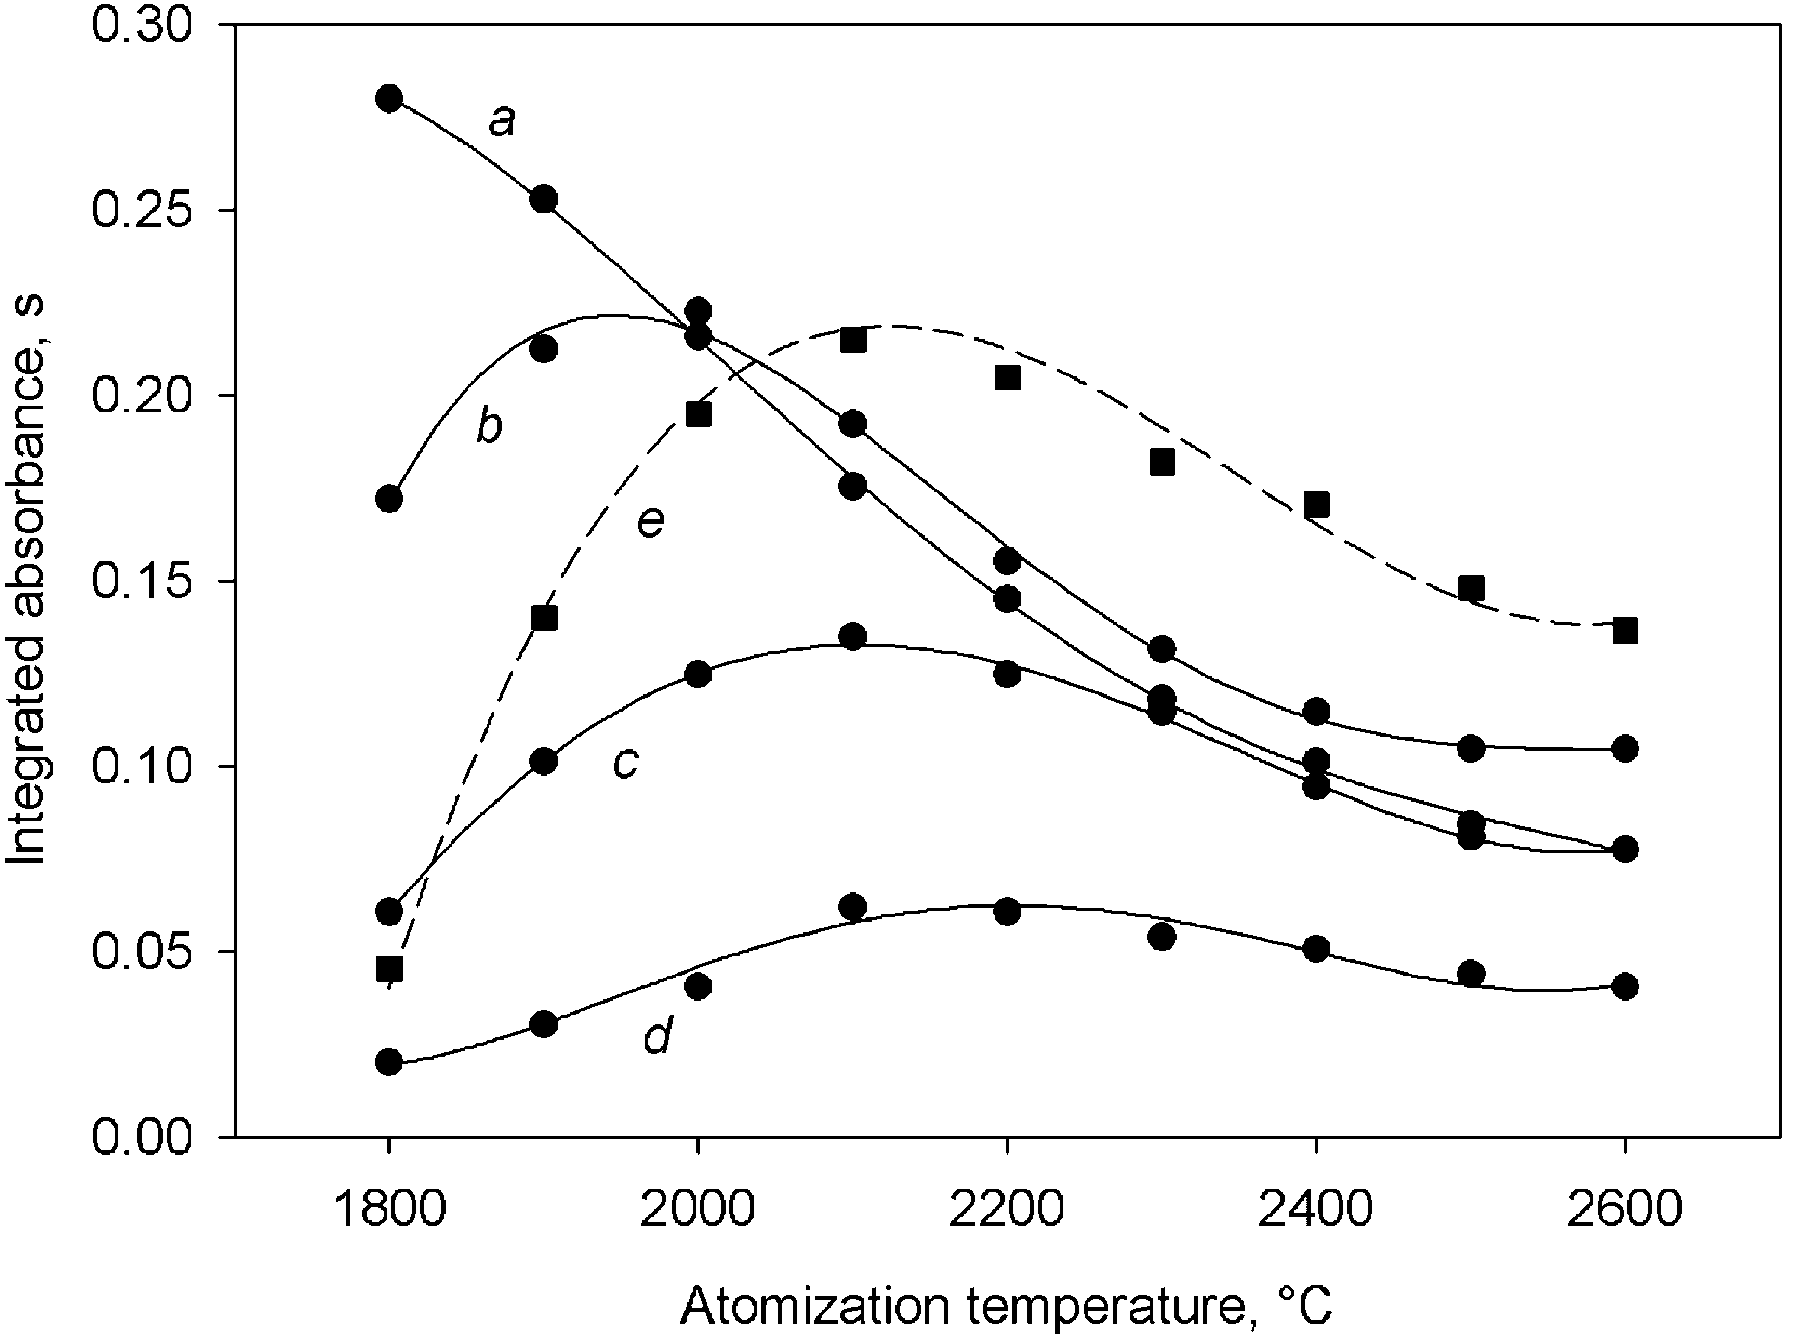
ground value. Fig. 1 shows the variation of the analytical signal obtained from a 45 mg ly1 gold
Fast-heating
methodology
was
used
solution prepared in concentrated hydrofluoric acid
throughout the work. The optimal drying temper-
(curve a) and that found for a 150 mg mly1 slurry
ature and holding time to be used in the modified
prepared from SRM 2711 and spiked with 68 mg
drying step were studied, being the optimal values
ly1 of gold (curve e). It is clear that there was a
300 8C with a 10 s holding time and 20 s ramp
matrix effect and a temperature above that selected
time.
for silver is required. As can be seen in curves b–
To prevent damage to the pyrolytic material
d, the change in the analytical signal in the
from the high silicate content of the samples, the
presence of the solid phase was similar to that
1718
I. Lopez-Gar
´
cıa
ét al. / Spectrochimica Acta Part B 58 (2003) 1715–1721
when nickel was replaced by others chemical
modifiers. Finally, to facilitate calibration against aqueous standards, no chemical modifier was added and 2400 8C was selected as the optimal
temperature. Under these conditions, no matrix
effect was observed and the background was
lowest.
3.2. Optimization of the chemical agents con-
centrations
As indicated above, the suspensions for gold
determination had to be prepared with a high
proportion of solid matter, which hindered meas-
urement and made the use of a high proportion of
concentrated hydrofluoric acid in the suspending
Fig. 1. Variation of the analytical signal with the atomization medium advisable. This proportion was varied in
temperature. Curves a–d correspond to a 45 mg ly1 gold standard solution in the presence of 0, 200, 400 and 1000 mg ly1
the 0–100% vyvrange and the fractions of analyte
nickel solution, respectively. Curve e was obtained using a 150
mobilized into the liquid phase were estimated by
mg mly1 slurry spiked with 68 mg ly1 gold standard solution.
measuring the gold content of the liquids after
they were filtered through a 0.45 mm membrane
obtained for gold atomization when a classical
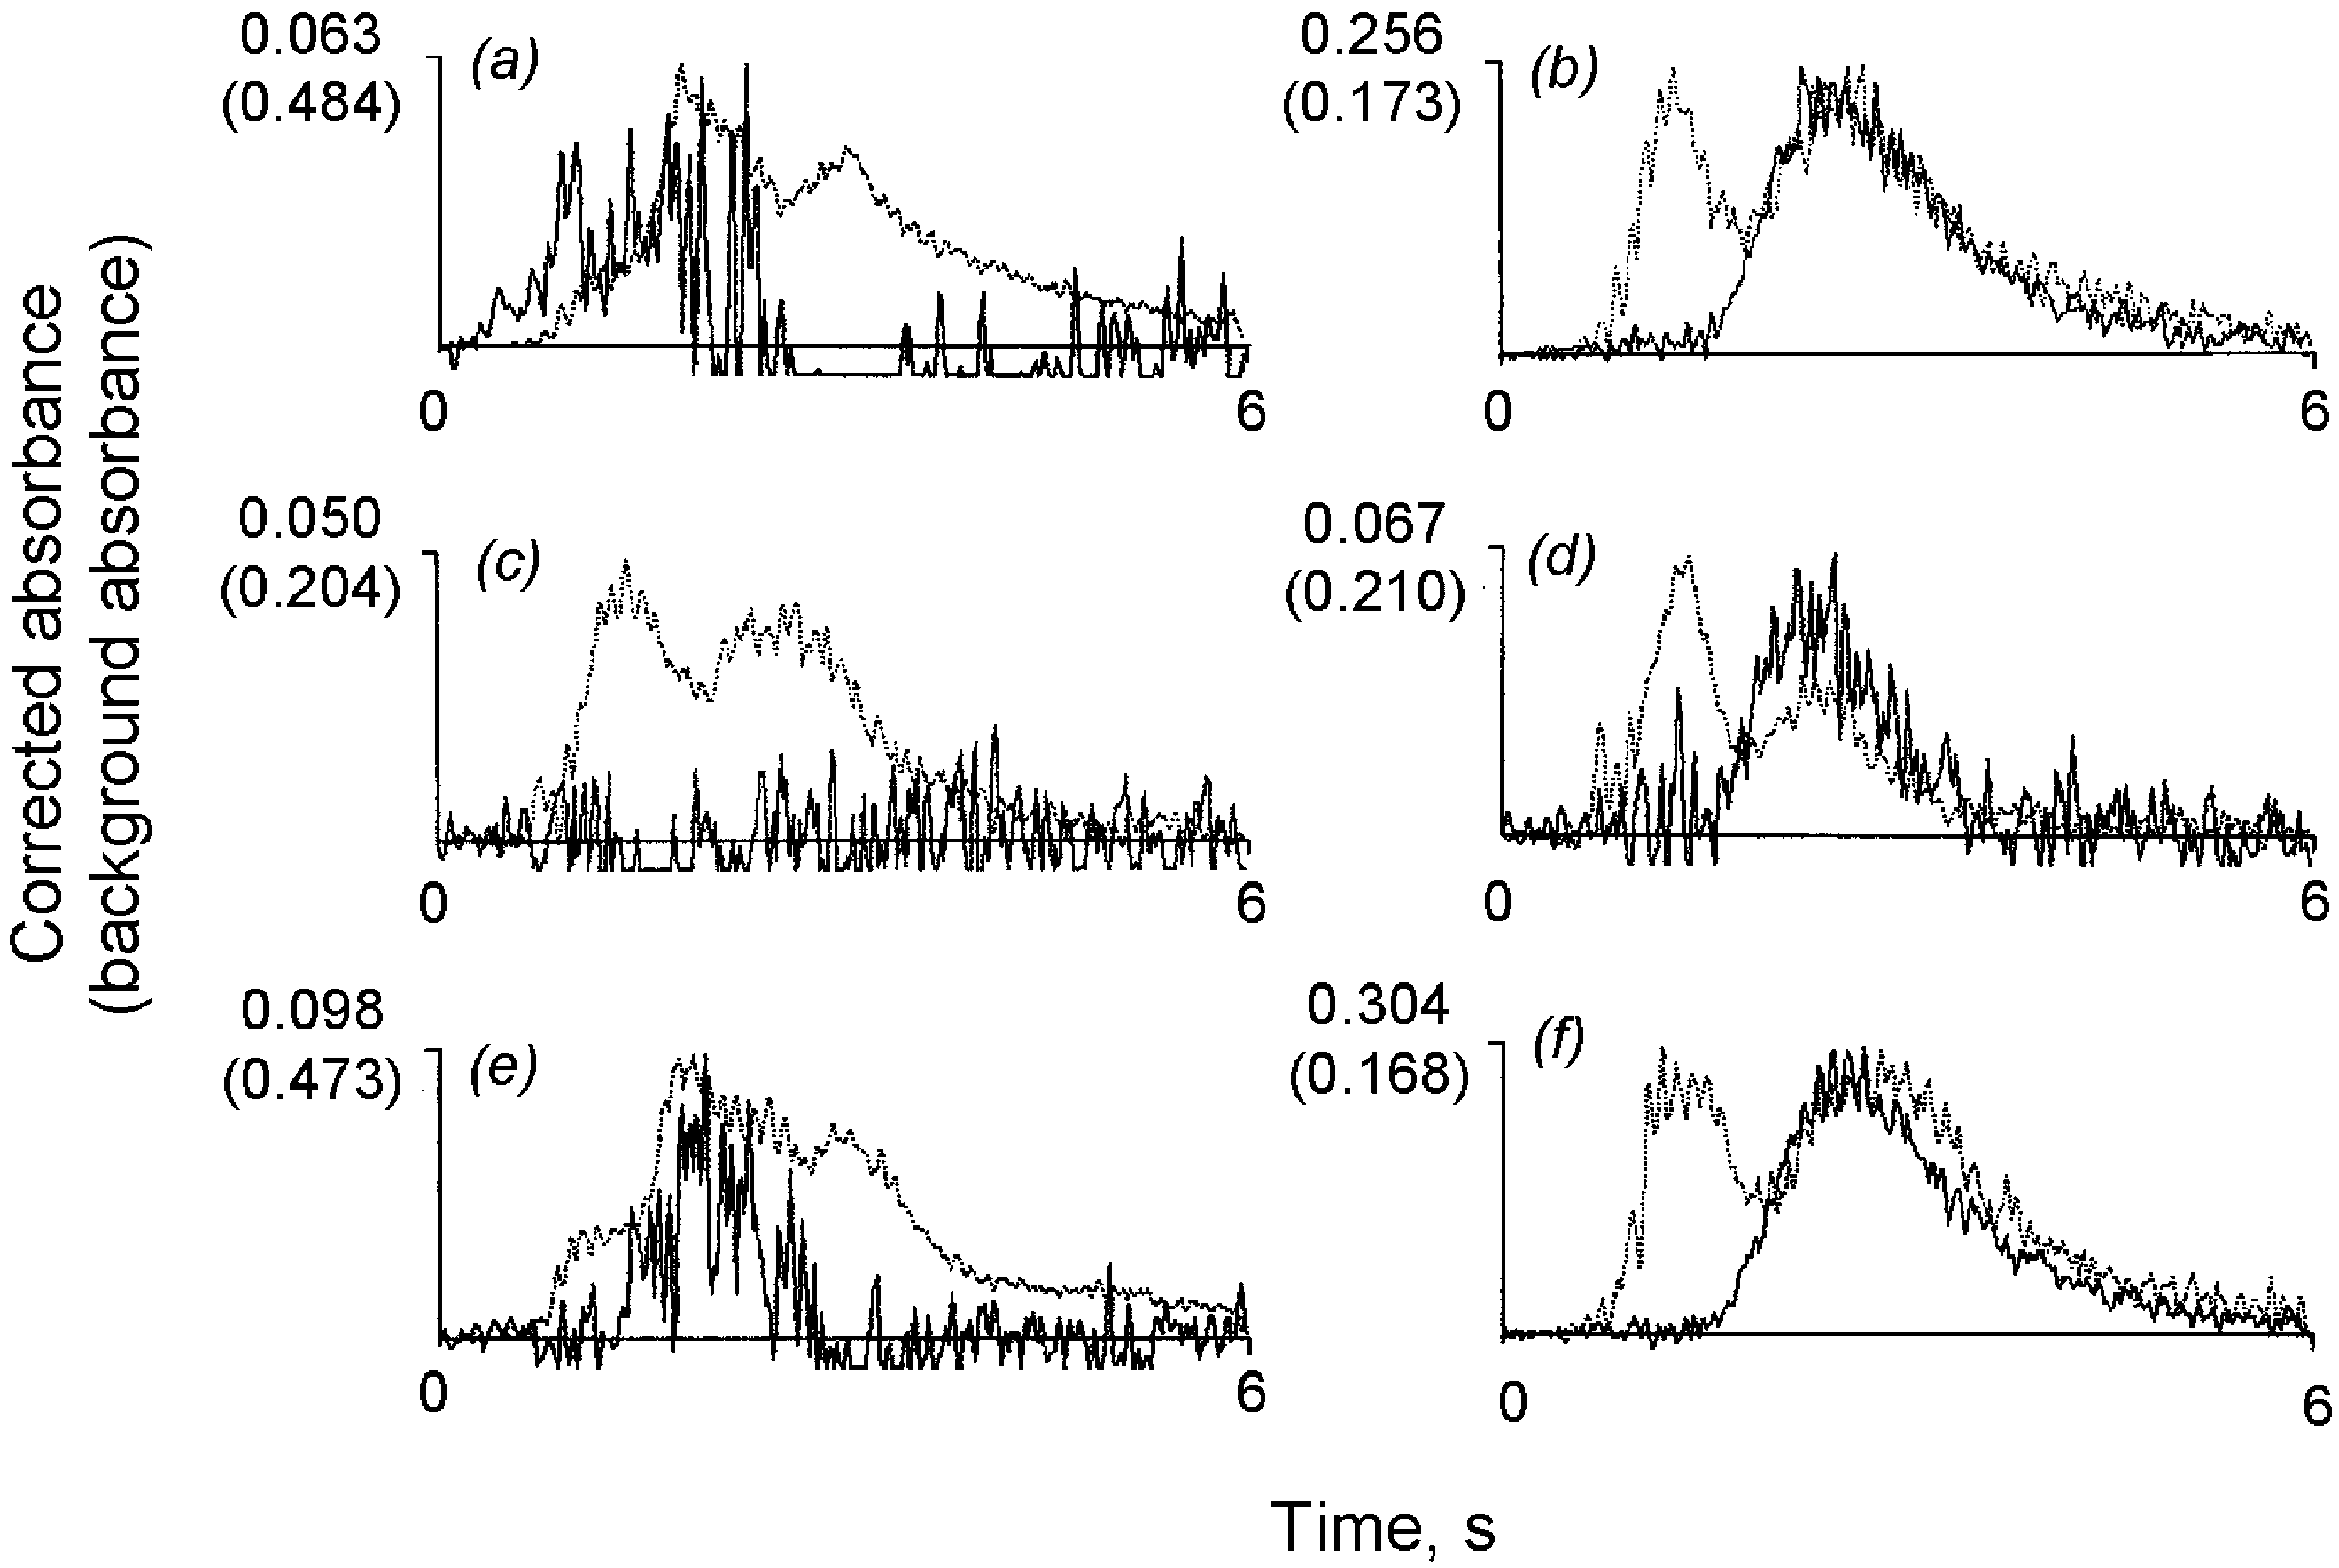
filter. Fig. 2 shows gold atomization profiles modifier such as a nickel salt was present, the
obtained in different experimental conditions. As
peak area for gold decreasing as the nickel con-
can be seen in the graphs, when a 150 mg mly1
centration increased. A similar effect was observed
slurry was prepared in a 25% vyvconcentrated
Fig. 2. Atomization profiles for gold obtained from 150 mg mly1 slurries prepared in a medium containing 25 and 100% vyv concentrated hydrofluoric acid (a and b, respectively) and spiked with 200 mg ly1 gold standard. Graphs c and d refer to gold measurement in the supernatants. Graphs e and f refer to gold measurement in the supernatants after the heating treatment.
I. Lopez-Gar
´
cıa
ét al. / Spectrochimica Acta Part B 58 (2003) 1715–1721
1719
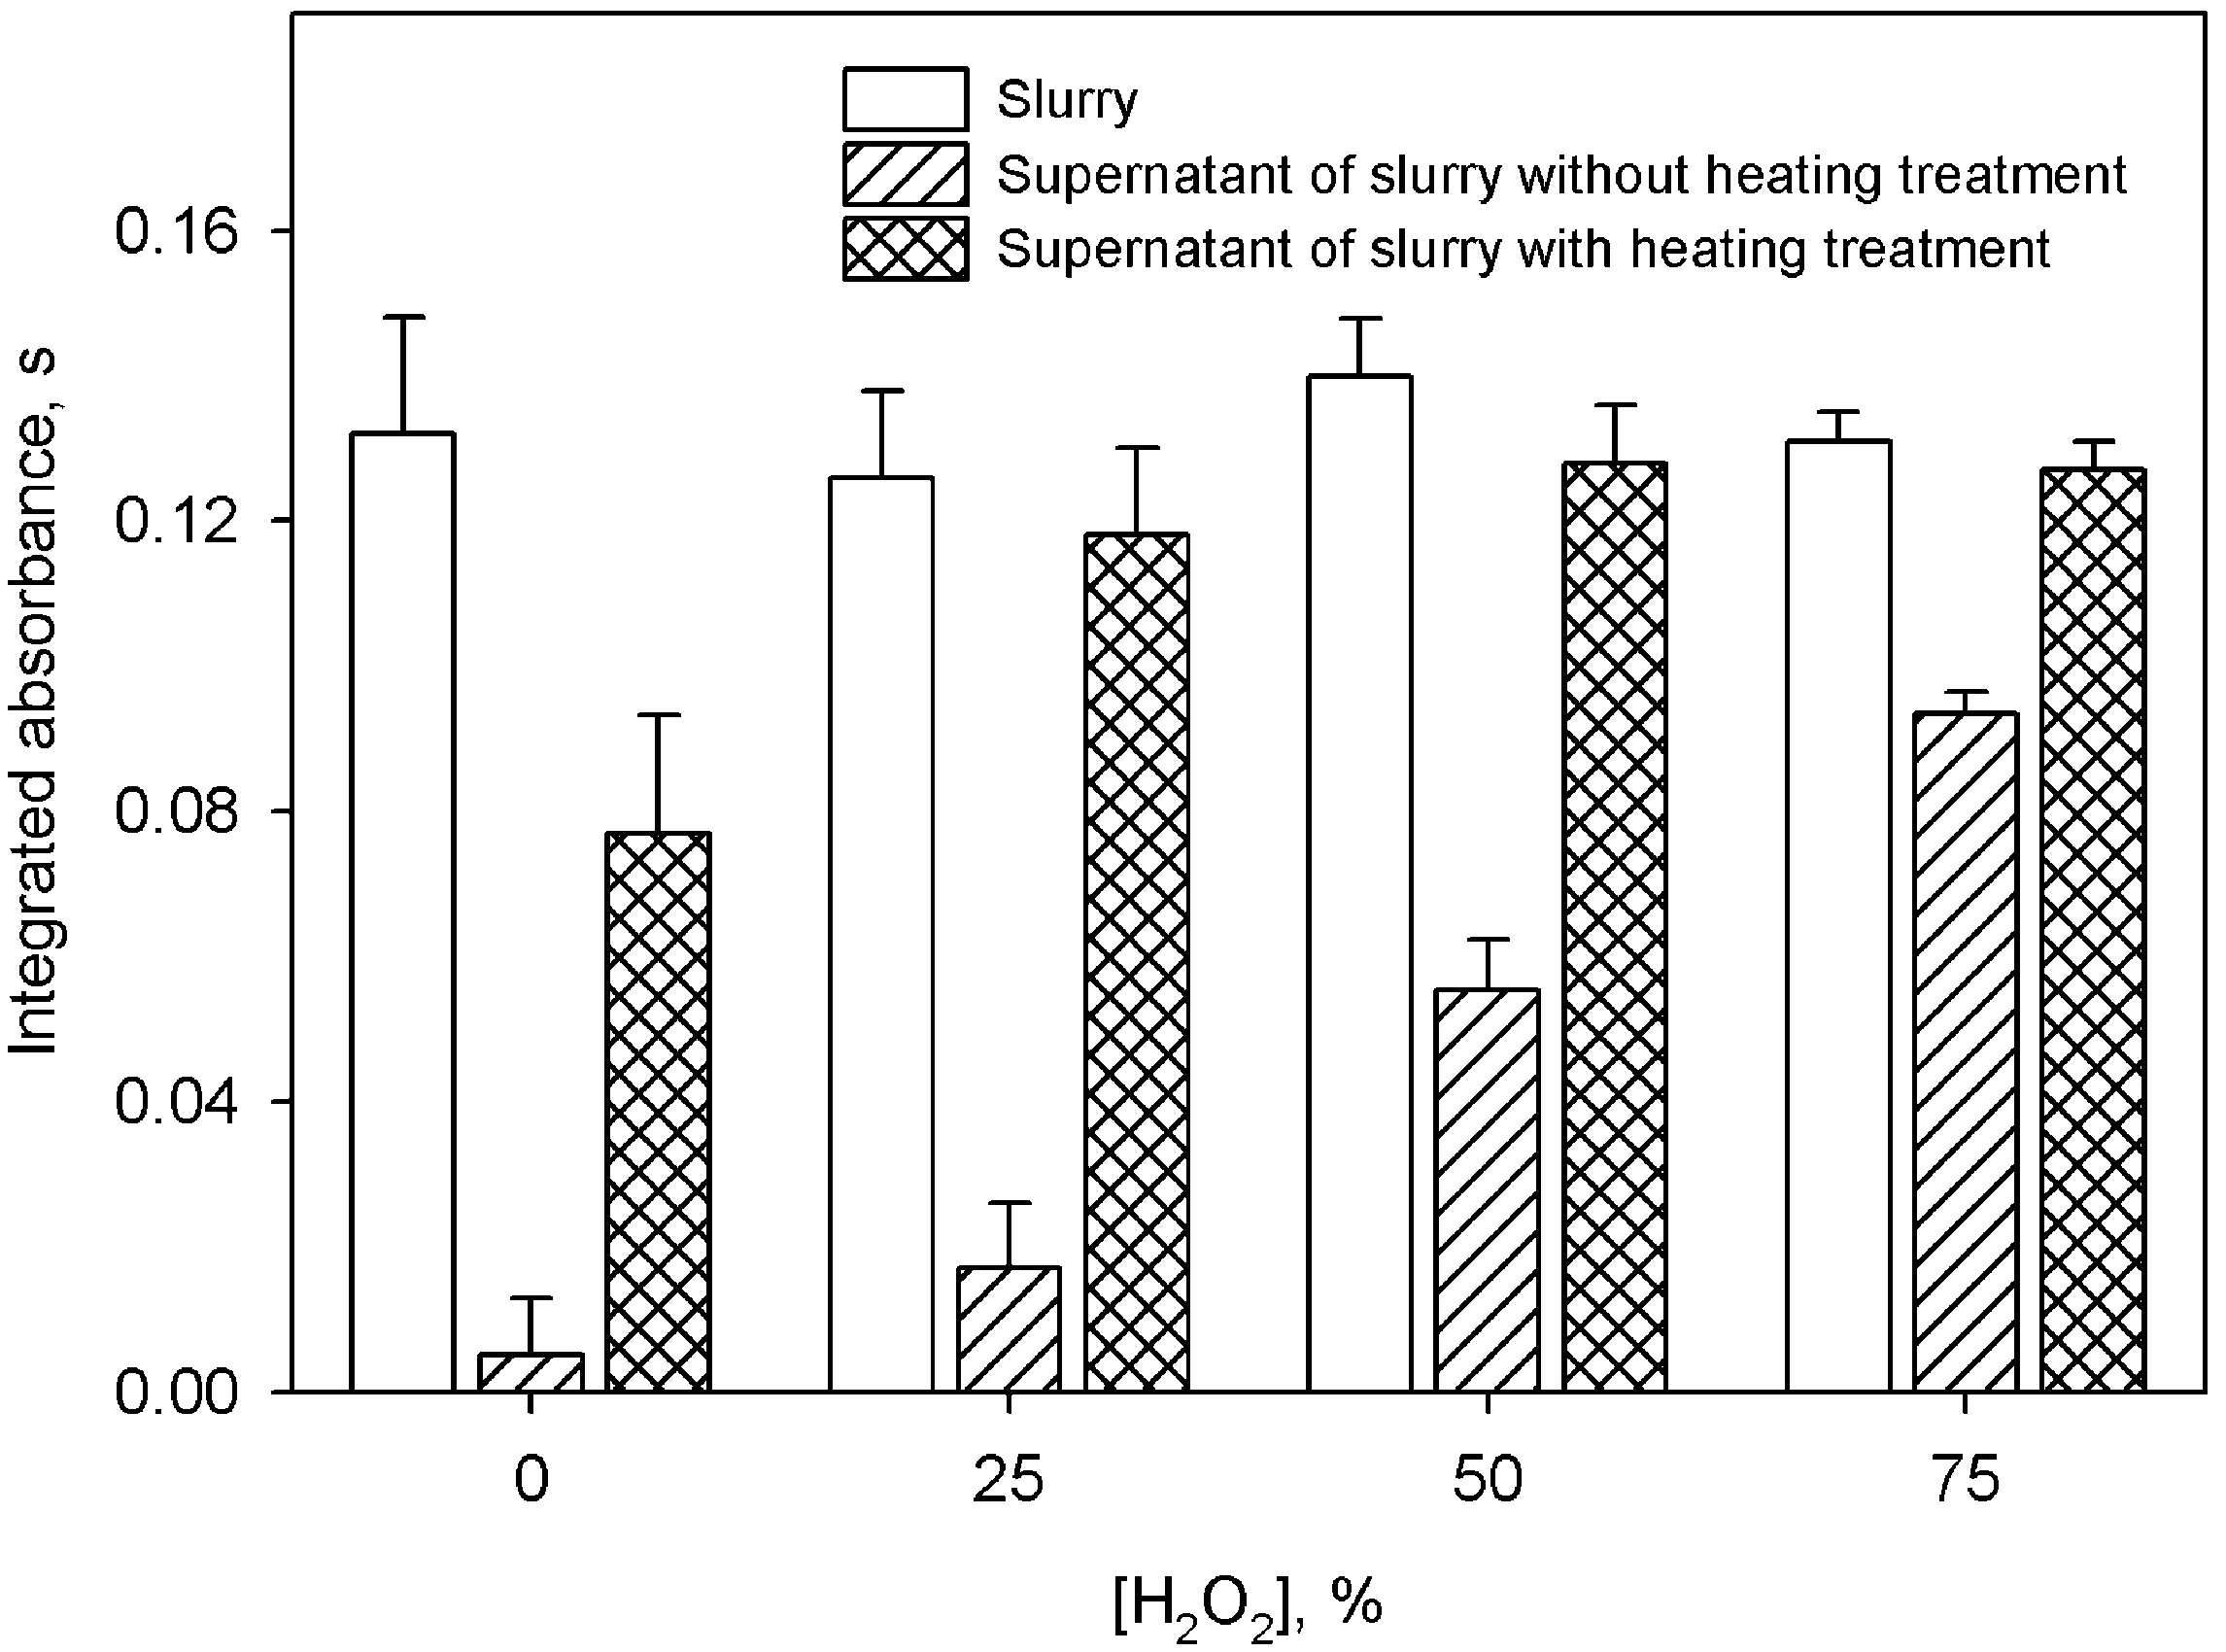
Fig. 3. Effect of the hydrogen peroxide concentration on the peak area of silver. The segments over the bars indicate the S.D.
hydrofluoric acid solution and spiked with 200 mg
A different behavior was observed in the case
ly1 of gold, the analytical signal was very poor
of silver measurements. The extraction of the
and the reliable measurement impossible. When
analyte to the aqueous phase did not increase when
the solid sample was suspended directly in the
the proportion of concentrated hydrofluoric acid in
concentrated hydrofluoric acid solution, a well-
the suspending medium exceeded 25% vyv. How-
shaped atomization profile was obtained. The frac-
ever, an important effect on silver mobilization
tion of gold mobilized was in this case calculated
was observed when hydrogen peroxide was incor-
to be approximately 20%. Graphs 2c and 2d show
porated in the suspension medium. As can be seen
gold atomization profiles obtained from the super-
from Fig. 3, the signal from the silver in the natants. The analytical signal increased (graphs 2e
supernatant considerably increased in the presence
and 2f) when the suspensions were submitted to a
of this chemical. Silver extraction was near 100%
mild heating stage (10 min in a steam bath). No
and so the relative standard deviations (R.S.D.) of
effect was observed in the signal obtained from
the measurements ( n s10) decreased from 8–10%
aqueous standards when the hydrofluoric acid con-
in the absence of hydrogen peroxide, to 2–3% in
centration was increased.
its presence (50% vyvconcentrated solution) in
To make the heating stage easier to carry out,
the suspension medium.
the use of a domestic microwave oven was studied.
It was verified that a short 30 s heating step was
3.3. Influence of the proportion of solid matter in sufficient to achieve maximum signal, approxi-the suspension
mately 45% of gold being extracted to the aqueous
phase when the suspensions were prepared directly
The influence of the suspension concentration
in the concentrated acid solution, as recommended.
on silver determination was studied for three ref-
Lower hydrofluoric acid concentrations proved
erence materials (SRMs 2711, 2709 and 2781),
inadequate. It must be remembered that suitable
covering a wide interval of concentrations (4.63,
safety precautions must be observed when using
0.41 and 98 mg kgy1, respectively). Linearity was
the
concentrated
and
hot
hydrofluoric
acid
obtained for suspensions prepared using up to 4,
medium.
22 and 2 mg mly1 for SRMs 2711, 2709 and
I. Lopez-Gar
´
cıa
ét al. / Spectrochimica Acta Part B 58 (2003) 1715–1721
Table 2
Results for the determination of gold and silver in soil, sediment and sludge samples Sample
Contenta, mg kgy1
Gold
Silver
Slurry
Mineralization
Slurry
Mineralization
Industrial soil 1
0.12"0.02
0.11"0.02
0.54"0.03
0.59"0.03
Industrial soil 2
0.13" 0.03d
0.13" 0.03d
4.94"0.20
4.84"0.15
Agricultural soil
0.06" 0.02e
0.05" 0.02e
0.20"0.05
0.17"0.03
River sediment 1
0.07" 0.03e
0.07" 0.03e
3.32"0.02
3.38"0.02
River sediment 2
0.12" 0.02d
0.13" 0.03d
1.20"0.02
1.23"0.03
SRM 2711 (Montana soil)
0.13" 0.03d
4.78"0.08
4.63" 0.39b
SRM 2709 (San Joaquin soil)
0.32"0.06
0.37"0.03
0.41" 0.03b
SRM 2781 (Domestic sludge)
0.07" 0.03e
0.07" 0.03e
94.0"6
98.0" 8b
CRM 277 (Estuarine sediment)
0.12" 0.02d
0.13" 0.03d
3.35"0.06
a Mean"S.D. ( n s4).
b Certified value.
c Not certified. Value is given by the supplier for informative purposes.
d Sample spiked with 0.12 mg kgy1 of gold.
e Sample spiked with 0.06 mg kgy1 of gold.
2781, respectively. These limits must be considered
ation). The repeatability was calculated using the
illustrative, since they depend on the concentration
RSDs for ten successive injections. The data
of the metal in the sample. R.S.D.s ( n s10) were shown were obtained by applying the recommend-below"4% when the proportion of solid matter in
ed procedure, which includes heating the suspen-
the suspension was above 0.2 mg mly1. For the
sion. When this stage was omitted, R.S.D.s
samples with a relatively high silver content, dilut-
increased up to "8 and "6%, for gold and silver, ed slurries were prepared and the R.S.D.s were in
respectively.
the 5–10% range.
The results obtained for the different samples
For gold determination, the influence of the
analyzed using the proposed procedures, as well
suspension concentration was studied for two soil
as a reference method based on mineralization
samples of a mining and agricultural origin and a
using a closed system, are summarized in Table 2.
reference soil (SRM 2709). Due to the low gold
The reliability of the method was further corrobo-
concentration in the samples, they were spiked
rated by using four certified reference materials.
with a gold standard solution. Linearity was in this
The results obtained are also shown in Table 2,
case obtained up to 300 mg mly1. The absence of
together with the certified values.
a matrix effect was verified by comparing the
slopes of the aqueous calibration and standard
additions calibration graphs obtained for suspen-
4. Conclusion
sions of all the samples studied at two different
concentration levels.
The slurry-ETAAS approach allows the rapid
determination of silver and gold in soils and
3.4. Calibration graphs, repeatability, results and sediments, confirming the advantages of this meth-accuracy
odology over conventional methods. The presence
of hydrofluoric acid in the suspension medium is
Table 1 shows the concentration range of the important since, in addition to its extracting effect calibration graphs. The detection limits were cal-
(which transfers a significant fraction of the anal-
culated for ten successive injections of the blank
yte into the supernatant), it acts as a true chemical (criterion based on three times the standard devi-modifier by simplifying the matrix during the
´
cıa
ét al. / Spectrochimica Acta Part B 58 (2003) 1715–1721
1721
heating cycle when suspensions are prepared from
and Pseudomonas Putida, J. Anal. At. Spectrom. 8
materials with a high silicaysilicate content.
(1993) 1015–1022.
w6x I. Lopez-Gar
ćıa,
´
M. Sanchez-Merlos,
´
M. Hernandez-
Ćor
´ doba, Rapid determination of selenium in soils and
Acknowledgments
sediments using slurry-sampling-electrothermal atomic absorption spectrometry, J. Anal. At. Spectrom. 11
The authors are grateful to the Spanish Ministery
(1996) 1003–1006.
of Science and Technology for financial support
w7x I. Lopez-Gar
ćıa,
´
M. Sanchez-Merlos,
´
M. Hernandez-
´
(Project BQU2000-0218).
Cor
´ doba, Arsenic and antimony determination in soils
and sediments by graphite furnace atomic absorption
References
spectrometry with slurry sampling, Spectrochim. Acta
Part B 52 (1997) 437–443.
w
w1x M.J. Cal-Prieto, M. Felipe-Sotelo, A. Carlosena, J.M.
8x N. Campillo, I. Lopez-Gar
ćıa,
´
P. Vinas,
˜
I. Arnau-Jerez,
Andrade, P. Lopez-Mahıa,
´
Ś. Muniategui, D. Prada,
M. Hernandez-Cor
´
´ doba, Determination of vanadium,
Slurry sampling for direct analysis of solid materials by molybdenum and chromium in soils, sediments and
electrothermal
atomic
absorption
spectrometry
sludges by electrothermal atomic absorption spectrom-
(ETAAS). A literature review from 1990 to 2000,
etry with slurry sample introduction, J. Anal. At. Spec-Talanta 56 (2002) 1–51.
trom. 17 (2002) 1429–1433.
w2x P. Bermejo-Barrera, A. Moreda-Piner
˜
o, J. Moreda-Pine-
˜
w9x C. Bendicho, M.T.C. de Loos-Vollebregt, The influence ro, A. Bermejo-Barrera, Determination of traces of silver of pyrolysis and matrix modifiers for analysis of glass in human scalp hair slurries by electrothermal atomic materials by GFAAS using slurry sample introduction,
absorption spectrometry, Mikrochim. Acta 129 (1998)
Spectrochim. Acta Part B 45 (1990) 679–693.
71–76.
w10x C. Bendicho, M.T.C. de Loos-Vollebregt, Metal extrac-w3x E.D. Byrd, D.J. Butcher, Determination of trace elemen-tion by hydrofluoric acid from slurries of glass materials ts in biological standard reference materials by graphite in graphite furnace atomic absorption spectrometry,
furnace atomic absorption spectrometry with solid and Spectrochim. Acta Part B 45 (1990) 695–710.
slurry sampling, Spectrosc. Lett. 26 (1993) 1613–1624.
w11x I. Lopez-Gar
ćıa,
É. Navarro, P. Vinas,
˜
M. Hernandez-
´
w4x M.W. Hinds, Determination of gold, palladium and
Cor
´ doba, Rapid determination of lead, cadmium and
platinum in high-purity silver by different solid-sam-thallium in cements using electrothermal atomic absorp-pling graphite-furnace atomic-absorption spectrometry tion spectrometry with slurry sampling introduction,
methods, Spectrochim. Acta Part B 48 (1993) 435–445.
Fresenius J. Anal. Chem. 357 (1997) 642–646.
w5x L.C. Robles, C. Garcıa-Olalla,
Á.J. Aller, Determination
w12x D.J. Halls, Analytical minimalism applied to the deter-of gold by slurry electrothermal atomic absorption
mination of trace elements by atomic spectrometry, J.
spectrometry after preconcentration by Escherichia Coli Anal. At. Spectrom. 10 (1995) 169–175.
Document Outline
Wyszukiwarka
Podobne podstrony:
Srebro i złoto
zagożdżon,geologia złożowa, złoto i srebro
MAKIJAŻ 27 - ZŁOTO I SREBRO(1), kosmetologia, Makijaż(1)
MAKIJAŻ 27 - ZŁOTO I SREBRO, Makijaż
MAKIJAŻ' ZŁOTO I SREBRO
4 Diamenty, złoto, srebro, platyna (26 10 2010)
398 Gerard Cindy Ni srebro ni złoto Dzikie serca1
wierszyki masażyki, praca z głębiej upośledzonymi
Postacie wody w glebie, Studia, UTP Ochrona środowiska, I rok, Semestr II, Geologia
Stymulacja polisensoryczna Poranny krąg, praca z głębiej upośledzonymi
MAKIJAŻ 214 GRANAT I SREBRO
Jak czyścić srebro(1)
NStephenson Zywe srebro T1
Wieczór wzruszeń i życzeń, scenariusze, głębiej, grupowe, Gimnazjum
scenariusz czwartek, moje, głębiej praktyki
Protokół z moich dla oli, moje, głębiej praktyki
MAKIJAŻ 212 RÓŻ, BORDO I SREBRO
Srebro
więcej podobnych podstron