415 (8)
388
Dress Accessories
electron microscope (SEM) using a 20 keV accelerating voltage and Link Systems ZAF/4 software. The data obtained from these anaiyses was used to roughly ‘calibrate’ the qualitative XRF data to obtain a morę accurate definition of the alloys in use. The quantitative SEM anaiyses suggested that a suitable scaling of the element ratios could be applied to make them morę com-parablc. Based on this information the /mc ratio has been left unscaled, the lead ratio has been multiplied by 2.5 and the tin ratio has been multiplied by 12. It is these scaled ratio figures that have been used in preparing the figures.
Data analysis
The anaiyses were split into three main groups: copper alloys, lead/tin alloys and other non-ferrous metals (mostly gold and silver). A sepa-rate data analysis methodology was devised for each group based on the differing number and level of alloying metals involved.
Copper alloys are mainly copper, with deliber-ate additions of tin, zinc and/or lead. It is neces-sary to take into account both the absolute and relative proportions of each alloying element in defining the alloy type (p 13ff)- Brasses are mainly copper and zinc, bronzes copper and tin, while gunmetals contain significant amounts of both zinc and tin. Alloys containing large amounts of lead are described as ‘leaded’, whilst those containing lower, but still significant amounts of lead are ‘(leaded)’.
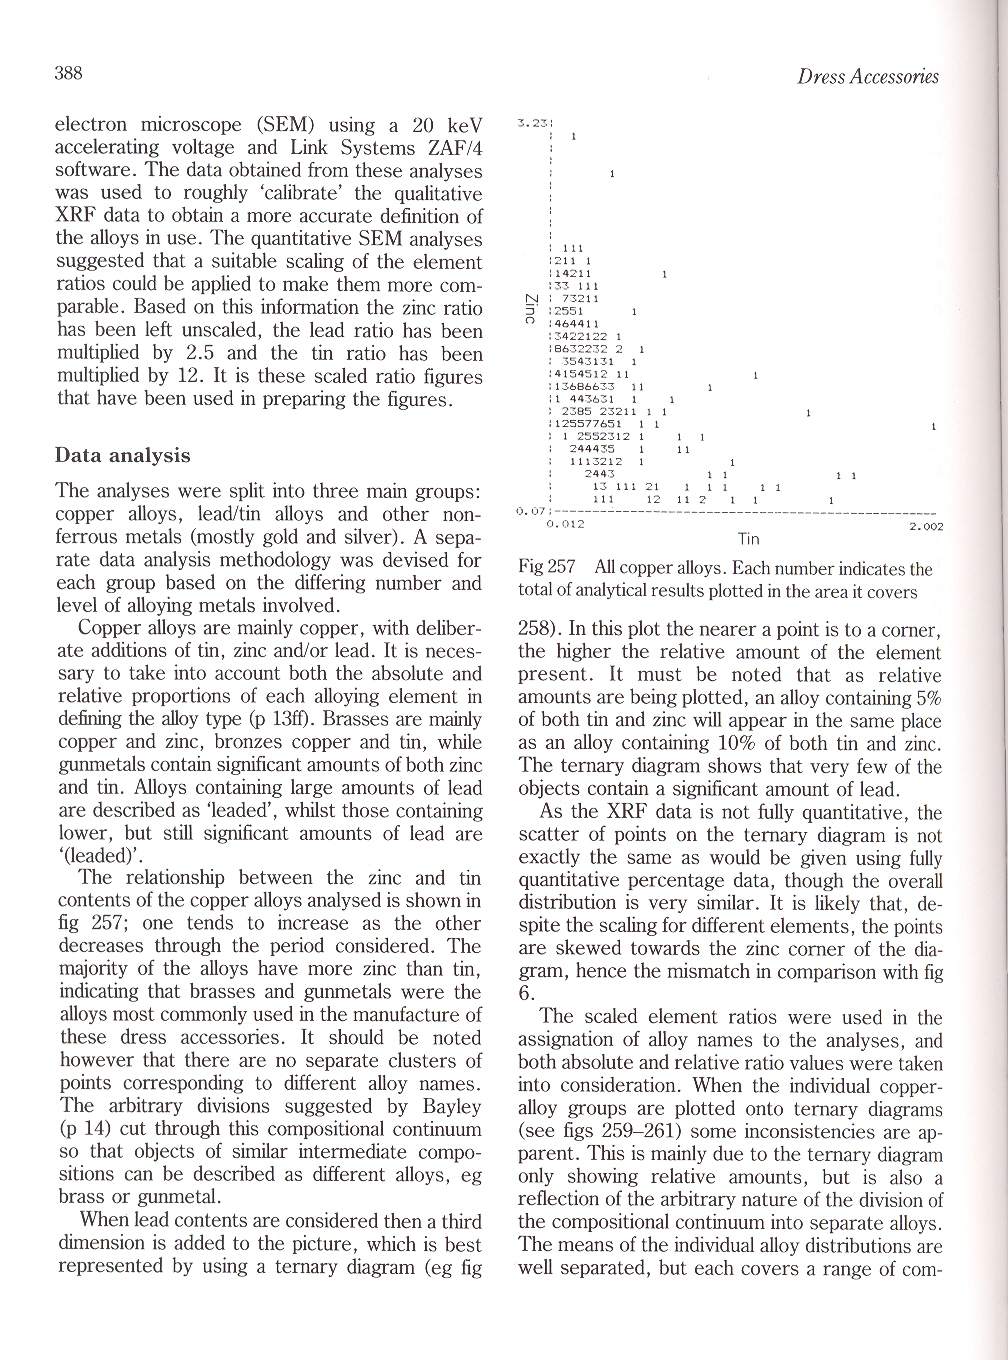
The relationship between the zinc and tin contents of the copper alloys analysed is shown in fig 257; one tends to increase as the other decreases through the period considered. The majority of the alloys have morę zinc than tin, indicating that brasses and gunmetals were the alloys most commonly used in the manufacture of these dress accessories. It should be noted however that there are no separate clusters of points corresponding to different alloy names. The arbitrary divisions suggested by Bayley (p 14) cut through this compositional continuum so that objects of similar intermediate compo-sitions can be described as different alloys, eg brass or gunmetal.
When lead contents are considered then a third dimension is added to the picture, which is best represented by using a ternary diagram (eg fig
N
d'
o
11 i 211 1
14211 1
33 111 73211
2551 1
46441 1 3422122 1 8632232 2 1
3543131 1
4154512 11 13686633 11
1 443631 1
2385 23211 1 1 125577651 1 1
1 2352312 1 244435 1
1113212 1
O. 071-----
0.012
13 111 21 111 12
I 1
II
1 1 11 2
1 1 1 1
Tin
2.002
Fig 257 Ali copper alloys. Each number indicates the total of analytical results plotted in the area it covers
258). In this plot the nearer a point is to a corner, the higher the relative amount of the element present. It must be noted that as relative amounts are being plotted, an alloy containing 5% of both tin and zinc will appear in the same place as an alloy containing 10% of both tin and zinc. The ternary diagram shows that very few of the objects contain a significant amount of lead.
As the XRF data is not fully quantitative, the scatter of points on the ternary diagram is not exactly the same as would be given using fully quantitative percentage data, though the overall distribution is very similar. It is likely that, de-spite the scaling for different elements, the points are skewed towards the zinc corner of the diagram, hence the mismatch in comparison with fig 6.
The scaled element ratios were used in the assignation of alloy names to the anaiyses, and both absolute and relative ratio valucs were taken into consideration. When the individual copper-alloy groups are plotted onto ternary diagrams (see figs 259-261) some inconsistencies are ap-parent. This is mainly due to the ternary diagram only showing relative amounts, but is also a reflection of the arbitrary naturę of the division of the compositional continuum into separate alloys. The means of the individual alloy distributions are well separated, but each covers a rangę of com-
Wyszukiwarka
Podobne podstrony:
SCANNING ELECTRON MICROSCOPE (SEM) - EDX SEM digunakan untuk mengkaji informasi morfologi materiał h
431 (10) 404 Dress Accessońes —, 1987 ‘Report on the Composition of the Ingots and Axle-Cap’, in Mea
369 (15) 342 Dress AccessońesPurses (Identification of leather by Glynis Edwards, AMD Purses and pou
Diatom Lab s NANO-ADHESIVE for micromanipulated diatoms is INVISIBLE even to Scanning Electron Micro
15fg0013 IBEJ E3 360,240 2295 x 229! View Form ~
Ewolucja rozdzielczości mikroskopów CTEM - conventional transmission electron microscopy; STEM - sca
(a)(b) Figurę 2: Scanning electron microscopy micrograph of a typical polysulfone •» membranę
S1 H *0 * O1 "
Ś> S3 Databasel: 6aaa AaHHbix (Access 2007) - Microsoft
694 optics magnifying glass and microscopes cross section of an electron microscope corte"tra
274 (42) Dress Accessońes 246 1078 805 1095 (A) mounts with fields of dots (1:1) (
276 (40) 248 Dress Accessońes because no indication has been recognized on them of the wearer’s adhe
278 (40) 250 Dress Accessories 1314 1311 SWA81 2186 (2055) 9 fig 160 Corroded
284 (41) 256 Dress Accessońes Hooked annular brooch Copper alloy 1338 SWA81 acc. no. 1493 (context
286 (34) 258 Dress Accessońes 166 Pentagonal, hexagonal and six-lobed brooches -odginał shapes resto
292 (37) 264 Dress Accessories 1365 171 Yiolet brooches (drawings 1:1, photograph 2:1) (?)flower bud
296 (37) 268 Dress Accessońes Brooches with circular frames Leaf 1374 BC72 2037 (83) 11 fig 174 Poss
298 (39) 270 Dress Accessories Table 5 Brooches - metals used 1 1 Copper i i 2 I I I -1-1—[— 1 1 1
więcej podobnych podstron