DSC07936 (2)
101
Vistula valley betioeen the outlets of Dunajec and Breń
6fn

-j—-1-1---- i 1 i-1-1-1-1-1 -r ■(
1870 1900 *930 *9*0 yaars
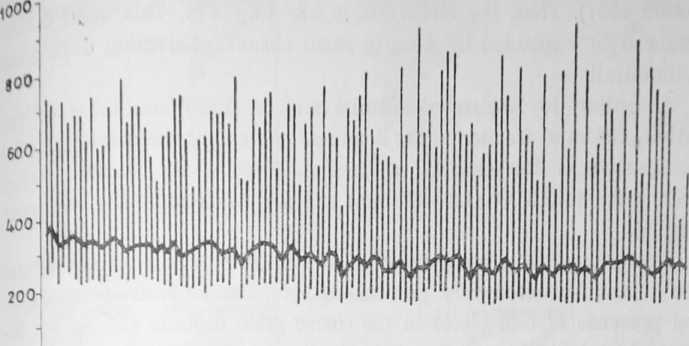
Fig. 5. Graph showing maximal, minimal and mean water levels at Szczucin gaug-ing station in the years 1871—1978
of the above process. This process practically does not occur in the stu-died section when taking into account the profile in Szczucin (Fig. 5). Its ratę is smali, 0.9 cm/yr in the period of 1946—1975 according to Klimek’s (1983) calculations. Similarly, the channel deepening is not registered at the water gauge profiles upstream the Dunajec mouth (Punzet 1981). However, the channel incision of the order of 0.31—

□ 1 V2 73 Ki. OS «6
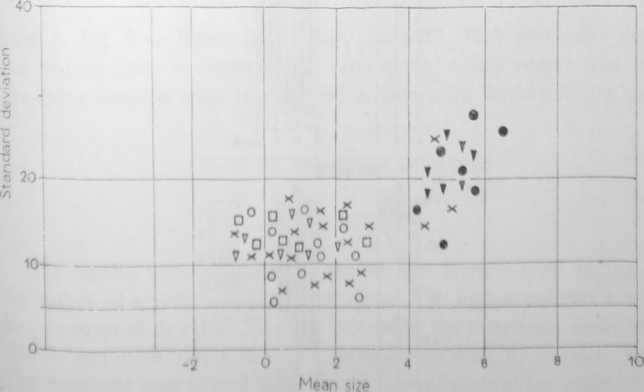
Fig. 6. Scatter plot of mean grain size (Mz) versus standard deviation (<$i)
" s**nds and sands wlth graVels of middle terrace; 2 — sands and saaiids włth gravel«: 1 ■'endzina terrace; 3 — muds of rendzina terrace; 4 — flood plaln deposits; 5 — prezent channel deposits; I — oxbows deposits
Wyszukiwarka
Podobne podstrony:
DSC07934 (2) 90 Yistula ralley betioeen the outlets of Dunajec and Breń Fig. 3. Maximal and minimal
DSC07940 (2) 105 Vistula valley betiueen the outlets of Dunajec and Breń cular bends. Actual depress
DSC07946 (2) 111 Vistula valley between the outlets of Dunajec and Breń The Vistula river preserved
DSC07944 (2) 109 Yistula valley between the outlets oj Dunajec and Breń the sand-gravel deposits of
DSC07942 (2) 107 Vistula ralley between the outlets of Dunajec and Breń xizontaiły laminated. The sa
DSC07948 113 Vistula valley beticeen the ouilets of Dunajec and Bre* goci* ze w s k a - M u s i a ł
DSC07904 263 icree ods. The thickness of deposits is often between 5-1 Om (some 17
DSC07938 (2) 1 Vi stula vallev bettueen the outlots oj Dunajec and Bteń 103 -ePe-* the the aries Poo
1. Mathematics in Chemistry 1.1. Mathematics in chemistry Chemistry is the study of matter and the c
96 United Nations — Treaty Series 1972 CONYENTION1 BETWEEN THE KINGDOM OF GREECE AND THE REPUBL
284 United Nations — Treaty Series 1972 the Minister of Agriculture, the Minister of Finance, a
20 usually take place at the begirming of summer and at the beginning of winter. Periodical seininom
Institute of Control and Industrial Electronics <& w n The history of the Institute of Contro
więcej podobnych podstron