3360446720
a)

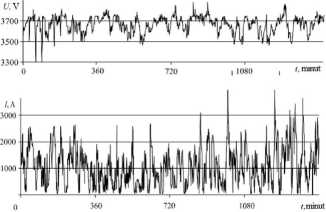
Fig. 1 - Time dcpendcnces of rectified feeder voltage (a) and current (b)
||ał.(t = 0) + /h5Jx yx[^/(T = 0) + m/2]
According to this theory, autocorrelation function of voltage u(t), as a stationary ergodic random process, it is possible to write down as the expectation of scalar work of the centring random
function U(t) and it’s shifted for the interval of correlation T of the copy U(t + T):
*r„(i)=M^(()-u(t+T)j= (2)
where mv - expectation of stationary random function ofvoltage U(t) (constant).
Similarly, the autocorrelation function E,(t) of random function of current E, (t) is:
*,(r)=jWp(/)./(!+r)]= (3)
where rttj - expectation of stationaiy random function ofvoltage /(/) (constant).
For stationaiy' random processes in very wide terms [2], the unbiased estimate of expectation / [X(/)] of any stationary function X(/) is proved to be its mean value by time x of realization by the duration T of the function .¥(/), that’s
- 1 7
Then, in accordance with (4), expressions (2) and (3) for correlation functions can be written as:
Ku(x) = j\\U(t)-mu\p(t+x)-mu}it =
1 T . T
-—|f/(r) ■mudt -—J(/(r+t) mvdt + ml, Similarly,
1 T
, T . T
-—J7(f) m,dt -—J/(f+t) m,dt + m). (6)
The autocorrelation function determines the law, characteristic of only one process (u(t) or ’(/)) and is used to fmd effective values of sizes. Indeed, at T = 0 expressions (5) and (6) are:
Kv (I = 0) J )/! (O - ml ]= U’ - ml. (7)
K, (t = 0) = i j [/' (() - ml ]= /' - mi. (8)
where U and I - effective values of voltage and current, found with temporary realizations with the duration Ó.
Taking into account (7) and (8), total power is determined by autocorrelation function as
(9)
POJAZDY SZYNOWE NR 3/2011
14
Wyszukiwarka
Podobne podstrony:
PROGRAM ROZWOJOWY^1 POLITECHNIKI WARSZAWSKIEJ Fig. 1.15. Instantaneous value of voltage and current
PROGRAM ROZWOJOWY^1 POLITECHNIKI WARSZAWSKIEJ Fig. 1.15. Instantaneous value of voltage and current
Fig 3. Superior view of the sellar region and its related bonę struć-tures. The arrow indicates the
50 Rys. 5.6. Przebieg w czasie maksymalnych wartości intensywności odkształceń Fig. 5.6. Time variat
Slajd33 2 Akademia medycyny i pięknaElektroporacja Fig. 3. Effect of pulse voltage and time on fenta
Fig. 1. Application areas of Work Study, Methods - Time Measurement and Management Engineering actio
Slajd69 Bielactwo - odbarwianie Fig. 3.11 -2Resłdualpatches of pigmentation(a)and (b) finał results
00235 Nff6c37df02571c6249b1ae331f002f 237 Applications of the EWMA Box, G. E. P., and Jenkins, G. M
00352 Y81713c432e612628e0c1a55ba8c097 356 Prairie & Zimmer Let Ed be the number of defective un
f Fig. 12 Lifting and carrying meat and boxes is frequent. Manuał lifting of 75 kg ocajrs and one ma
288 Z. KORUBA ET AL. Fig. 4. (a) Time-dependent profile of the terrain unevenness (bump); (b) time-d
więcej podobnych podstron