3513659318
149
B Normoxia Hypoxia
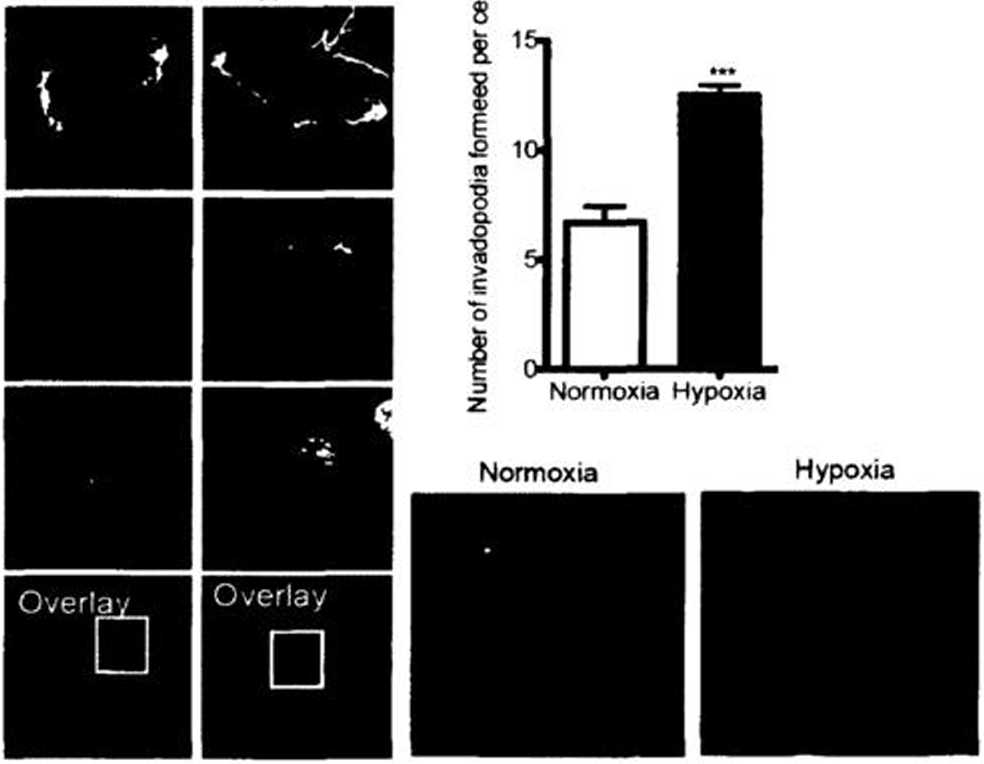
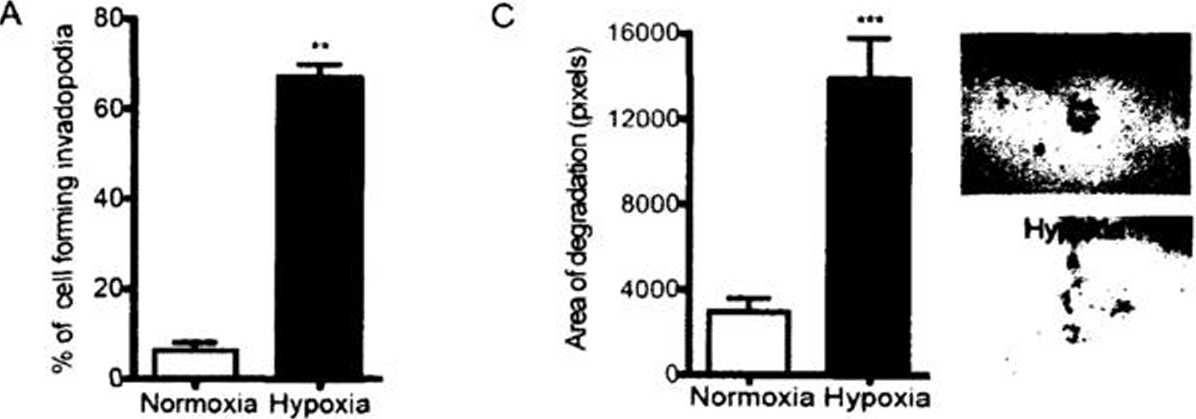
Figurę (Chapitre 3) 1: Hypoxia promotes invadopodia formation
HT-1080 cells were cultured on FiTC-gelatin-coated slides in normoxia or hypoxia for 4 h (B) or 10 h (A,C). (A) Percentage of cells forming invadopodia. (B) Micrographs of actin (green), cortactin (red) nucleus (blue) and merged images are shown. The associated graph shows the number of F-actin-positive and cortactin-positive invadopodia per celi as described under Materials and Methods. (C) Quantification of ECM degradation (area/cell). The associated micrographs show representative ECM degradation area for a single celi. Columns correspond to the mcan ± SEM; ** p < 0.01, *** p < 0.001; scalę bars correspond to 5 pm.
We have previously reported that hypoxia induced an increase in pro-TGFp maturation through up-regulation of the proprotein convertase furin [2]. In addition, TGFP
Wyszukiwarka
Podobne podstrony:
Figurę 1. Viral replication rates of VSV G mutants. L929 cells were infected at an MOI of (A) 0.1 or
94Figurę (Chapitre 1)3. Furin internalization in hypoxic cells involves both clathrin and lipid raft
Figurę (Chapitre 1) : IIypoxia (riggers furin relocalization lo the basal plasma membranę HT- 1080-e
schemat frontow2 FIGURĘ 15.4 Stages in the formation and eventual dissipation of an occluded (ront.
pg 149 Hkl i * Mat Ciężar ~ p netto UtC Model Skala Format A 5 Centralne Biuro Konstrukcyjne M
Figurę 2. Effect of VSV G mutants on cellular transcription rates. L929 cells were infected at an MO
Figurę 3. Effect of VSV G mutants on cellular protein synthesis rates. L929 cells were infected at a
Figurę 4. Interferon induction by VSV G mutants. L929 cells were mfected at an MOI of (A) 0.1, (B) 2
Figurę 6. Caspase activation by VSV G mutants. (A) L929 and (B) B16 cells were infected at an MOI of
Figurę 6: Expression of PD-1 and PD-L1 on BI6gp33 cells following VSV infection. B16gp33 cells were
Figurę 7: Expression of MHC-I on B16gp33 cells following VSV infection. (a) B16gp33 cells were infec
Supplemental Figurę 2. MDSC proportions following CVF treatment. B16-beanng mice were treated or not
Mother celi.DevelopingSPORE FIGURĘ 9.07 Outline of Spore Formation Regulatory Cascade A cascade
104 Figures supplementaires: Figurę supplementaire (Chapitre 1)1: Hypoxia induces the relocalization
95 normoxic or hypoxic cells. These observations suggested that the Rab 4 recycling pathway was invo
Slajd17 (121) Niedotlenowanie komórek nowotworowych Necrotic celis Acutely hypoxic cells
14 ANDRZEJ JAKUBIK [8] Truszczyński, O., Terelak, J.F. (1996). The influence of altitude hypoxia on
więcej podobnych podstron