6781096810
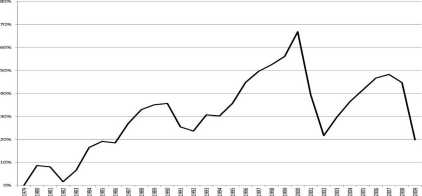
Figurę 4: Implied Changes In Domestic Airline Demand Over Time
years. Yet, the industry madę money in only 8 of those years and overall lost $2.6 bil-lion in net present value over this period. The economic downturns during this period certainly affected airline industry profits, but we wouldn’t expect investors to believe that demand growth would be completely constant and steady. It is hard to see how unantici-pated demand shocks during this time could be a credible explanation for the overall poor performance.
Demand shocks are a morę plausible explanation for the losses of the 2000s. The post-9/11 demand drop, which was about 27% from 2000 to 2002, was unprecedented. By 2007, demand was still substantially lower than it had been in 2000. Because of the fixed Capital costs and sticky labor costs, the decade of depressed demand was accompanied by a decade of depressed prices. In real terms yields were 33% lower in 2009 than in 2000 despite the fact that jet fuel prices were about $0.59 per galion (52%) higher, which, based on 2009 revenue passenger-miles per galion of fuel, raised overall costs by about 9%.
The other notable change in domestic service over this period was the increase in average passenger load factor from 71% in 2000 to 81% in 2009. This was a continuation of the very steady increase in the 1990s from about 60% in 1990 (and most of the 1980s). The increases are mostly independent of demand shocks, rising or holding constant in every year except a 2% downward tick after September 11, which was completely reversed by 2003. Increased fuel costs would make higher load factors morę economic, but there is no evidence that the load factor increases have been greater during periods of rising than periods of falling fuel costs. Morę likely, load factor increases have been a result of improving yield management technologies.
yield and
-1, figurę 4 tracks A over time.
Wyszukiwarka
Podobne podstrony:
Production Systems expectations evolved with changes in consciousness of clients and their awareness
is the result of human induced changes in landscape of Tuchola Pinewoods in the last 200 years. The
101 Changes in chemism of the Łabuńka river.. the Topornica (Fig. 1), water samples for laboratory a
111 Changes in chemism of the Łabuńka river.. they contain fewer Ca2+ions and are characterized by t
113 Changes in chemism of the Łabuńka river.. catchment. Calculations madę by H. Maruszczak (1990) f
115 Changes in chemism of the Łabuńka r.iver.. 6. From comparison of indices deter
img018 from ilir supiłorl surface or to ncgotiate changes in inclination of the support Surface; mus
» V LISTĘ DES FIGURES Figurę 2.1 Energy fluxes in PSII of six algal and three cyanobacteria species
Figurę 6: Domestic Market Share of Low-Cost Carriers from this figurę. First, LCCs in aggregate have
demand over the next several decades. Energy security issues, climate change, fossil fuel depletion,
55 (174) 5: Deep mycoses Figurę 5:9: Perinasal ulcer in a domestic short hair cal with cryptococcosi
Figurę 2: Estimation of constants mt/nij and s The parameters mi/mj and i are related to changes in
1A5(1) Figurę 1Ł8. In (a) *. = O for 4G. We can change *, in iwo w*ys: (b) if wetihlhe ipf n— Uwoogh
więcej podobnych podstron