869568998
according to the recommendations of the manufacturer. Then, the sample was centrifuged (5 min at 540g), the celi pellet was washed with 2 ml of phosphate buffer salinę (PBS; pH = 7.4) containing 0.5% (w/v) bovine serum albumin (BSA; SIGMA-ALDRICH, St Louis, MO, USA) and 0.09% of sodium azide (NaN3; SIGMA-ALDRICH), centrifuged again under the same conditions and finally resuspended in 250 pi of PBS with 0.5% BSA+ 0.09% NaN3, and measured in the flow cytometer at a 'Iow' flow ratę modę within the first hour after sample preparation. PMT voltages were adjusted so that forward scatter (FSQ/sideward scatter (SSQ-gated lymphocyte singlets reached mean SSC and FSC values of 55 000 ± 5000 and 13 000 ± 2000, respectively.
visit, PMT settings were adjusted as described above and a new compensation experiment was performed as described in Section 3 of this manuscript.
MFI values of the brightest Rainbow bead peak were daily reported for each individual flow cytometer. As the scaling of axes is different on FACSCanto II and LSR II (262144 channels) as compared to CyAn ADP (4096 channels), the Rainbow beads

EuroFlow instrument settings
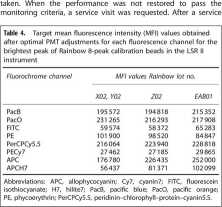
Finał PMT voltages for each fluorescence channel were set for each instrument to reach target MFI values using the brightest peak of Rainbow 8-peak beads of the same lot. Subsequent rainbow bead lots were assigned new target MFI values by cross-calibration using the previous lot for an instrument in a single laboratory (DPFI/O, Prague, Czech Republic) (Table 4, see also www.euroflow.org for the updated target MFI of other Rainbow bead lots). In turn, light scatter settings were placed as described above. Inclusion of the FSC-H parameter will allow discrimination of doublets in a FSC-Area (FSC-A) versus FSC-Height (FSC-H) bivariate plot, contributing further to the accuracy of the results.34 The finał instrument settings for both light scatter and fluorescence-associated PMT voltages are further referred as EuroFlow settings. The detailed EuroFlow SOP for instrument setup is available at the EuroFlow website (www.euroflow.org).
Monitoring of instrument performance Monitoring of instrument performance was done daily (at each cold start) after laser stabilization was allowed for 30 min. Rainbow 8-peak beads were acquired under EuroFlow settings (under 'disabled compensation' conditions) and the MFI of the brightest peak in each fluorescence channel was compared with the corresponding target MFI value. The following criteria had to be reached for the instrument to pass the check: (i) MFI values within the target MFI ± 15%, and (ii) coefficient of variation (CV) of the brightest peak <4% for the blue and violet laser channels, but <6% for the red laser channels and the PECy7 channel. Whenever instrument performance failed, measures such as thorough cleaning, de-gassing flow celi and laser delay verification were
102 103 10"
fluorescence intensity

102 1Q3 1Q4 105

Median fluorescence channel
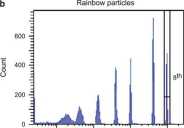
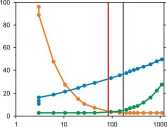
Figurę 1. Comparison of cytometer setting & tracking (CS&T) module and EuroFlow baseline settings obtained for the fluorescein isothiocyanate (FITC) channel (blue laser linę) in one representative instrument. CS&T (mid-fluorescence peak in a) and EuroFlow (Rainbow beads brightest, eighth peak in b) baseline settings are compared in c (gray and red vertical lines, respectively) for the robust coefficient of variation (CV) and robust electronic noise (SDEn). Notę that although EuroFlow settings used lower PMT voltages, the robust CV values (orange linę) and robust SDen values (green linę) are still in their plateau phases.
Wyszukiwarka
Podobne podstrony:
00227 fa893f5d70e2a8634abfc718a817fdc 229Applications of the EWMA is scaled according to the percen
172 Aneta Wszelaki DIFFERENCES IN THE PREPARATION OF THE FINANCIAL STATEMENTS OF THE BANK ACCORDING
18 Małgorzata Bednarczyk, Ewa Wszendybył-Skulska According to the model presented in Figurę 2, the e
20 Paweł Antonowicz the effective CRM system must play various different functions. According to the
MODERNIZATION AND EXTENSION OF THE DAIRY FARM ACCORDING TO THE EUROPEAN STANDARDS Project initiato
RECONSTRACTION OF THE PIG COMPLEX ACCORDING TO THE EUROPEAN STANDARDS Project initiator Privately
Department and Clinic of Surgery Decreasing the number of Department was inforced according to the s
Comparison of Liąuid Propellant Rocket Engine Feed Systems - 1 - 11 According to the previously expo
We search 1000’s of College Textbook Sellers We all knov/ that college is expensive. In fact, accord
ENGINE OVERHAULAssembly (Cont d) 2. Select suitable thickness of main bearing according to the follo
82 T. Wróbel Abstract The inductor-type alternatora are classified according to the rangę of freąuen
1 4 (3) According to the authorities in the field of negotiations from Harvard University, Roger Fis
172 Aneta Wszelaki DIFFERENCES IN THE PREPARATION OF THE FINANCIAL STATEMENTS OF THE BANK ACCORDING
per cent of the hijras living in India today have undergone genital surgery - according to the 1990
eilftPTER II 15 86230 Th# eęonoay appeared to perfora accordlng to the theorles of Keyaes. the expan
więcej podobnych podstron