
Control of auditory distance perception based
on the auditory parallax model
Hae-Young Kim *, YoÃiti Suzuki, Shouichi Takane, Toshio Sone
Research Institute of Electrical Communication and Graduate School of Information Sciences,
Tohoku University, 2-1-1 Katahira, Aoba-ku, Sendai 980-8577, Japan
Received 27 November 1999; received in revised form 17 February 2000; accepted 21 March 2000
Abstract
Simulation of the distance of a sound image within 2 m from a listener, in the absence of re¯ec-
tions and a loudness cue, was investigated. To do this, a model named the ``auditory parallax
model'', which focuses on the role of parallax angle information involved in head-related transfer
functions (HRTFs), was examined with psychoacoustical experiments. For purposes of com-
parison, experiments were also done on an actual sound source, sound with digitally synthe-
sized HRTFs, and sound with the interaural time dierence (ITD) and interaural level
dierence (ILD) synthesized by the Hirsch±Tahara model. The perceived distance of a sound
image by the actual sound source monotonically increased with the physical distance of the
source up to 1±1.5 m without any cues of sound pressure level and re¯ections from walls. The
perceived distance of a sound image simulated with the auditory parallax model and that with
synthesized HRTFs showed tendencies very similar to those with the actual sound source. On the
other hand, for a sound image produced by the Hirsch±Tahara model, the perceived distance of
the sound image increased up to around 40 cm and then became saturated. These results show
that simple synthesis of the ITD and ILD as a function of distance is insucient to explain auditory
distance perception. However, the results of the experiment in which HRTFs were simulated
based on the auditory parallax model showed that the cues provided by the new model were
almost sucient to control the perception of auditory distance from an actual sound source
located within about 2 m. Possible reasons for the good performance of the auditory parallax
Applied Acoustics 62 (2001) 245±270
www.elsevier.com/locate/apacoust
0003-682X/01/$ - see front matter # 2001 Elsevier Science Ltd. All rights reserved.
PII: S0003-682X(00)00023-2
* Corresponding author at current address: Akita Prefectural University, Faculty of Systems Science
and Technology, Department of Electronics and Information Systems, 84-4 Ebinokuch, Tsuchiya, Honjo,
015-0055 Japan. Tel.: +81-184-27-2120; fax: +81-184-27-2187.
E-mail address: young@akita-pu.ac.jp (H.-Y. Kim).

model are the resemblance between the relative frequency characteristics (shape) as well as the
shape of ILD as a function of frequency simulated by the auditory parallax model and those
of the actual HRTFs. # 2001 Elsevier Science Ltd. All rights reserved.
Keywords: Sound localization; Auditory distance perception; Modeling of sound image; Sound image
control; Auditory parallax
1. Introduction
The direction of a sound source yields very important information at a listener's
eardrum for the perception of the location of the sound source. Therefore, the
notion of head-related transfer function (HRTF), which represents the transfer
characteristics of a sound path from a sound source in a free ®eld to the listener's
external ear, has been introduced [1]. HRTF is generally important when consider-
ing sound localization because it is useful for expressing sound pressure at the liste-
ner's eardrum over the whole frequency range in question. Moreover, the interaural
dierence in HRTFs is also important since it involves the ITD (interaural time
dierence) and the ILD (interaural level dierence) collectively as a function of fre-
quency. The sound localization on the horizontal plane is primarily related to the
interaural dierence of HRTFs [2±4], while some spectral features of the HRTFs
(spectral cues) play some role in determination of azimuthal localization [5]. In the
median plane localization, spectral cues seem to play an important role, and many
studies have been done to elucidate the role of such spectral cues [6±11].
As compared with the auditory perception of direction, however, auditory dis-
tance perception has not been suciently investigated. Most of the earlier investi-
gations have focused on distance perception under anechoic conditions [12±16].
Distance perception under reverberant conditions has also been investigated by
some researchers [16±19]. Reviews of the literature can be found in references [1,20].
According to those investigations, distance perception is in¯uenced by many factors
such as loudness [21-23], binaural dierence [12], the ratio of early re¯ections from
the room surface to direct sound [6,17,24], and the decay of high frequency compo-
nents by air absorption [25]. In the absence of re¯ections, the change in loudness as a
function of distance (loudness cue) plays an important role in the auditory distance
perception [22,26]. With re¯ections, it is known that the greater the ratio of re¯ec-
tion to direct sound, the farther the perceived distance. Furthermore, the perceived
distance also depends on the familiarity of sound, e.g. a whisper is localized very
close to a listener and shouting is localized farther than a voice at a normal level of
loudness if they are equally loud [14].
There have been several studies on distance perception in the absence of re¯ections
and loudness cue [22, 26±28]. The perceived distance of a sound image increases when
the actual distance increases to around 1±3 m and then the perceived distance
becomes saturated. Haustein [22], Nielsen [26], von BeÂkeÂsy [27], and Sone et al. [28]
have reported that it becomes saturated at 2±3, 1±2, 1±2 and 1.2±1.5 m, respectively.
This phenomenon of the existence of an upper limit in how far an auditory perceived
distance can be, was termed ``acoustical horizon'' by von BeÂkeÂsy [27]. Morimoto
246
H.-Y. Kim et al. / 62 (2001) 245±270

showed that HRTF systematically changes as a function of distance up to around 1
m [29]. This indicates that the change in the HRTF and its interaural dierence as a
function of distance may be used as a perceptual cue for auditory distance perception.
In the present study, we focused on the role of the HRTF as well as its interaural dif-
ference in controlling distance perception. To do this, we conducted experiments in
the absence of re¯ections and the loudness cue because, in this condition, the HRTF
may be the only possible source of physical perceptual cues for distance perception.
To examine the eectiveness of the HRTF and its interaural dierence in con-
trolling auditory distance perception for a sound source up to 2 m, four experiments
were conducted. The ®rst experiment was concerned with the perceived distance for
an actual small sound source. In the second one, the HRTF was synthesized as
precisely as possible. In the third experiment, the HRTF was modeled so as to have
only simple ITD and ILD cues as proposed by Hirsch [30] and Tahara [31]. In that
model, the ITD and ILD are constant over the whole frequency range and are calcu-
lated by the dierence between the two distances from a sound source to the listener's
two ears. In the last experiment, HRTFs for the listener's two ears were modeled so
that only the information due to the auditory parallax angle [42,43] could be realized.
2. HRTF and its synthesis
2.1. Description of HRTF
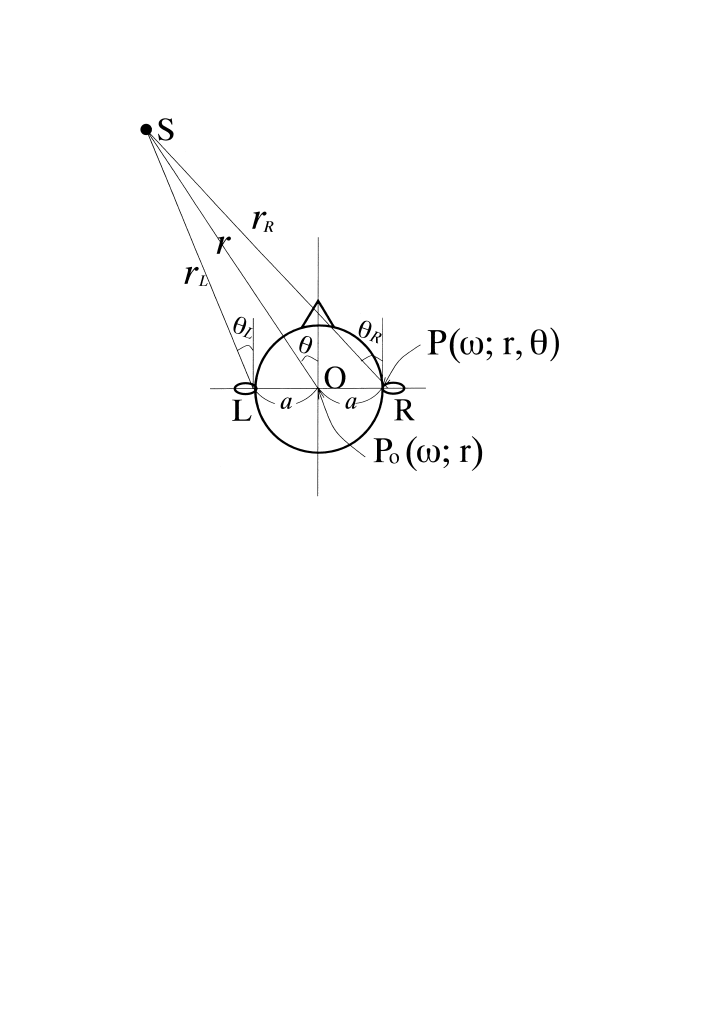
The geometric con®guration between a sound source and the left and right ears of
a listener is shown in Fig. 1. As indicated in that ®gure, the distance from the sound
source to the midpoint of the listener's head is denoted as r, the distances from the
sound source to both ears are r
L
and r
R
, respectively, and the azimuthal angles from
both ears to the sound source are
L
and
R
, where the suxed L and R indicate the
left and the right ears, respectively. The sound pressure at a point corresponding to
the center of the head while the subject is absent, is expressed as P
0
t; r. The sound
pressure at the listener's ear canal is expressed as P t; r; . Their Fourier transforms
are shown as P
0
!; r and P !; r; . The HRTF, H !; r; , de®ned by Blauert [1] is
expressed as follows:
H !; r;
P !; r;
P
0
!; r
:
1
In order to simplify the explanation of the auditory parallax model in a later sec-
tion, the HRTFs corresponding to both ears, H
L
!; r; and H
R
!; r; , are
expressed with the points of both ears as a reference. Hence, H
L
!; r; and
H
R
!; r; are rewritten as G
L
and G
R
, which are expressed as follows:
G
L
!; r
L
;
L
H
L
!; r; ;
2
G
R
!; r
R
;
R
H
R
!; r; :
3
H.-Y. Kim et al. / 62 (2001) 245±270
247
2.2. Method to synthesize HRTFs using two loudspeakers
Since the HRTF involves comprehensive information on sound localization, it is
quite natural to consider that the localization of a sound source can be controlled by
simulating HRTFs. Schroeder et al. [32] developed the basic theory for simulating
HRTFs and Ando et al. [33] generalized Schroeder's theory. Blauert et al. [34]
approximated this method by use of analogue ®lters and headphones. Morimoto et
al. [35] realized this method by using a digital signal processing technique and con-
ducted some psychoacoustical experiments. They reported that the listener could
localize a sound image synthesized by simulated HRTFs.
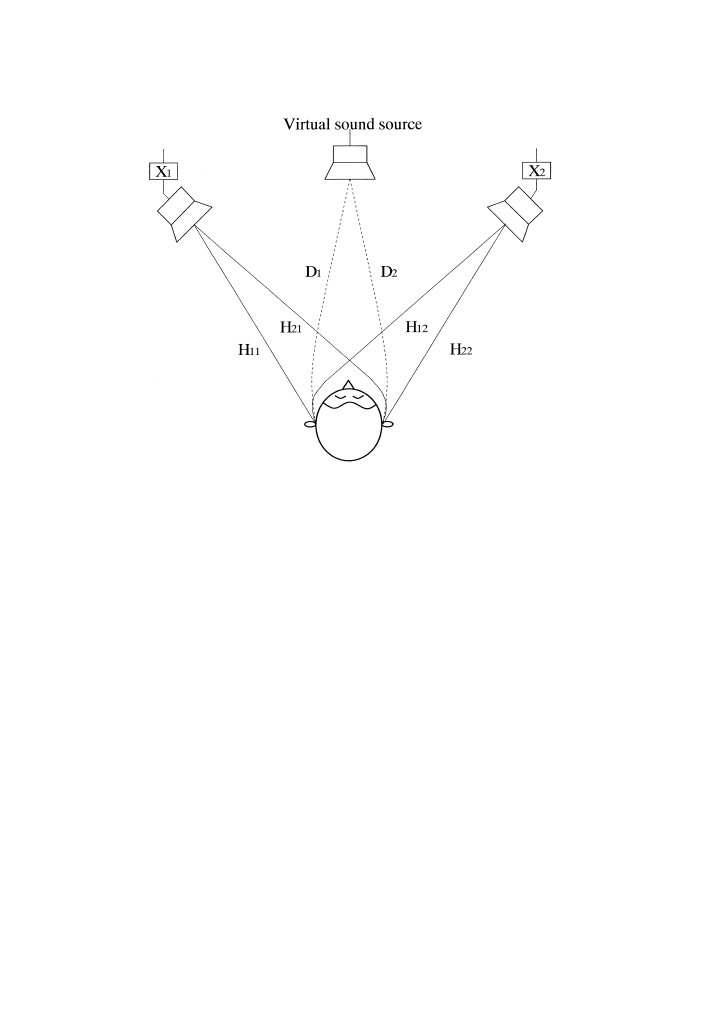
A schematic diagram of the present method is shown in Fig. 2. The transfer
functions for paths from an electric input terminal of a virtual sound source to the
output terminal of microphones at a listener's eardrums of the right and the left ears
are denoted by D
1
! and D
2
!, respectively. The transfer functions for the four
paths from the electric input terminals of two loudspeakers to the output terminals
of microphones located at the listener's right and left eardrums are indicated by
H
11
!, H
12
!, H
21
! and H
22
!, as shown in the ®gure. To reproduce the sound
pressures at the listener's eardrums as those produced by the virtual sound source
using the two loudspeakers, ®lters X
1
! and X
2
! connected with the electric input
to each loudspeaker are given by the following equation:
Fig. 1. Geometric relationship between the sound source and the left and right ears.
248
H.-Y. Kim et al. / 62 (2001) 245±270
H
11
! H
12
!
H
21
! H
22
!
X
1
!
X
2
!
D
1
!
D
2
!
:
4
In practice, the two transfer functions, D
1
and D
2
are synthesized by the time-
domain deconvolution technique [36]. Eq. (4) is transformed into the time-domain
as the following equation:
HX D
5
With, H, X and D being expressed as follows:
H h
11
h
12
h
21
h
22
; X x
1
!
x
2
!
; D d
1
d
2
:
6
Here, h
ij
is the matrix consisting of the impulse response between the sound source
j and the control point i, i.e.
h
ij
h
ij
0
0
...
..
.
h
ij
M ÿ 1
h
ij
0
..
.
...
0
h
ij
M ÿ 1
2
6
6
6
6
6
6
4
3
7
7
7
7
7
7
5
:
7
Fig. 2. Block diagram for HRTF simulation using two loudspeakers.
H.-Y. Kim et al. / 62 (2001) 245±270
249

Moreover, x
j
is the ®lter coecient connected to the jth loudspeaker and is
expressed as
x
j
x
j
0 . . . x
j
L ÿ 1
T
h
i
:
8
d
i
is the desired impulse response at point i, that is
d
i
d
i
0 d
i
N ÿ 1
T
;
9
and L, M and N are the lengths of samples of the corresponding impulse responses,
respectively. The ®lter coecients are determined by Eq. (6). Usually, there are more
equations than the unknowns, i.e. this system is overdetermined. An overdetermined
system has no exact solution except for the case when the vector D is an element of
range H. Thus, we strove to minimize HX ÿ D
k
k
2
to solve this equation. The least-
square-error solution X
LS
is then obtained by the following equation:
X
LS
H
T
D
H
T
H
:
10
X
LS
is the solution which minimizes residual energy at each control point.
3. Modeling of head-related transfer function to control distance perception
3.1. Hirsch±Tahara model
A simple model to control the distance perception for a sound source placed in a
free ®eld is given by Hirsch [30]. The model is based on the level and time dierences
between two ear signals caused by the dierence of the distances from a sound
source to the listener's two ears. Tahara proposed a model very similar to Hirsch's
model [31]. His model is based on the assumption that the distance perception is
based on the simultaneity of the changes of the interaural time dierence and the
interaural level dierence as a function of distance as well as azimuthal angle. This
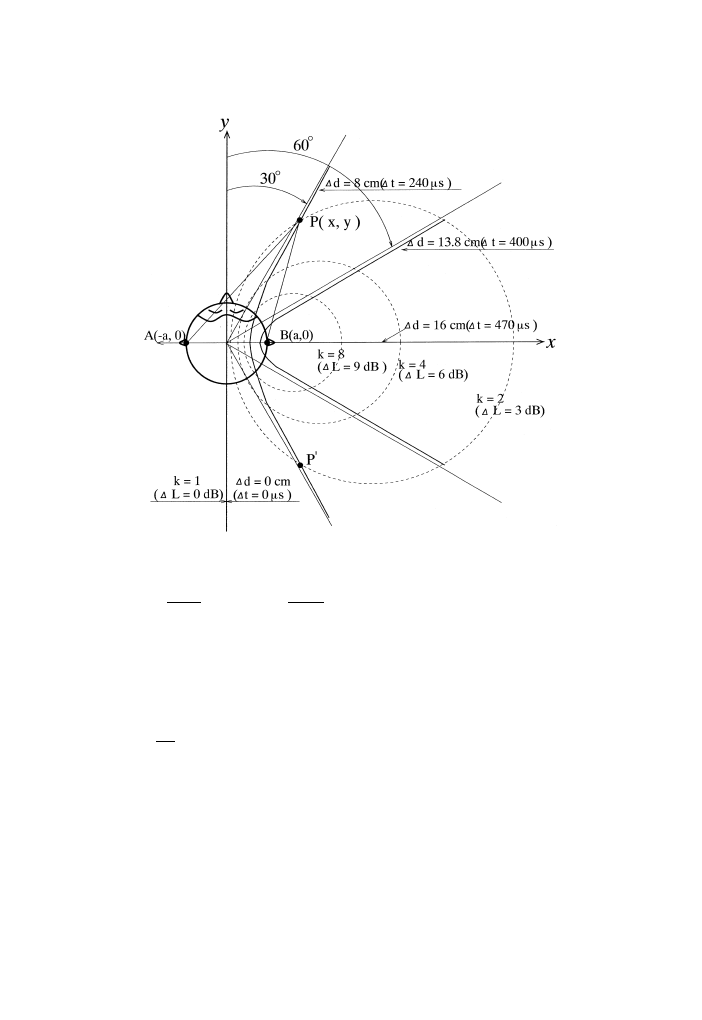
model is referred to as the ``Hirsch±Tahara model'' in this paper. The relationship of
interaural time dierence and interaural level dierence for a sound image is shown
in Fig. 3. This model assumes that the location of both ears, A ÿa; 0 and B a; 0,
and the location of a sound source, P x; y, are on the horizontal plane. If the
acoustical in¯uence of a head is neglected, the loci of point P x; y > 0 at which the
distance dierence d PA ÿ PB between both ears and the square ratio of dis-
tance k PA
2
=PB
2
are constant, are described by the hyperbolic function of Eq.
(11) and the circular function of Eq. (12), respectively.
x
2
ÿ
d
2
2a d 2a ÿ d
y
2
d
2
2
"
#
;
11
250
H.-Y. Kim et al. / 62 (2001) 245±270
x ÿ
k 1
k ÿ 1
a
2
y
2
2
ka
p
k ÿ 1
!
2
2
4
3
5:
12
Therefore, d and k can be determined, if P x; y is given. Then the interaural
time dierence t and interaural level dierence L can be calculated using Eqs.
(13) and (14), respectively.
t
d
c
;
13
L 10 log
10
k
;
14
where c is the velocity of sound.
Therefore, if a listener uses t and L as cues for distance perception, a sound
image is perceived at the crossover of the loci of Eqs. (11) and (12). On the contrary,
if this model were valid, subjects perceive a sound image at either location of P or P
0
when speci®c t and L are given. The loci of t and L are actually much more
complicated than described in the above discussion due to the eect of head and
Fig. 3. Relation of interaural time dierence and level dierence of the sound shown by Tahara [31].
H.-Y. Kim et al. / 62 (2001) 245±270
251
pinnae. In this paper, however, we examine whether the overall tendency in t and
L might be explained by the loci in Fig. 3. It should be noted that this model
cannot explain whether a sound source is in front of or behind the listener because
the eect of head and pinnae is disregarded.
3.2. Auditory parallax model
The HRTFs depend on the sound source direction and the distance of the sound
source [20,29,37±41]. Distance localization is concerned with the directional dier-
ence from both ears to the sound source, since the characteristics of HRTFs mainly
depend on the direction of the sound source. For the purpose of modeling, we focus
on the directional component of the HRTF and ignore the dependence on the dis-
tance. From this point of view, another model of simulating HRTFs for distance
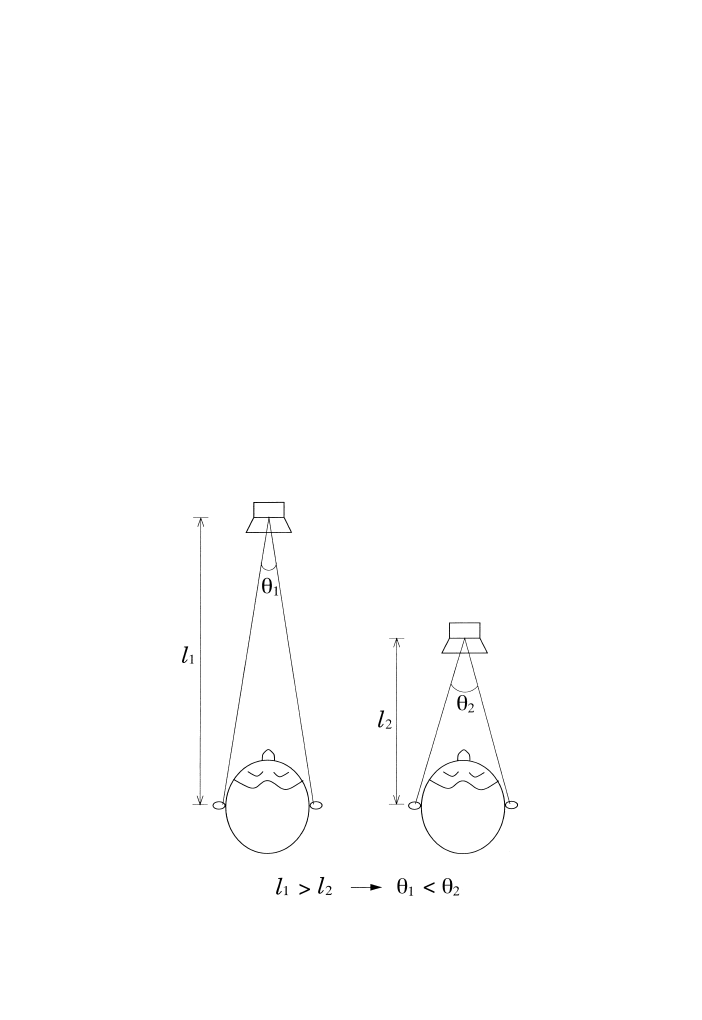
perception has been proposed [42,43]. This model is called the ``auditory parallax
model'' and is based on the assumption that the parallax angle calculated from the
dierence between the directions from the two ears to the sound source may be
eective in controlling the auditory distance perception (Fig. 4).
This model can be explained for the frontal incidence as follows. Suppose there
are two special virtual sound sources as shown in Fig. 5. Virtual sound source A
should realize a transfer function of a sound propagation path from a real sound
Fig. 4. Change of auditory parallax with sound source distance.
252
H.-Y. Kim et al. / 62 (2001) 245±270
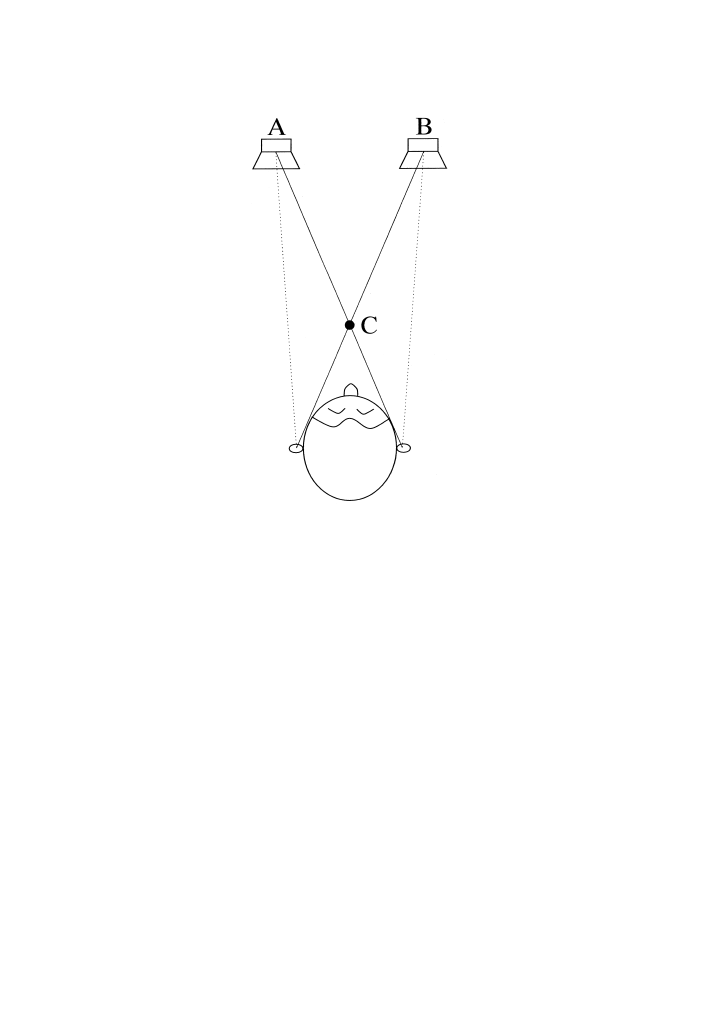
source at the position of A to the right ear (solid line), while for the left ear, a null
transfer function (dotted line) should be realized. Virtual sound source B should
realize a transfer function from a real sound source at the position of B to the left
ear, while for the right ear, a null transfer function should be realized. Under this
condition, it can be expected that a sound image can be perceived at the crosspoint
C if the parallax angle is eective in simulating the distance-dependent factors
involved in HRTFs. Such transfer functions are never realized by any real sound
image but may be virtually synthesized by using a digital signal processing technique
as described in detail below. It should be noted that this model cannot be applied to
the lateral directions (90
and 270
) because the directions from both ears to the
sound source are identical. The relationship between the sound source position and
the parallax angle are illustrated in Fig. 6. The azimuthal angles from both ears to
sound sources
L
and
R
are expressed by
L
tan
ÿ1
r
0
sin a=r
0
cos
;
15
R
tan
ÿ1
r
0
sin ÿ a=r
0
cos
;
16
where r
0
and are the distance and azimuthal angle from the midpoint of the head
to the sound source, respectively. The parallax angle is given as the dierence in
directions from both ears to the sound source, i.e. j
L
ÿ
R
j. The value
Fig. 5. Conceptual illustration of auditory parallax model.
H.-Y. Kim et al. / 62 (2001) 245±270
253
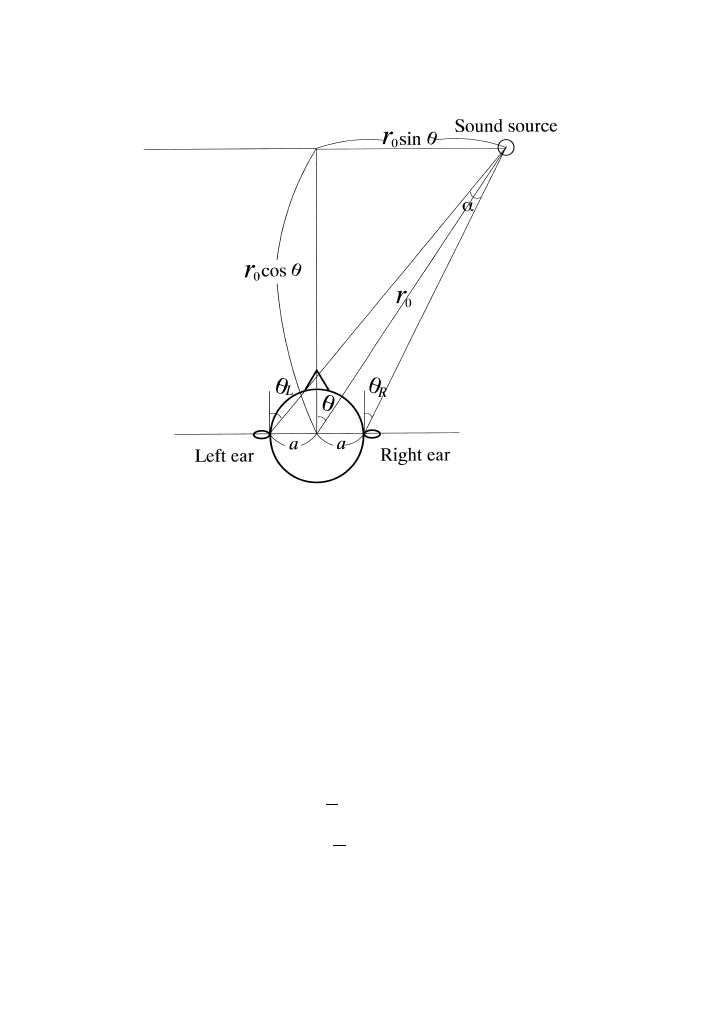
decreases as the sound source distance r
0
increases. The change of would yield
some perceivable changes in the dierence of directional information in HRTFs,
resulting in perceptual cues for the distance perception. In other words, it is assumed
that the sound image can be perceived at the crossing point of simulated HRTFs,
which are synthesized for the two ears independently.
Fig. 7 shows a schematic con®guration of a system for simulating the distance of a
sound image based on the auditory parallax model using two loudspeakers. The
HRTFs for two ears are expressed as G
L
!; r
L
;
L
and G
R
!; r
R
;
R
as stated in
Section 2.1, where the distances from both ears to the sound source are r
L
and r
R
.
The distance from virtual sound sources A and B to the midpoint of the listener's
head are r
oA
and r
oB
, respectively. If the phase delay due to the dierence between
the distances from the sound source to the center of the head and the ear is sepa-
rated from G, the HTRFs for the left and right ears can be expressed as Eqs. (17)
and (18), respectively.
G
L
!; r
L
;
L
G
0
L
!; r
L
;
L
e
ÿj!
r0B
c
;
17
G
R
!; r
R
;
R
G
0
R
!; r
R
;
R
e
ÿj!
r0A
c
:
18
When a sound image based on this auditory parallax model is synthesized, the
interaural time dierence is eliminated, i.e. G
0
L
and G
0
R
, rather than G
L
and G
R
, are
Fig. 6. Con®guration of the sound source and listener's ears.
254
H.-Y. Kim et al. / 62 (2001) 245±270
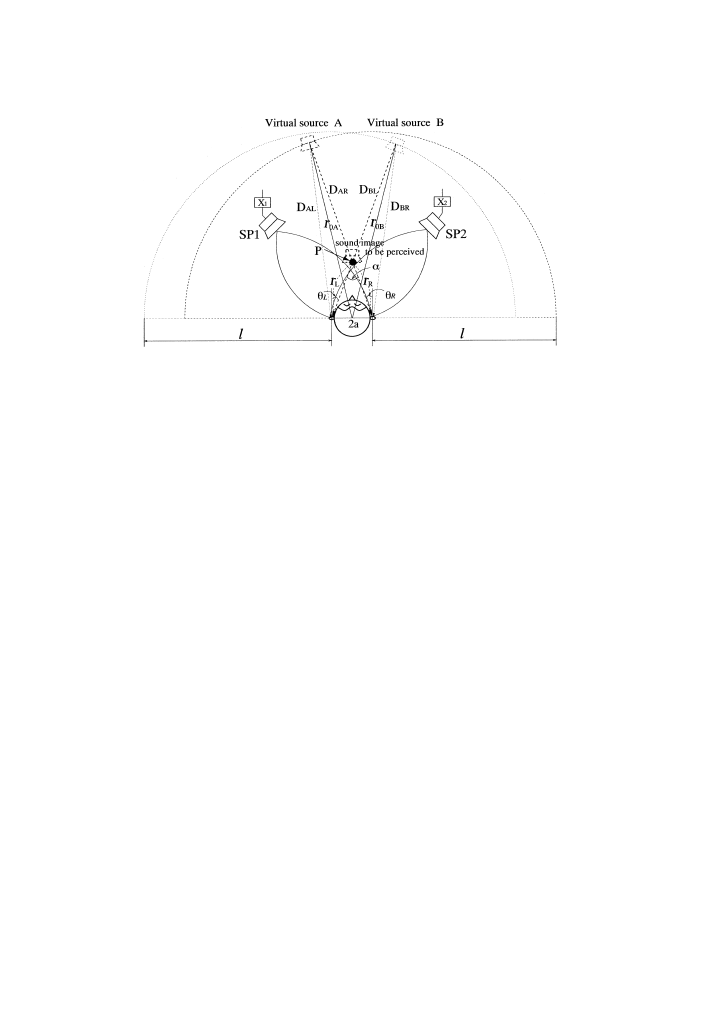
synthesized. In addition, in order to focus on the directional characteristics of
HRTF, both r
L
and r
R
are assumed to be l. That is, only directional information in
HRTFs are synthesized. The HRTF of the virtual sound source A for the listener's
right ear, D
AR
, and that of the virtual sound source B for the listener's left ear, D
BL
,
which are schematically shown by the dashed lines in Fig. 7, are described by Eqs.
(19) and (20), respectively.
D
AR
G
0
L
!; l;
L
;
19
D
BL
G
0
R
!; l;
R
:
20
On the other hand, D
AL
and D
BR
are set to be null transfer functions. In the pre-
sent study, in order to control the auditory distance perception based on this audi-
tory parallax model, the procedure for synthesizing HRTF using two loudspeakers,
described in Section 2.2, was applied; four transfer functions, D
AL
, D
AR
, D
BL
and
D
BR
, were synthesized by the time-domain deconvolution technique. It should be
noted that the sound sources A and B are not real but rather virtual ones which can
only be realized by digital signal processing. According to this model, a sound image
is expected to be localized at the point P where the line from the virtual sound
source A to the right ear and the line from the virtual sound source B to the left ear
cross. These four transfer functions, D
AR
, D
BL
, D
AL
and D
BR
, are synthesized with
digital ®lters X
1
and X
2
combined with loudspeakers SP
1
and SP
2
, respectively, as
shown in Fig. 2.
4. Subjective experiments on distance perception
Four psychoacoustical experiments on auditory distance perception were con-
ducted in this study. First, two experiments with an actual sound source and with a
Fig. 7. Schematic diagram of the simulation system based on the auditory parallax model.
H.-Y. Kim et al. / 62 (2001) 245±270
255
simulated sound source by use of digitally synthesized HRTFs were conducted to
con®rm the human ability of distance perception. Furthermore, two other experi-
ments were carried out to examine the validity and/or limitations of the Hirsch±
Tahara model and the auditory parallax model.
4.1. Common experimental conditions
In all the experiments, a subject was seated in an anechoic room (7.04.62.5 m)
with his head ®xed on a small headrest. The subjects who participated in the experi-
ments were four young males with normal hearing who had previously participated in
other localization experiments. Pink noise up to 20 kHz was used as the signal
sound. The sound pressure level at the location of the center of the subject's head
was always kept constant at 60 dBSPL. The subject judged the perceived distance of
an auditory sound image and reported it using a response sheet by marking a mark
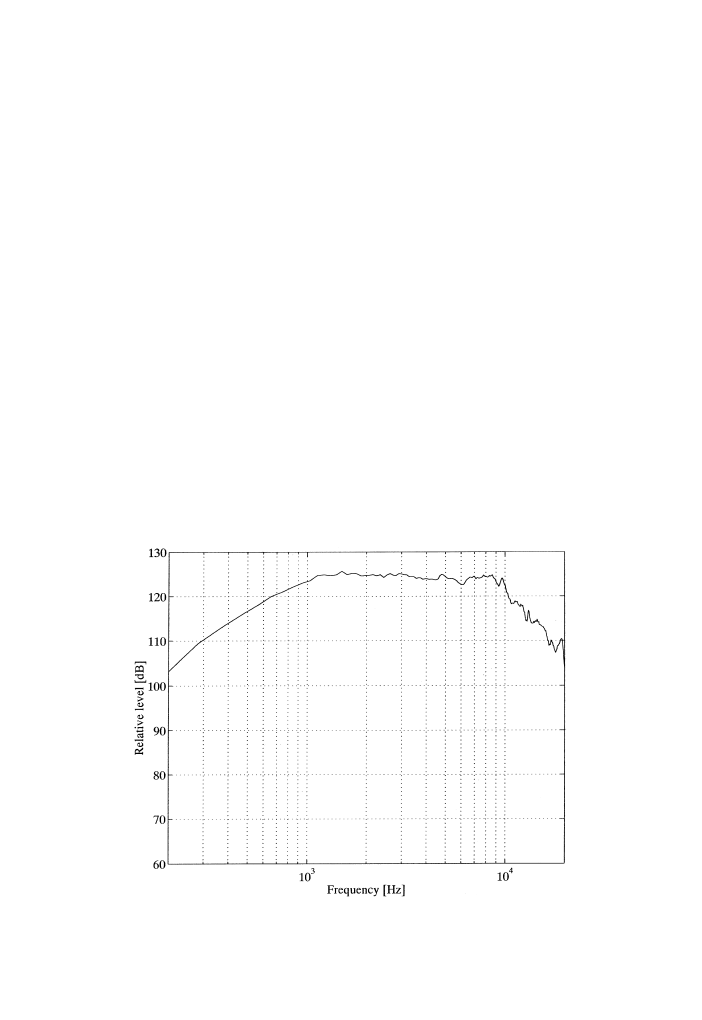
on a line corresponding to 0 cm to 5 m with 10-cm intervals. The frequency char-
acteristics of the loudspeaker is shown in Fig. 8. The stimulus for one experimental
condition was given six times to each subject and all the stimuli were presented in
random order.
4.2. Experiment on distance perception with an actual sound source (Exp. 1)
Auditory distance perception of an actual sound source was examined in the ®rst
experiment. A schematic diagram of this experiment is shown in Fig. 9. The sound
Fig. 8. Frequency characteristics of the loudspeaker.
256
H.-Y. Kim et al. / 62 (2001) 245±270
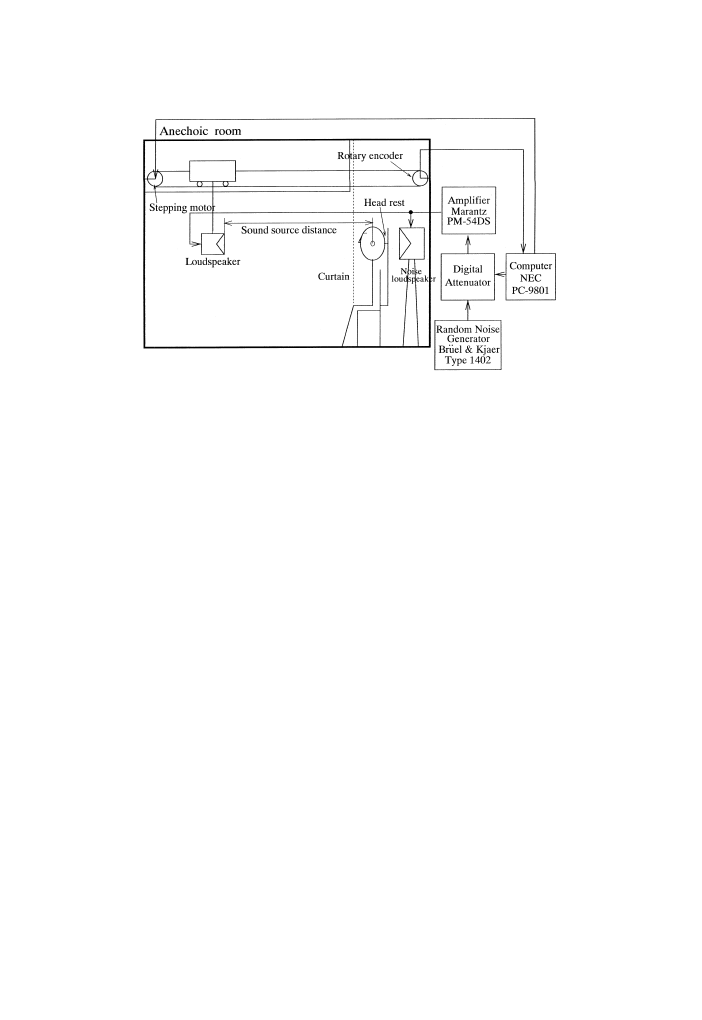
source was a small movable loudspeaker, 8 cm in diameter, in a 101020 cm
enclosure, the position of the loudspeaker being controlled by a computer. The
loudspeaker was placed at the level of the subject's ears. A curtain was hung
between the loudspeaker and the subject so as to avoid providing any visual infor-
mation about the source distance. Mechanical noise due to the movement of the
loudspeaker was masked by noise radiated from another loudspeaker located behind
the subject. The loudspeaker was positioned at distances of 25, 50, 75, 100, 125, 150,
175 and 200 cm from subject. The direction of the sound source was at one of the
four azimuthal angles of 0
, 45
, 135
and 180
, where 0
was de®ned as the position
in front of a subject, 90
being directly to the left.
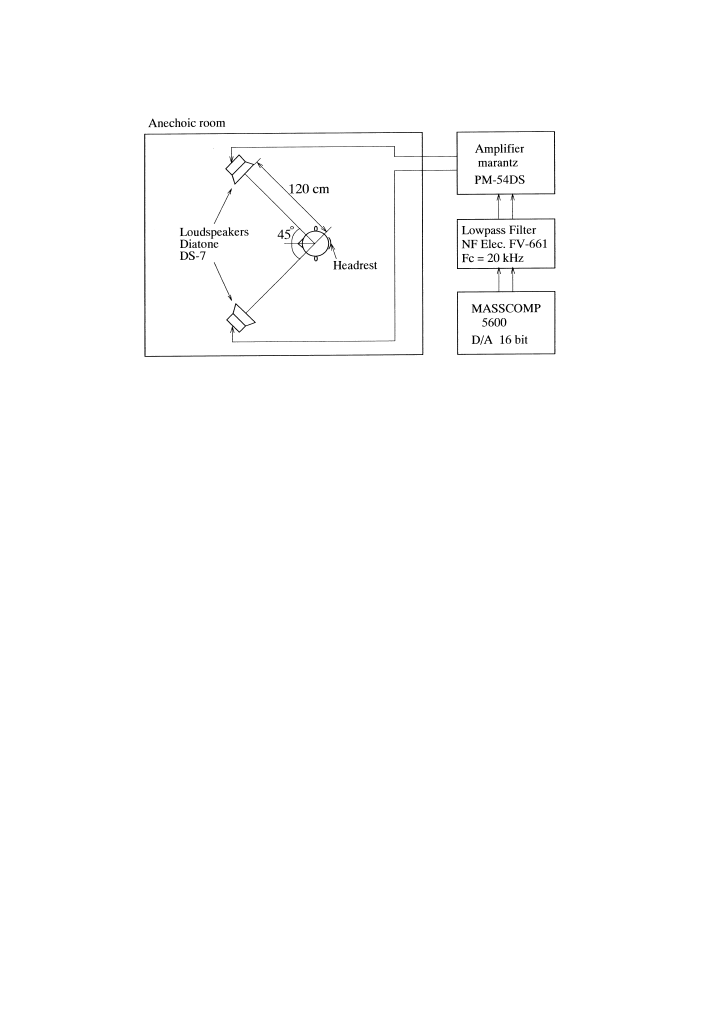
4.3. Experiment on distance perception with simulated HRTFs (Exp. 2)
In this experiment, HRTFs at the listener's ears were simulated as precisely as
possible by two loudspeakers placed in an anechoic room. The experimental setup is
represented in Fig. 10. The HRTFs of all subjects were measured individually prior
to the experiment and then simulated by the procedure described in Section 2.2
[32,33,36]. The two loudspeakers were located at 45
on the horizontal plane and
the loudspeaker was placed at the level of the subject's ears.
4.4. Experiment on distance perception based on the Hirsch±Tahara model (Exp. 3)
In this experiment, the interaural time dierence (ITD) and interaural level dif-
ference (ILD) given by the Hirsch±Tahara model (Section 3.1) were digitally syn-
thesized with the procedure described in Section 2.2. The experimental setup was the
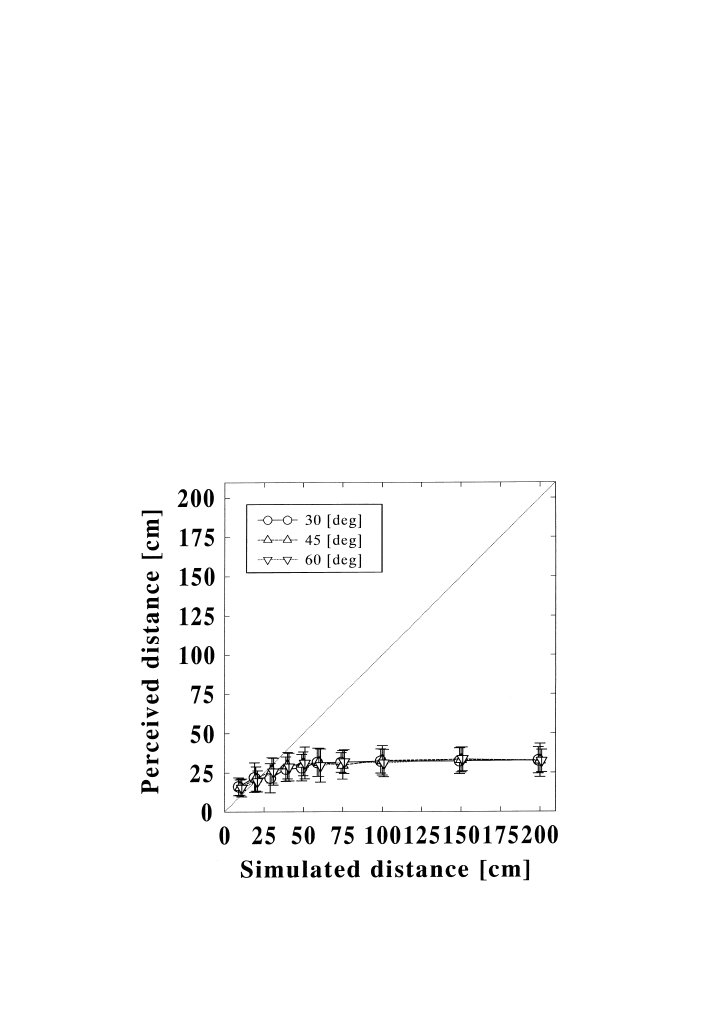
same as in Exp. 2 (see Fig. 10). The ITD and ILD were synthesized for three azi-
muthal angles of 30
45
and 60
at 10, 20, 30, 40, 50, 60, 75, 100, 150 and 200 cm.
Fig. 9. Schematic diagram of the experimental arrangement for distance perception with an actual sound
source (Exp. 1).
H.-Y. Kim et al. / 62 (2001) 245±270
257
The ITD and ILD were set to be constant as de®ned by Eqs. (13) and (14), respec-
tively, over the whole frequency range. The desired transfer functions, D
1
! and
D
2
!, were also set to be ¯at functions over the whole frequency range.
4.5. Experiment on distance perception based on the auditory parallax model (Exp. 4)
The validity and limitation of the auditory parallax model were examined in this
experiment. The experimental setup is shown in Fig. 7. The procedure described in
Section 3.2 was used to synthesize a sound image. The virtual sound sources A and
B were synthesized on a semicircle whose radius l was 300 cm as shown in Fig. 7.
The HRTF for the virtual sound source A at the listener's right ear, G
0
AR
; and that
for the virtual sound source B at the listener's left ear, G
0
BL
, were used for D
AR
and
D
BL
, respectively, as speci®ed in Section 3.2. The point at which D
AR
and D
BL
cross,
i.e. the point where the sound image is expected to be perceived, was set at 10, 20,
25, 30, 40, 50, 60, 75, 100, 125, 150, 175 and 200 cm. The synthesized directions were
four azimuthal angles of 0
, 45
, 135
and 180
since 90
cannot be realized with
the auditory parallax model.
5. Results
Fig. 11 shows the results of Exp. 1. The abscissa shows the physical distance of the
sound source and the ordinate shows the perceived distance of the sound image. The
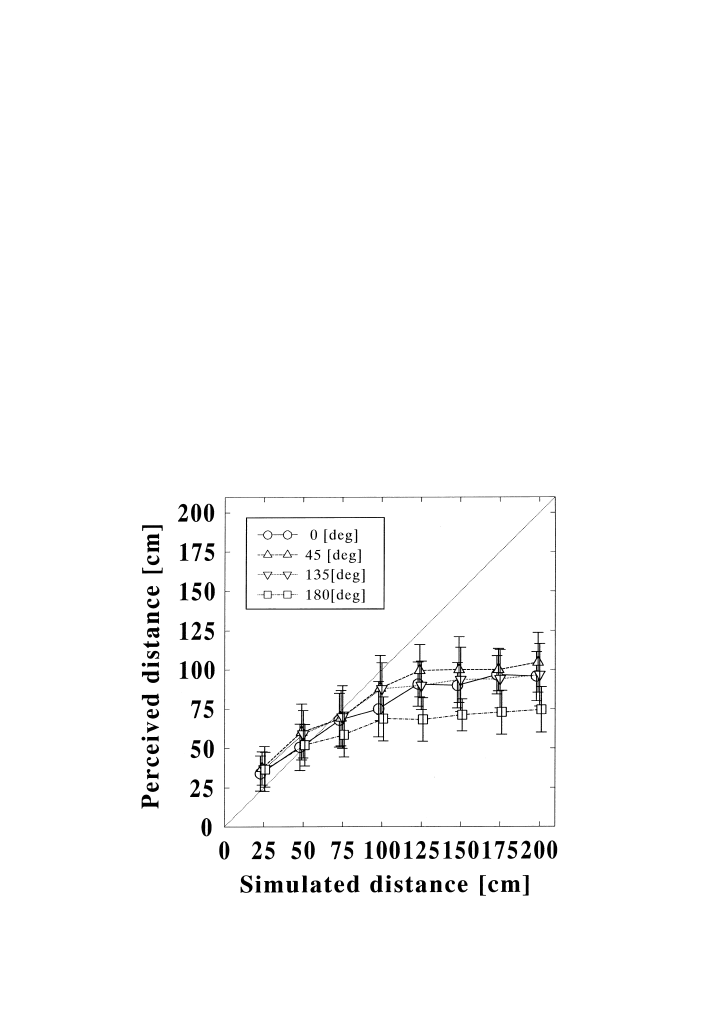
results of Exps. 2, 3 and 4 are shown in Figs. 12, 13 and 14, respectively. In each
®gure, the abscissa represents the simulated physical distance and the ordinate
represents the perceived distance of the sound image. The plots are the mean of the
results from four subjects and error bars show standard deviation.
Fig. 11 shows that the perceived distance of a sound source is closer to the lis-
teners than the physical one beyond 50 cm. Fig. 11 also shows that the perceived
Fig. 10. Schematic diagram of the HRTF simulation system using two loudspeakers (Exp. 2).
258
H.-Y. Kim et al. / 62 (2001) 245±270
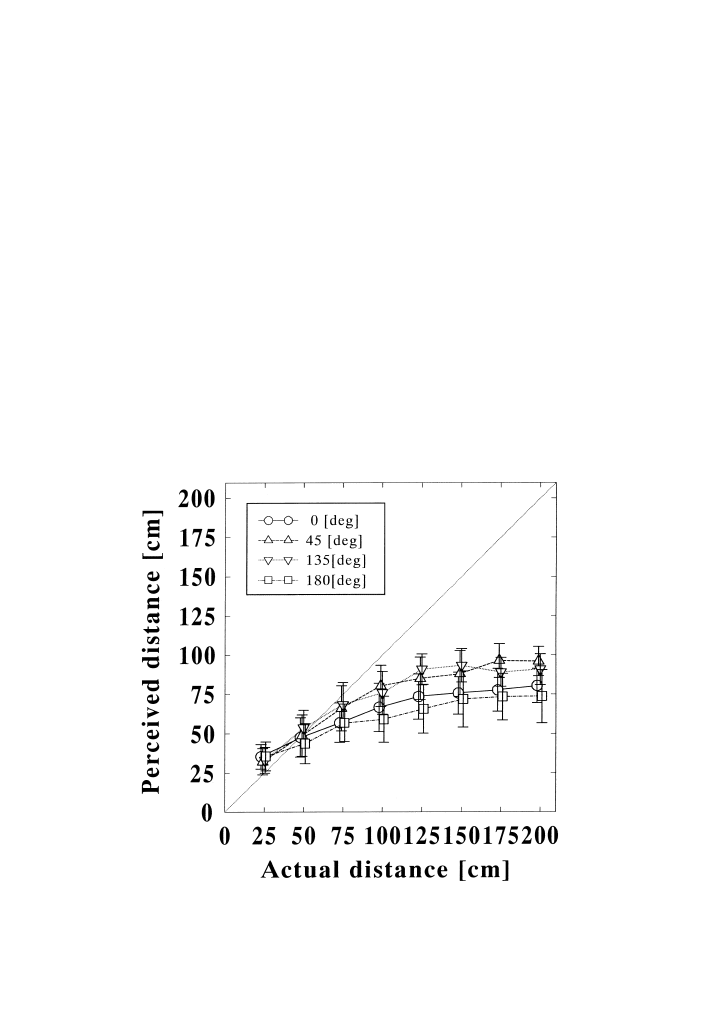
distance increases up to 75 cm±1 m as the actual distance increases until the actual
distance reaches 1±1.5 m. These results mean that a distance less than about 1.5 m is
perceived due to some spectral change of HRTFs without re¯ections and loudness
cue.
We applied the analysis of variance to the data by three-way ANOVA with the
sound source distances, the sound source directions, and the subjects as sources. The
main eects of the sound source distance (F
7;96
160:52; P < 0:0001), the sound
source direction (F
3;192
27:46; P < 0:0001), and the subject (F
3;192
3:85;
P 0:0095) were statistically signi®cant beyond P 0:01, respectively. The eects
of interaction (sound source distance) (sound source direction) (subject)
(F
63;6
0:77; P 0:9007) and (sound source distance) (subject) (F
21;24
0:89;
P 0:5999) were not signi®cant, while the interactions, (sound source distance)
(sound source direction) (F
21;24
2:46; P 0:0003) and (sound source direction)
(subject) (F
9;48
3:95; P < 0:0001) were signi®cant beyond P 0:01. Furthermore,
we used a multiple comparison test (Fisher's LSD: least signi®cant dierence test)
with a signi®cance level of P 0:01 to examine the dierence in the perceived dis-
tances between the sound source distances and the sound source directions. The
results showed that the listener's perceived distance of an actual sound source at 1 m
is judged as being signi®cantly closer to him than those at 1.25±2.0 m. When the
Fig. 11. Perceived distance from an actual sound source when the sound level at the subject's position was
kept constant.
H.-Y. Kim et al. / 62 (2001) 245±270
259
sound source distance exceeded 1 m, no signi®cant dierence was found. This means
that the perceived distance increases as the physical sound source distance increases
up to 1.25 m. As to the azimuthal angle, no statistical signi®cance was found
between 0
and 180
, nor between 45
and 135
, while the perceived distances within
other pairs of directions were found to be signi®cant. The perceived distance for
direction of 45
and 135
were found to be slightly greater than that for 0
and 180
.
This suggests that the change in the interaural dierences as a function of distance
may be an eective cue for the auditory distance perception.
The experimental results of Exp. 2 for various source azimuthal angles are shown
in Fig. 12. This ®gure shows that the perceived distances of a synthesized sound
image with simulation of HRTFs increase up to the simulated distance of 1±1.5 m.
This tendency is very similar to that in Exp. 1. The results recon®rm that some cues
included in HRTFs are useful for auditory distance perception even in the absence
of re¯ections and the loudness cue as long as the distance is closer than 1±1.5 m.
We also applied three-way ANOVA to the results with the same sources as in
the results of Exp. 1. The main eects of the sound source distance
(F
7;96
173:59; P < 0:0001), the sound source direction (F
3;192
6:12;
P 0:0040) and subject (F
3;192
16:56; P < 0:0001) were signi®cant beyond
P 0:01. The interactions, (sound source distance) (source direction) (subject)
(F
63;6
0:78; P 0:9591), (sound source distance) (sound source direction)
Fig. 12. Perceived distance from a simulated sound source with synthesized HRTF.
260
H.-Y. Kim et al. / 62 (2001) 245±270
(F
21;24
0:71; P 0:2052), and (sound source direction) (subject) (F
9;48
1:50;
P 0:4250) were not found to be signi®cant, while the interaction of (sound source
distance) (subject) (F
21;24
2:33; P 0:0007) was found to be signi®cant. Fur-
thermore, we performed the multiple comparison tests (LSD) with the signi®cance
level of P 0:01 for the sound source distances and the sound source directions.
The results showed that the perceived point of the source with simulation of HRTFs
at 1 m is signi®cantly closer than those at 1.25±2.0 m. When the simulated distance
exceeded 1 m, no signi®cant dierence was found. This means that the perceived
distance increases as the synthesized distance with simulation of HRTFs increases
up to 1±1.5 m. Moreover, it was found that the perceived distances for 45
are sig-
ni®cantly greater than those for 0
, and that the perceived distance for other pairs of
directions were also signi®cant. Fig. 13 shows the results with the Hirsch±Tahara
model. With a sound image generated by this model, the perceived distance of the
sound image increases up to about 40 cm and becomes saturated. This means that
subjects did not perceive the change of ITD and ILD as cues for the distance per-
ception over 40 cm. The change in ILD is noticeable when it exceeds a certain value
(0.5±1.0 dB) [44]. Therefore, if the change in ILD is less than this value, it cannot be
perceived even as a change in distance, as mentioned by Tahara [31]. The above
Fig. 13. Perceived distance from a simulated sound source with the interaural time dierence and inter-
aural level dierence of the sound.
H.-Y. Kim et al. / 62 (2001) 245±270
261
results mean that the spectral cues provided by the diraction and re¯ection from
the head and pinnae are necessary for the perception of distance beyond 40 cm.
From the results of three-way ANOVA, the main eect of the sound source dis-
tance (F
7;72
3:12; P 0:0031) was signi®cant beyond P 0:01, but the main
eect of the sound source direction (F
2;192
0:19; P 0:2962) and that of the
subject (F
3;144
3:25; P 0:2151) were not signi®cant (P > 0:01). The eect of
interactions (sound source distance) (source direction) (subject) (F
42;6
0:32;
P 1:0000), (sound source distance) (subject) (F
21;18
0:42; P 0:8910) and
(sound source direction) (subject) (F
6;48
0:90; P 0:9582) were not signi®cant,
while the interaction of (sound source distance) (sound source direction)
(F
14;24
4:04; P < 0:0001) was signi®cant. The result of multiple comparison tests
(LSD) with the signi®cance level of P 0:01 showed that the perceived distance for
the synthesized source of a distance of 10 cm is signi®cantly closer to a listener than
that for distances between 40 and 200 cm. Moreover, the perceived distances for the
synthesized sources for distances between 40 and 200 cm, except for the perceived
distance of 100 cm, were not signi®cantly more distant than those for 20 and 30 cm.
In short, the perceived distance with the Hirsch±Tahara model increases as the syn-
thesized distance increases only up to 40 cm.
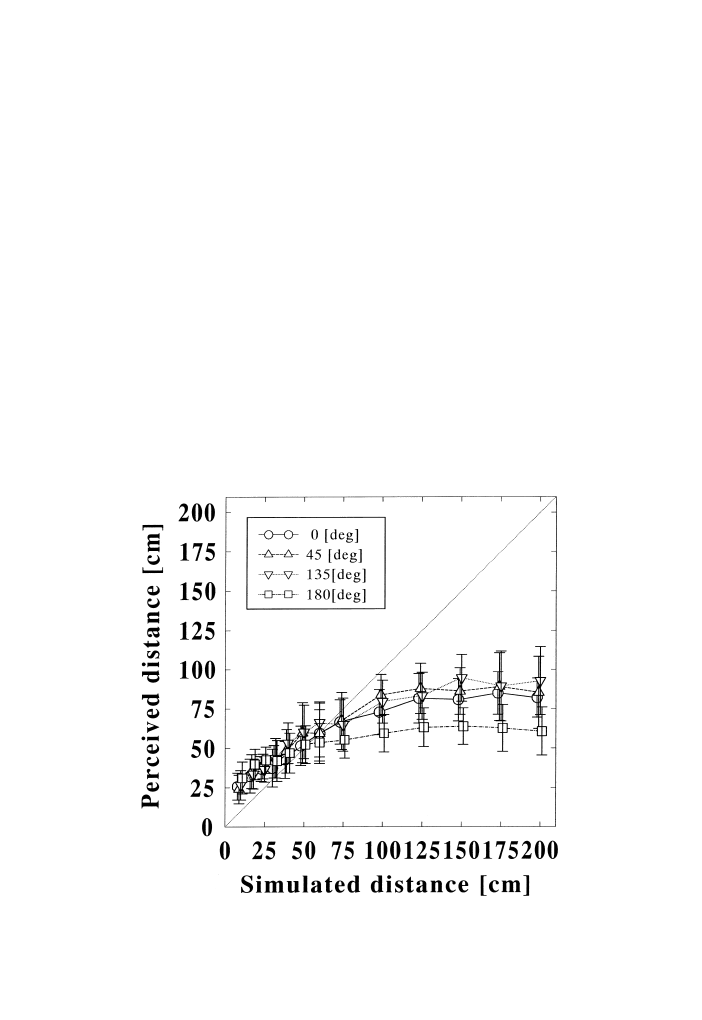
Fig. 14 presents the results with the auditory parallax model. This ®gure shows
that the distance perception with this model is very similar to those for actual sound
Fig. 14. Perceived distance from simulated sound source with parallax information.
262
H.-Y. Kim et al. / 62 (2001) 245±270

source and simulated HRTFs. This suggests that the auditory parallax angles seem
to provide important information when the synthesized distance is within 1±1.5 m in
the absence of loudness cues and re¯ections. Instead, some factors in HRTFs,
depending on the incident direction, may provide information on the distance of a
sound image.
From the results of three-way ANOVA, the main eects of the sound source dis-
tance (F
7;96
116:57; P < 0:0001), the sound source direction (F
3;192
15:21;
P < 0:0001), and subject (F
3;192
15:21; P < 0:0001) were found to be signi®cant.
The eects of interactions (sound source distance) (source direction) (subject)
(F
63;6
1:12; P 0:5200) and (sound source distance) (subject) (F
21;24
1:49;
P 0:7363), were not signi®cant (P > 0:01), while the interaction of (sound source
distance) (sound source direction) (F
21;24
4:53; P < 0:0001) and (sound source
direction) (subject) (F
9;48
5:59; P < 0:0001) were signi®cant (P < 0:01). The
result of multiple comparison tests (LSD) with the signi®cance level of 0.01 showed
that the perceived distance for the synthesized sound image based on the auditory
parallax model at 1 m is signi®cantly closer than those at 1.25±2.0 m. When the
simulated distance exceeded 1 m, no signi®cant dierence was found in the perceived
distance. This means that the perceived distance increases as the synthesized distance
with the auditory parallax model increases up to 1.25 m.
The perceived distances between 45
and 135
were not signi®cantly dierent,
while those between the other pair of directions were signi®cant. Moreover, the
perceived distances for direction of 45
and 135
were signi®cantly greater than
those for 0
and 180
, and the perceived distance of direction of 0
was slightly more
distant than that for 180
. This again suggests that the change of the interaural dif-
ferences as a function of distance could be a cue for the auditory distance perception.
6. Discussion
6.1. Comparison between actual sound source and the auditory parallax model
The results of Exps. 1, 2 and 4 showed a very similar tendency, namely that the
perceived distance monotonically increased up to around 1 m as the simulated dis-
tance increased up to 1±1.5 m and then clearly became saturated. This is the same
tendency previously reported by Morimoto and Nomachi [45] for a sound source
placed in an anechoic room with a sound source distance of 0.2±3 m. Nielsen [16]
also showed similar tendencies when a voice signal was played back in an anechoic
room with a sound source distance of 1±5 m on the horizontal plane. Similar results
were also found by Haustein [22], von BeÂkeÂsy [27], and Sone et al. [28]; the perceived
distance of the sound image becomes saturated at 2±3, 1±2 and 1.2±1.5 m, respec-
tively. Beyond about 1 m, HRTFs hardly change as a function of distance [20,29].
Therefore, the relative change in the spectral shape of HRTFs may be an important
cue for distance judgment up to about 1 m.
A comparison between perceived distances of an actual sound source and those
based on the auditory parallax model is presented in Fig. 15. This ®gure shows that
H.-Y. Kim et al. / 62 (2001) 245±270
263
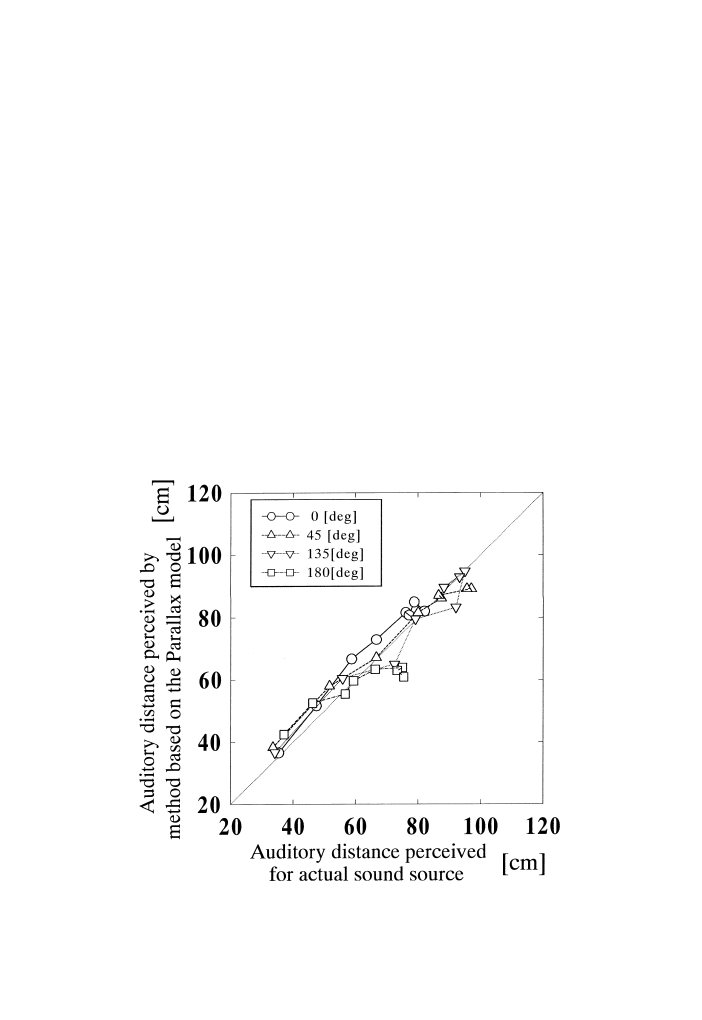
the perceived distances with the auditory parallax model are almost identical to the
distance of an actual sound source. This suggests that the cues provided by the
parallax angle are useful for the distance perception of a sound source within 1±1.5
m at least from a listener in the absence of re¯ections and the loudness cue.
As mentioned above, the distance perceived by a listener for a sound image syn-
thesized with the auditory parallax model showed tendencies very similar to those
with an actual sound source. In order to discuss the similarity/dierence of the per-
ceived distances between the two methods in more detail, we performed three-way
ANOVA with the sound source directions, the experimental methods and the sub-
jects chosen as variables for each sound source distance. The results showed that the
main eect of the sound source direction was signi®cant beyond P 0:01 when the
sound source distance was equal to or above 75 cm (for 75 cm, F
3;48
6:62;
P 0:0003; for 100 cm, F
3;48
3:79; P < 0:0001; for 125 cm, F
3;48
16:48;
P < 0:0001; for 150 cm, F
3;48
20:35; P < 0:001; for 175 cm, F
3;48
18:04;
P < 0:001; for 200 cm, F
3;48
37:04; P < 0:001), while it was not signi®cant
beyond P 0:01 when the sound source distances were 25 cm (F
3;48
3:79;
P 0:0117) and 50 cm (F
3;48
1:14; P 0:3342). The main eect of the subjects was
not signi®cant beyond P 0:01 for all the sound source distances (for 25 cm, F
3;48
Fig. 15. Comparison of the perceived distances from actual sound source and simulated sound source
with parallax information.
264
H.-Y. Kim et al. / 62 (2001) 245±270

0:23; P 0:8746; for 50 cm, F
3;48
0:51; P 0:6726; for 75 cm, F
3;48
0:69;
P 0:5587; for 100 cm, F
3;48
0:64; P 0:5932; for 125 cm, F
3;48
1:61;
P 0:1886; for 150 cm, F
3;48
3:58; P 0:0153; for 175 cm, F
3;48
2:30;
P 0:0794; for 200 cm, F
3;48
1:20; P 0:3112). The main eect of the experimental
methods was signi®cant beyond P 0:01 when the sound source distance were 25 cm
(F
1;96
29:94; P < 0:001), 50 cm (F
1;96
11:45; P 0:0009) and 100 cm (F
1;96
13:52; P 0:0003), but not signi®cant for other sound source distances (for 75 cm,
F
1;96
1:19; P 0:2771; for 125 cm, F
1;96
1:08; P 0:3010; for 150 cm, F
1;96
3:83; P 0:0520; for 175 cm, F
1;96
3:63; P 0:8731; for 150 cm, F
1;96
0:09;
P 0:9787). When the sound source distances were 25, 50 and 100 cm, and the perceived
distances with the auditory parallax model were more distant than those judged for the
actual sound source.
Furthermore, we conducted LSD multiple comparison tests with the signi®cance
level of 0.01 to investigate whether the sound source direction yields signi®cant dif-
ferences in the perceived distance. For the sound source distances from 75 to 125 cm,
the perceived distances of 180
were signi®cantly closer than those for the other
three directions (0
, 45
and 135
) while no signi®cant dierences were found among
these three directions. When the sound source distance was from 150 to 200 cm, the
perceived distances for 45
and 135
were not signi®cantly dierent while those for
0
were signi®cantly closer than those for the two directions. Moreover, the per-
ceived distances for 180
were far closer than those for the other three directions.
6.2. Analysis of spectral features involved in HRTF
From the fact that the results of Exps. 1, 2 and 4 showed very similar tendencies,
we focused on the similarity of HRTFs as well as the similarity of their interaural
dierence to consider ``what parameter of HRTFs could be a cue for distance per-
ception?'' As mentioned in Section 3.2, ITD and ILD due to the dierence of the
length of sound propagation paths for both ears of the listener is not involved in the
present auditory parallax model. Thus, we consider only spectral factors in HRTFs
and their interaural dierence.
To investigate the similarity between the measured HRTFs at each actual sound
source distance and the synthesized transfer functions used in Exp. 2 with the two-
loudspeaker method, average level dierences between the measured HRTFs and
the transfer functions synthesized by the three methods were calculated with the 1/3
octave bands levels. The 1/3 octave band analysis was adopted because 1/3 octave is
close to the critical bandwidth (ca. 1/4 octave). The abscissa in Fig. 16 represents the
sound source distance and the ordinate represents the average of the relative level
dierence in every 1/3 octave band. The measured HRTFs at each distance and the
synthesized HRTFs for each simulated distance with each method, which were
superposed as their average squared dierences in 1/3 octave band levels were
minimum. The results showed that the average rms level dierences between the
measured HRTFs for all the distances and the HRTFs synthesized by the simulation
method with two loudspeakers were below 0.5 dB for all the distances. The level
dierences between the measured HRTFs and the transfer functions synthesized
H.-Y. Kim et al. / 62 (2001) 245±270
265
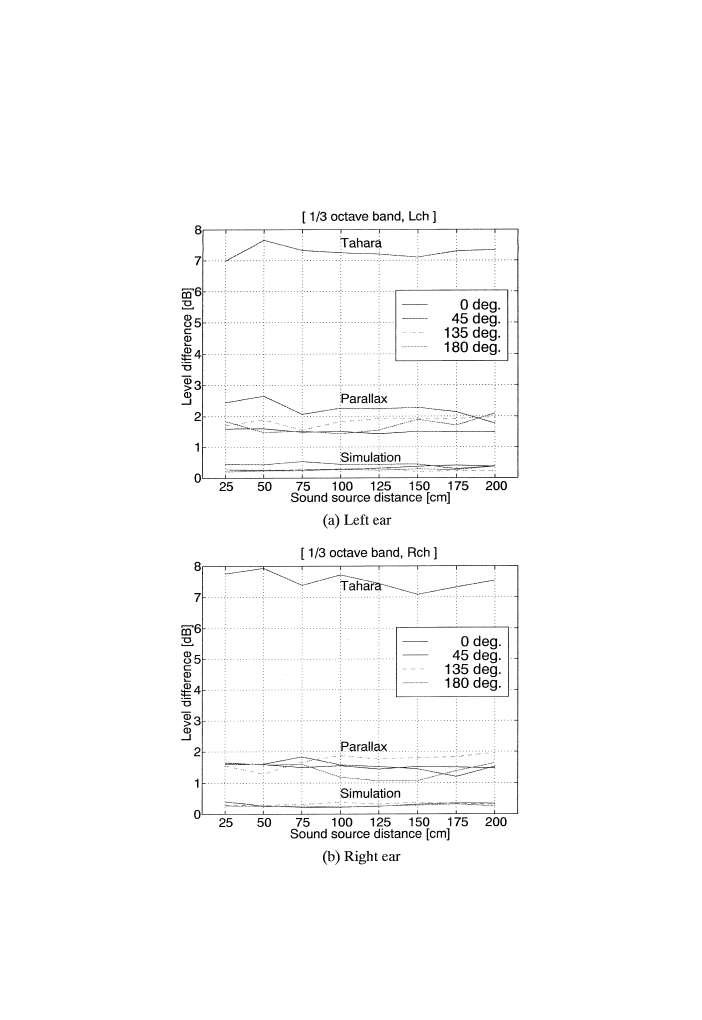
based on the auditory parallax model were within around 1±2 dB. These results
show that the transfer functions synthesized with the auditory parallax model as well
as the HRTFs which were directly synthesized well simulate the measured HRTFs,
though the latter are slightly better than the former. This may be a reason for the
Fig. 16. Examples of level dierence in 1/3 octave band analysis. (Simulation: measured HRTFs vs syn-
thesized HRTFs; parallax: measured HRTFs vs synthesized HRTFs based on the parallax model; Tahara:
measured HRTFs vs synthesized based on the Hirsch-Tahara model.)
266
H.-Y. Kim et al. / 62 (2001) 245±270
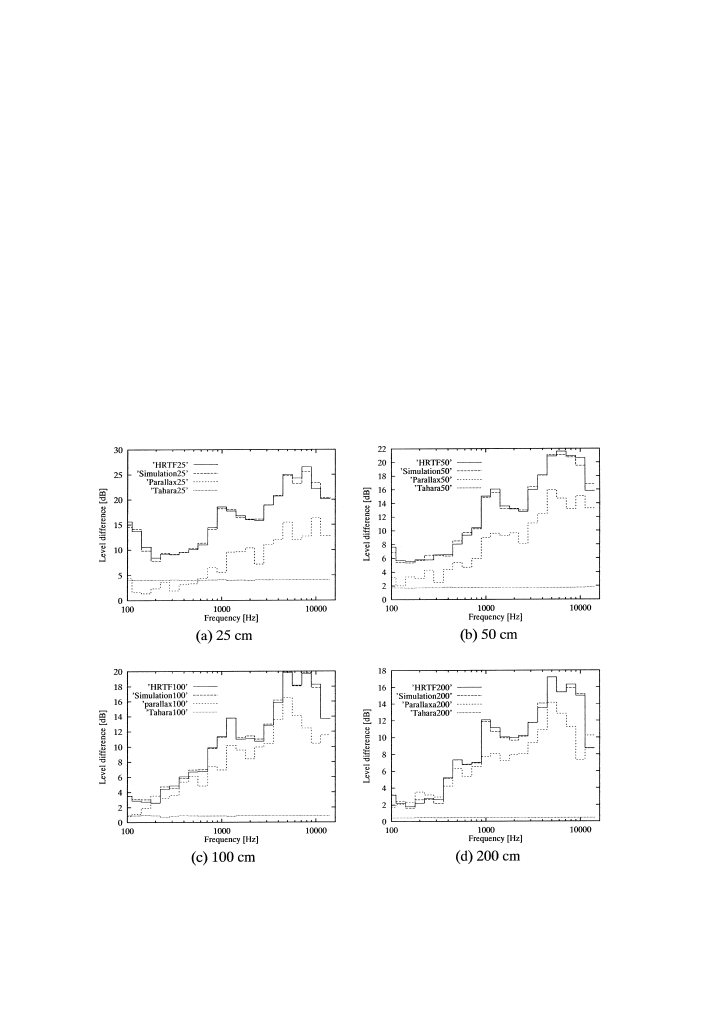
similarity among the experimental results. On the other hand, the level dierence
between the measured HRTFs and the transfer functions synthesized based on the
Hirsch±Tahara model is around 7±8 dB, because there are no spectral peaks and
dips over all of the frequency bands. Thus, the distance perception of a sound image
may be dicult with the Hirsch±Tahara model.
As described in the previous section, the sound sources at the azimuthal angles of
45
and 135
were localized at a distance farther than in those at 0
and 180
. These
results are in agreement with Haustein [22], Sone et al. [28] and Nielsen [16]; they
found that the ability to judge distance when the sources were placed in a lateral
direction was better than when the sources were in the front or back. This suggests
that the change in the interaural dierences as a function of distance may be a cue
for the distance perception. Thus, we calculated the interaural level dierence (ILD)
of the HRTFs and synthesized transfer functions; which were analyzed every 1/3
octave band for each distance. Fig. 17 shows the results. The abscissa shows fre-
quency and the ordinate indicates the ILD for every 1/3 octave with the mean of
four subjects. This ®gure shows that the dierence in the absolute values of ILD is
rather large between those with the auditory parallax model and those with
Fig. 17. Examples of interaural level dierence in 1/3 octave band analysis. (Azimuthal angle: 45
,
HRTF: measured HRTFs for each distance; simulation: synthesized HRTFs; parallax: synthesized
HRTFs based on the parallax model; Tahara: synthesized based on the Hirsch±Tahara model.)
H.-Y. Kim et al. / 62 (2001) 245±270
267

measured HRTFs, while the dierence between those with the simulated HRTFs
and those with measured HRTFs is almost negligible. However, as a function of
frequency, the relative shape of the ILD based on the auditory parallax model is
quite similar to the actual ILD and this may be a reason for the similarity among the
experimental results.
7. Conclusion
Methods to simulate the distance of a sound image within 2 m from a listener in
the absence of re¯ections and the loudness cue was investigated. To do this, a model
named the ``auditory parallax model,'' which focuses on the role of parallax angle
information involved in HRTFs, was examined. Psychoacoustic experiments were
conducted to examine the eectiveness in simulating the distance of a sound image.
Experiments with an actual sound source, with digitally synthesized HRTFs and
with ITD and ILD synthesis as proposed by Hirsch and Tahara were also made for
purposes of comparison.
The experiments with an actual sound source showed that distance localization is
possible for a distance of about 1.5 m or less without any cues of sound pressure
level and re¯ections from walls. The perceived distance of a sound image mono-
tonically increased with the physical distance of the source up to 1±1.5 m. If the
presented distance exceeded this, the perceived distance was almost completely
saturated. The distance of a sound image simulated with the auditory parallax
model and that with synthesized HRTFs showed tendencies very similar to those
with the actual sound source. On the other hand, for a sound image yielded due to
the Hirsch±Tahara model, the perceived distance of the sound image increased up to
around 40 cm and then became saturated. These results show that simple synthesis
of the change of the ITD and ILD as a function of distance is insucient to simulate
the distance of a sound image. On the contrary, the results of the experiment in
which HRTFs were simulated based on the auditory parallax model showed very
similar tendencies to those with an actual sound source.
Possible explanations of the similarity between the results with an actual sound source
and those simulated by the auditory parallax model were then examined by comparing
the realized transfer functions. The result showed that the relative frequency char-
acteristic (shape) of the actual HRTFs and that simulated by the auditory parallax
model were quite similar. Moreover, the shape of ILD as a function of frequency was
quite similar between the two methods. These similarities of the frequency character-
istics may be the reason for the good performance of the auditory parallax model.
Acknowledgements
The authors wish to thank Professor Henrik Mùller for meaningful discussion on
the perceptual cues for distance localization and the auditory parallax model. This
268
H.-Y. Kim et al. / 62 (2001) 245±270

research was partially supported by the Ministry of Education, Science, Sports and
Culture, Grants-in-Aid for Scienti®c Research (B), 10450143, 1998 and Scienti®c
Research (C), 10835001, 1998. Part of this work was carried out under the Coop-
erative Research Project Program of the Research Institute of Electrical Commu-
nication, Tohoku University.
References
[1] Blauert J. Spatial hearing. Rev. ed. Cambridge, MA: The MIT Press, 1995.
[2] Damaske P, Wagener B. RichtungshoÈrversuche uÈber einen nachgebildeten Kopf. Acustica
1969;21:30±5.
[3] Shaw EAG. Transformation of sound pressure level from the free ®eld to the eardrum in the hor-
izontal plane. J Acoust Soc Am 1974;56:1848±61.
[4] Kurosawa A, Takagi T, Yamaguchi Z. On transfer function of human ear and auditory localization.
J Acoust Soc Jpn(J) 1981;38:145±9 (in Japanese).
[5] Gotoh T. Can the acoustic head-related transfer function explain every phenomenon in sound loca-
lization? A Symposium Convened at the University of Guelph. 1979:244±9.
[6] Blauert J. Sound localization in the median plane. Acustica 1969;22:205±13.
[7] Shaw EAG, Teranishi R. Sound pressure generated in an external-ear replica and real human ears by
a nearby sound source. J Acoust Soc Am 1968;44:240±9.
[8] Hebrank J, Wright D. Spectral cues used in the localization of sound sources on the median plane. J
Acoust Soc Am 1974;56:1829±1834.
[9] Mehrgardt S, Mellert V. Transformation characteristics of the external human ear. J Acoust Soc Am
1977;61:1567±76.
[10] Morimoto M, Nomachi K. Binaural disparity cues in the median plane localization. J Acoust Soc
Jpn(E) 1982;3:99±103.
[11] Asano F, Suzuki Y, Sone T. Role of spectral cues in median plane localization. J Acoust Soc Am
1990;88:159±68.
[12] Coleman PD. Failure to localize the source distance of an unfamiliar sound. J Acoust Soc Am
1962;34:345±6.
[13] Cochran P, Throop J, Simpson WE. Estimation of distance of a source of sound. Am J Psychol
1968;81:198±206.
[14] Gardner MB. Distance estimation of 0 degree or apparent 0 degree oriented speech signal in anec-
hoic space. J Acoust Soc Am 1969;45:47±53.
[15] Petersen J. Estimation of loudness and apparent distance of pure tones in a free ®eld. Acustica
1990;70:61±5.
[16] Nielsen SH. Auditory distance perception in dierent rooms. J Audio Eng Soc 1993;41:755±70.
[17] Mershon DH, King LE. Intensity and reverberation as factors in the auditory perception of ego-
centric distance. Perception and Psychophysics 1975;18:409±15.
[18] Mershon DH, Bowers JN. Absolute and relative cues for the auditory perception of egocentric dis-
tance. Perception 1979;8:311±22.
[19] Wagenaars WM. Localization of sound in a room with re¯ecting walls. J Audio Eng Soc 1990;38:99±110.
[20] Begault DR. 3-D Sound for virtual reality and multimedia. Cambridge, MA: AP Professional, 1994.
[21] Stevens SS, Guiro M. Loudness, reciprocality and partition scales. J Acoust Soc Amer 1962;34:1466±
71.
[22] Haustein BG. Hypothesen uÈber die einohrige Entfernungswahrnehmung des menschlichen GehoÈrs.
Hochfrequenztech u Elektroakustik 1969;79:46±57.
[23] Begault DR. Control of auditory distance. PhD dissertation, University of California, San Diego,
1987.
H.-Y. Kim et al. / 62 (2001) 245±270
269

[24] Gotoh T, Kimura Y, Akira A, Yamada A. A consideration of distance perception in binaural hear-
ing. J Acoust Soc Jpn 1977;33:667±71.
[25] Coleman PD. Dual role of frequency spectrum in determination of auditory distance. J Acoust Soc
Am 1968;44:631±2.
[26] Nielsen SH. Distance perception in hearing, Doctoral dissertation. Aalborg University, 1991.
[27] von BeÂkeÂsy G. The moon illusion and similar auditory phenomena. Am J Psychol 1949;62:540±52.
[28] Sone T, Suzuki Y, Takane S, Suzuki H. Distance perception in sound localization and its control by
simulation of head-related transfer functions. Proc 14th Intnl Cong Acoust L7-4, 1992.
[29] Morimoto M, Ando Y, Maekawa Z. On head-related transfer function in distance perception. Proc
Cong of Acoust Soc Jpn 1975;137-8 (in Japanese).
[30] Hirsch HR. Perception of the range of a sound source of unknown strength. J Acoust Soc Am
1968;43:373±4.
[31] Tahara Y, Sakurai H. A tentative model for the localization of sound based on simultaneity of time
dierence and level dierence of the sound between ears. Proc Cong of Acoust Soc Jpn 1974;161±2
(in Japanese).
[32] Schroeder MR, Atal BS. Computer simulation of sound transmission in rooms. IEEE Int Conv Part
7, 1963;150±5.
[33] Ando Y, Shidara S, Maekawa Z, Kido K. Some basic studies on the acoustic design of room by
computer. J Acoust Soc Jpn 1973;29:151±9 (in Japanese).
[34] Blauert J, Laws P. Verfahren zur orts- und klanggetreuen Simulation von Lautsprecherbeschallungen
mit Hilfe von KopfhoÈrern. Acustica 1973;29:273±7.
[35] Johren M, Morimoto M, Ando Y. Localization of sound source simulated by a digital computer.
Proc Cong of Acoust Soc Jpn 1977;87±8 (in Japanese).
[36] Yamakoshi K, Watanabe K, Yoshikawa S. Sound localization control system using FIR-®lter.
IEICE Technical Report EA81-34, 1981 (in Japanese).
[37] Batteau DW. The role of the pinna in human localization. Proc Roy Soc Lodon, B168:158±80
[38] Laws P, Platte HJ. Ein spezielles Konzept zur Realisierung eines Kunstkopfes fuÈr die kopfbezogene
stereophone Aufnahmetechnik [A speci®c concept related to the construction of a dummy head for
head-related stereophonic sound pickup]. Rundfunktech Mitt 1978;22:28±31.
[39] Kleiner M. Problems in the design and use of ``dummy heads''. Acustica 1978;41:183±93.
[40] Mùller H, Sùrensen MF, Hammershùi D, Jensen CB. Head-related transfer function of human sub-
jects. J Audio Eng Soc 1995;43:300±21.
[41] Brungart DS, Rabinowitz WM. Auditory localization of nearby sources. Head-related transfer
functions. J Acoust Soc Am 1999;106:1465±79.
[42] Suzuki K, Ozawa K, Suzuki Y, Sone T. A Consideration on the factor of the short distance locali-
zation. Technical Report of IEICE, EA90-29, 1990 (in Japanese).
[43] Suzuki Y, Kim H-Y, Takane S, Sone T. A modeling of distance perception based on auditory par-
allax model. Proc of the 16th Intern. Cong. on Acoust. and 135th Meeting of the Acoust Soc of Am
1998;IV:2903±4.
[44] Rodenburg M. Sensitivity of the auditory system to dierences in intensity. PhD thesis, Medical
Faculty, Rotterdam. 1972.
[45] Morimoto M, Nomachi K. Distance perception of sound sources simulated by a digital computer.
Proc Cong of Acoust Soc Jpn 1978;287±8 (in Japanese).
270
H.-Y. Kim et al. / 62 (2001) 245±270
Wyszukiwarka
Podobne podstrony:
ebook occult The Psychedelic Experience A manual based on the Tibetan Book of the Dead
Munster B , Prinssen W Acoustic Enhancement Systems – Design Approach And Evaluation Of Room Acoust
31 411 423 Effect of EAF and ESR Technologies on the Yield of Alloying Elements
Hamao And Hasbrouck Securities Trading In The Absence Of Dealers Trades, And Quotes On The Tokyo St
Evaluation of biomass quality of selected woody species depending on the method of soil enrichment a
~$aluation of biomass quality of selected woody species depending on the method of soil enrichment a
Effect of a novel physical pretreatment process on the drying kinetics of seedless grapes
Pancharatnam A Study on the Computer Aided Acoustic Analysis of an Auditorium (CATT)
Fundamnentals of dosimetry based on absorbed dose standards
A Series Active Power Filter Based on a Sinusoidal Current Controlled Voltage Source Inverter
A Series Active Power Filter Based on Sinusoidal Current Controlled Voltage Source Inverter
Comparative study based on exergy analysis of solar air heater collector using thermal energy storag
Pancharatnam A Study on the Computer Aided Acoustic Analysis of an Auditorium (CATT)
Network Virus Propagation Model Based on Effects of Removing Time and User Vigilance
Phylogeny of the enterobacteriaceae based on genes encoding elongation factor Tu
Implementation of a Mu;ti level Inverter Based on Selective Harmonic Elimination and Zig Zag Connect
A Series Active Power Filter Based on Sinusoidal Current Controlled Voltage Source Inverter
więcej podobnych podstron