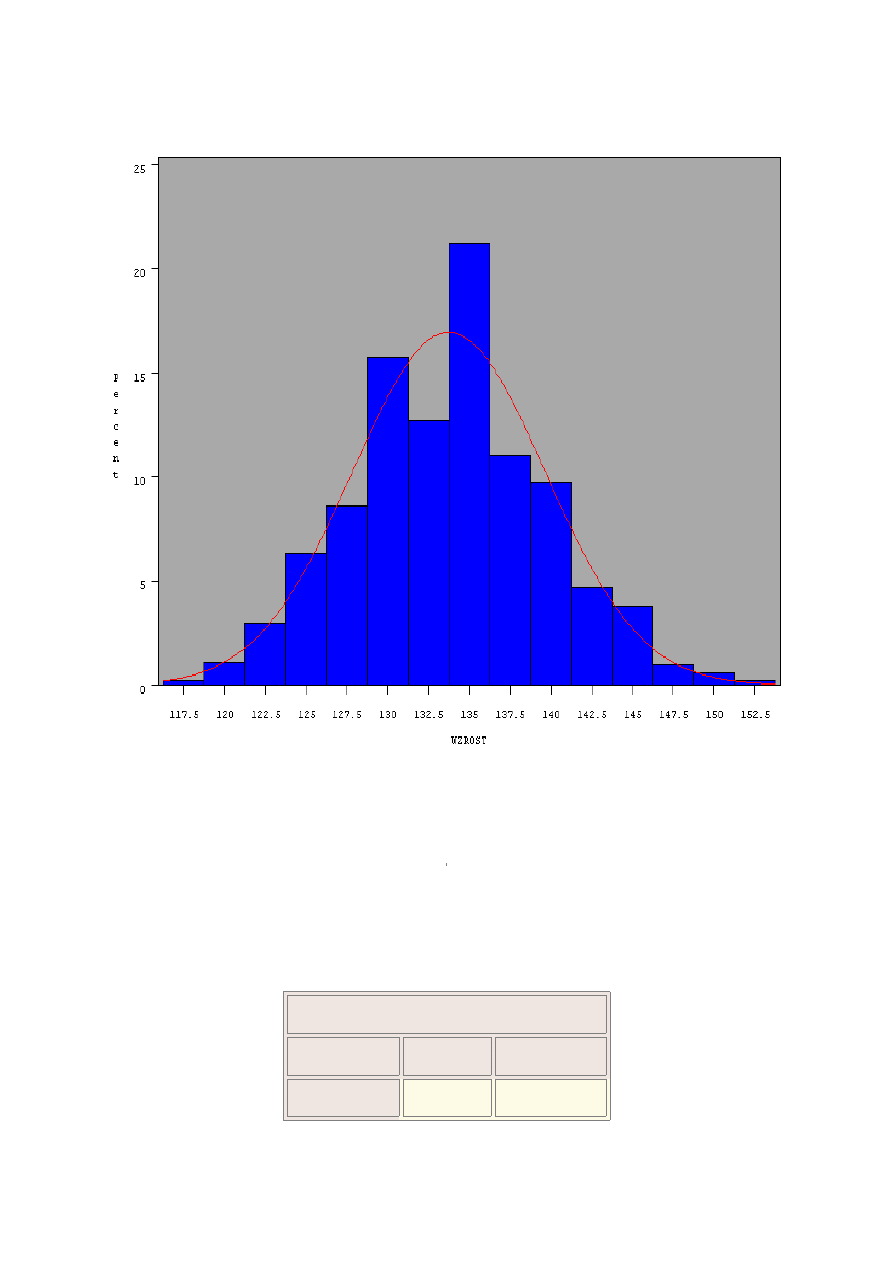
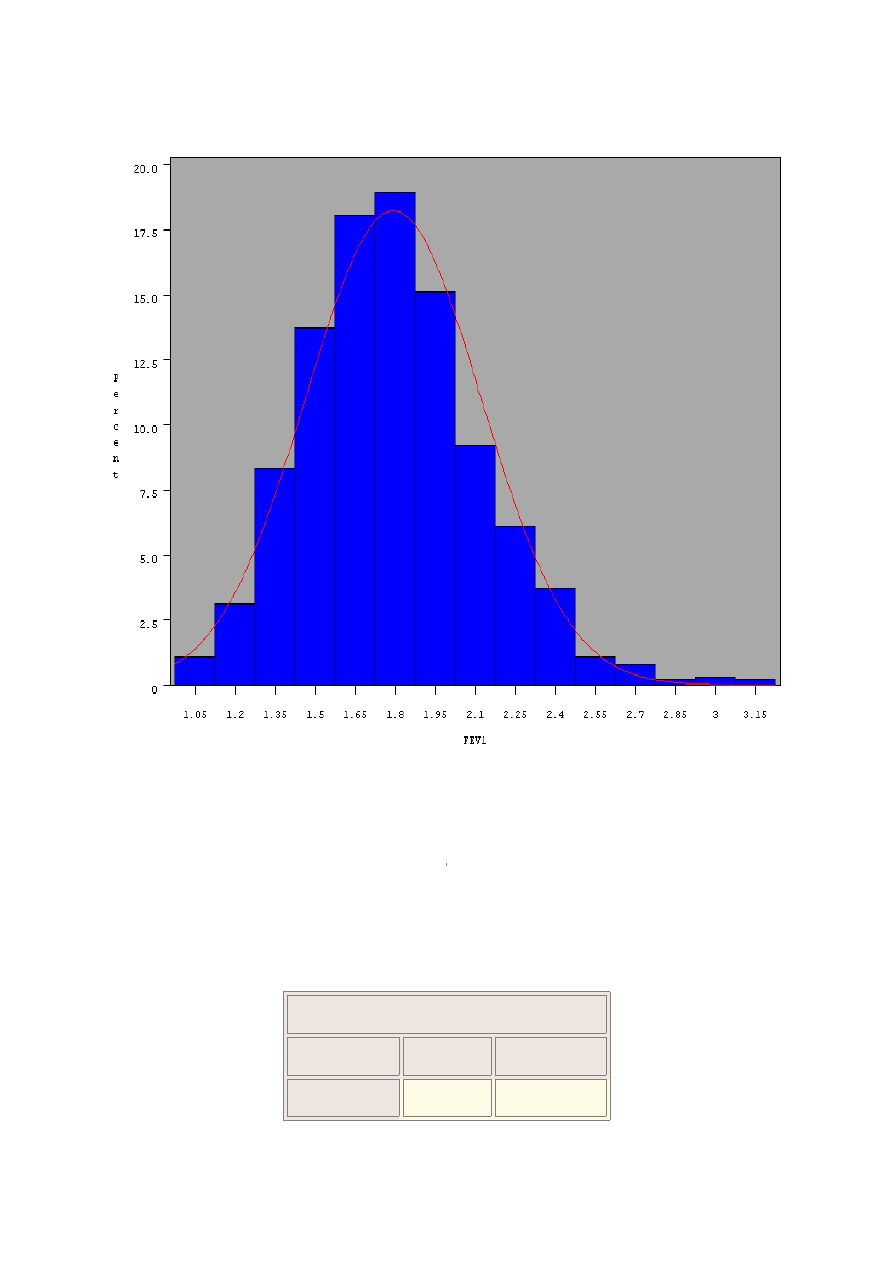
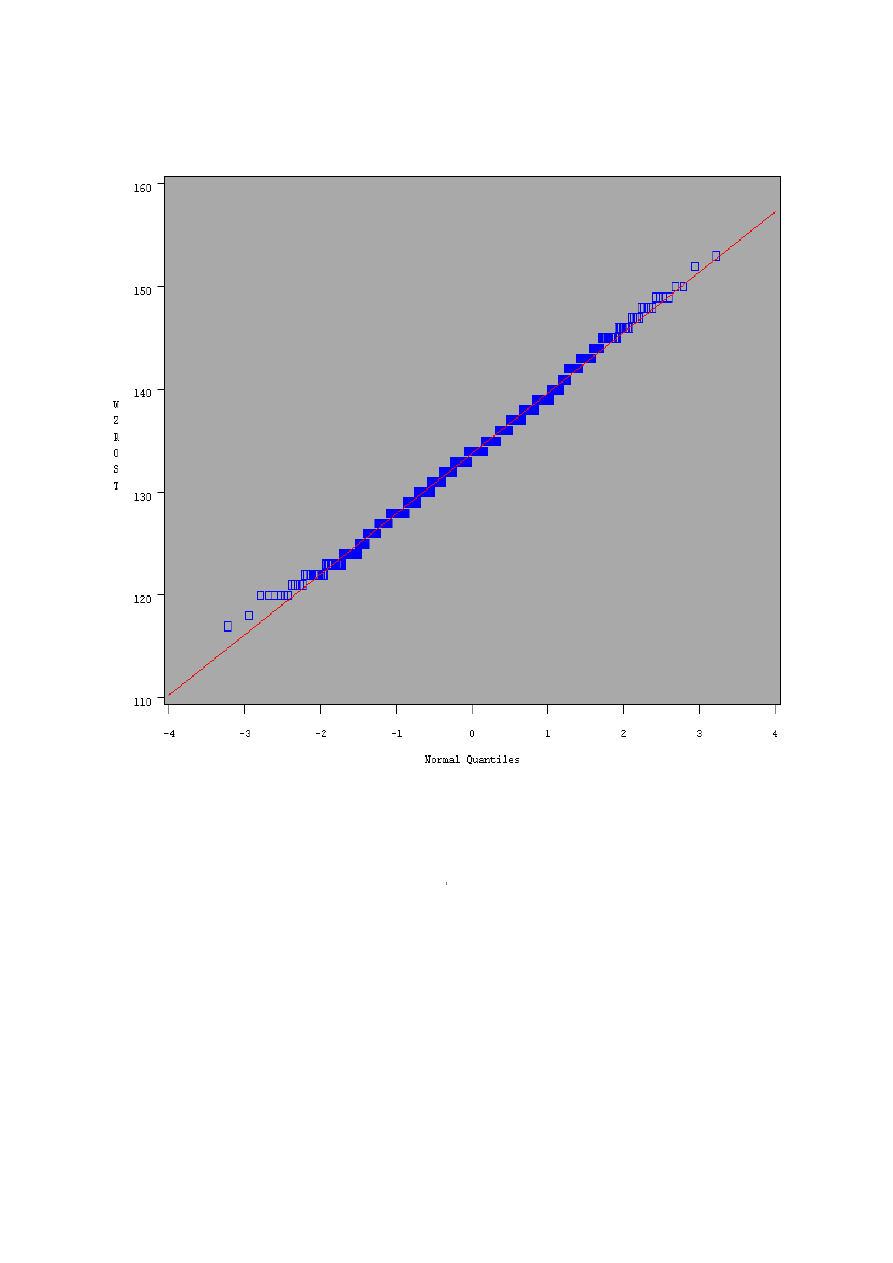
Analiza rozkładu dla kolejnych zmiennych.
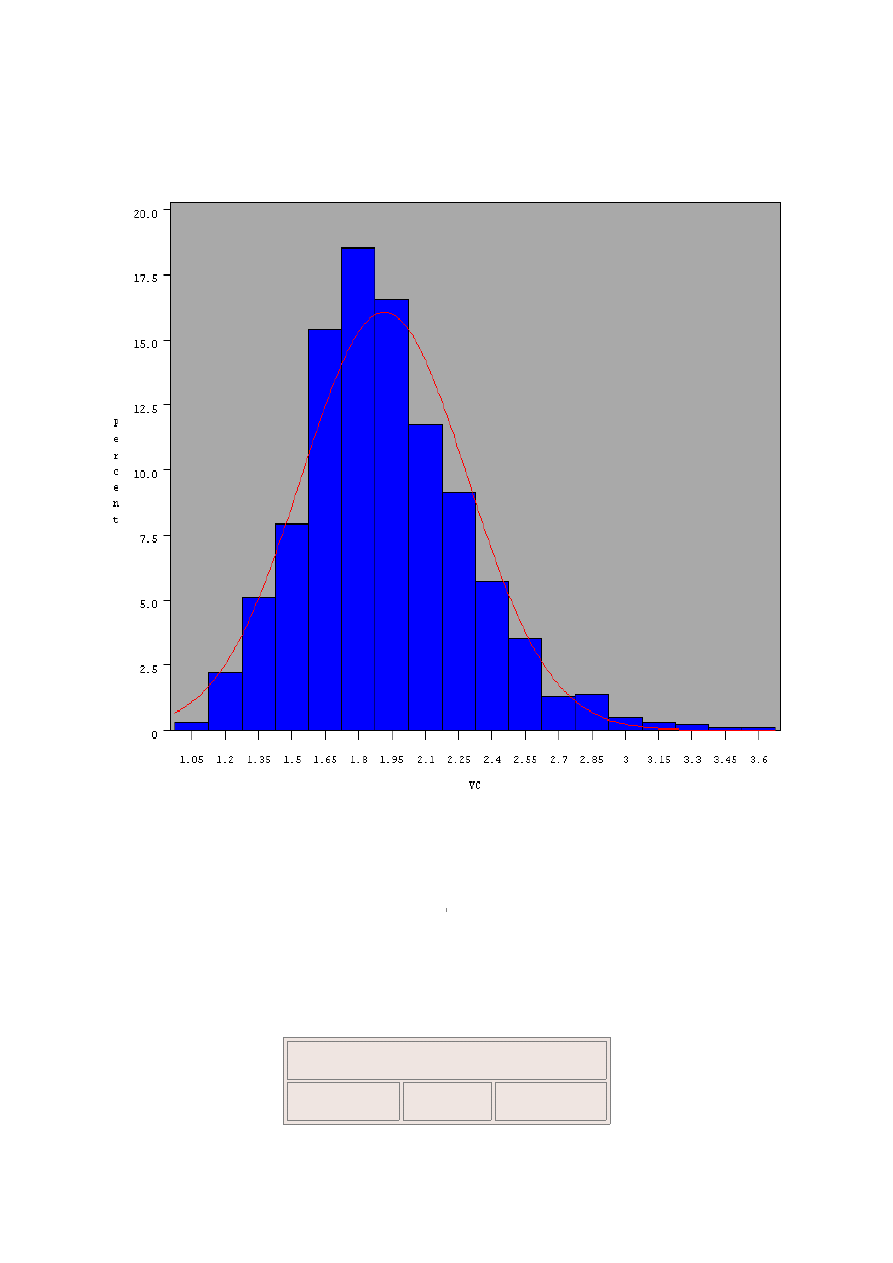
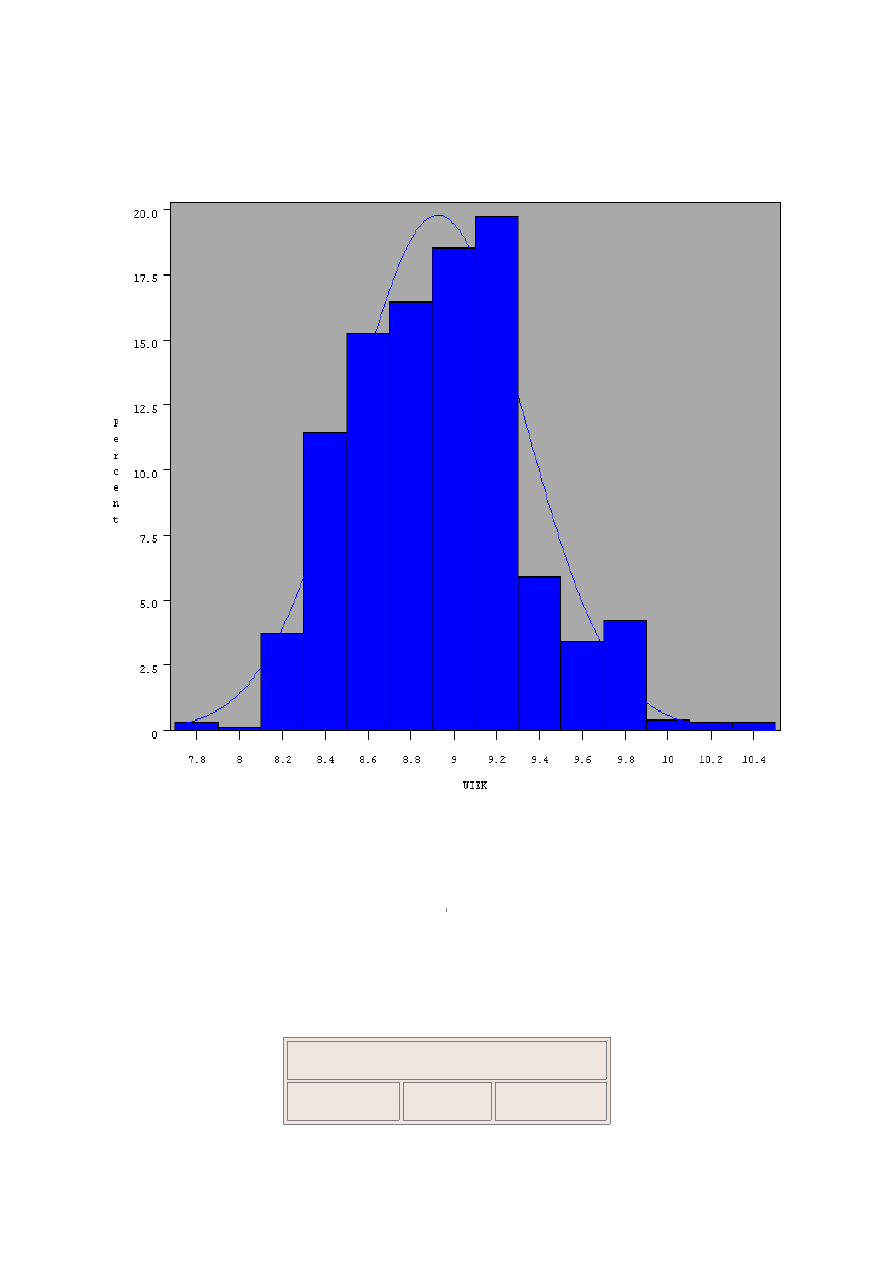
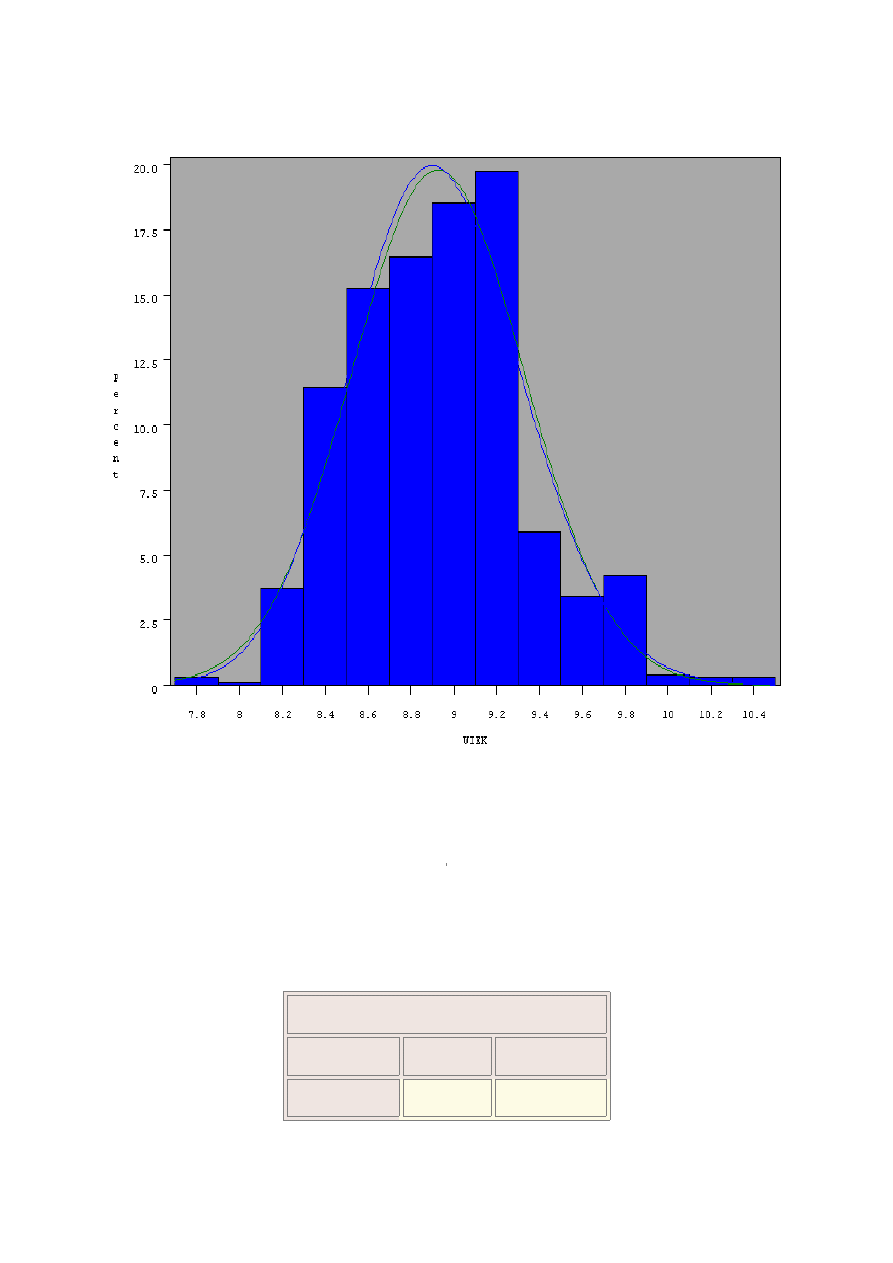
Porównaj histogram nałożone wartości teoretycznego
rozkładu normalnego (zielona linia) o tych samych
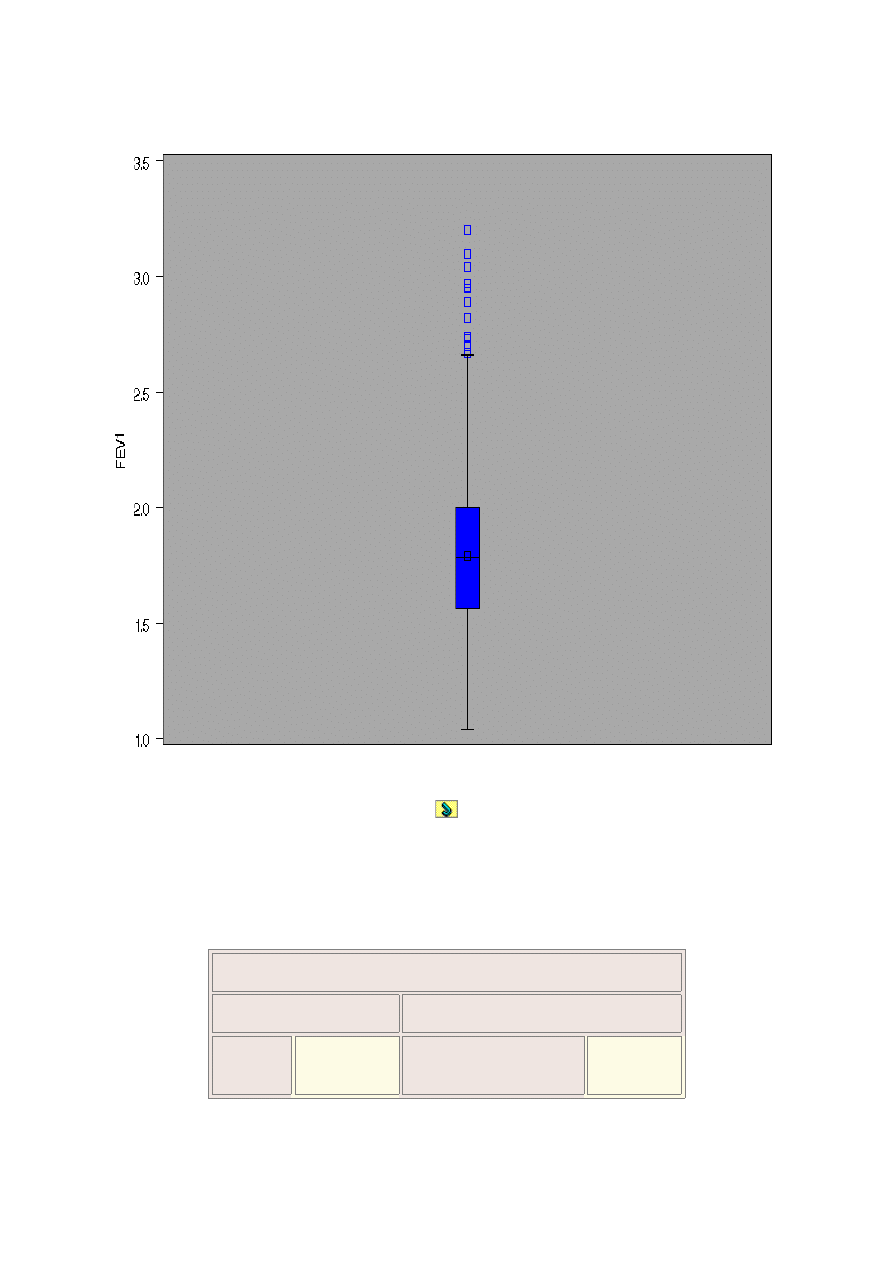
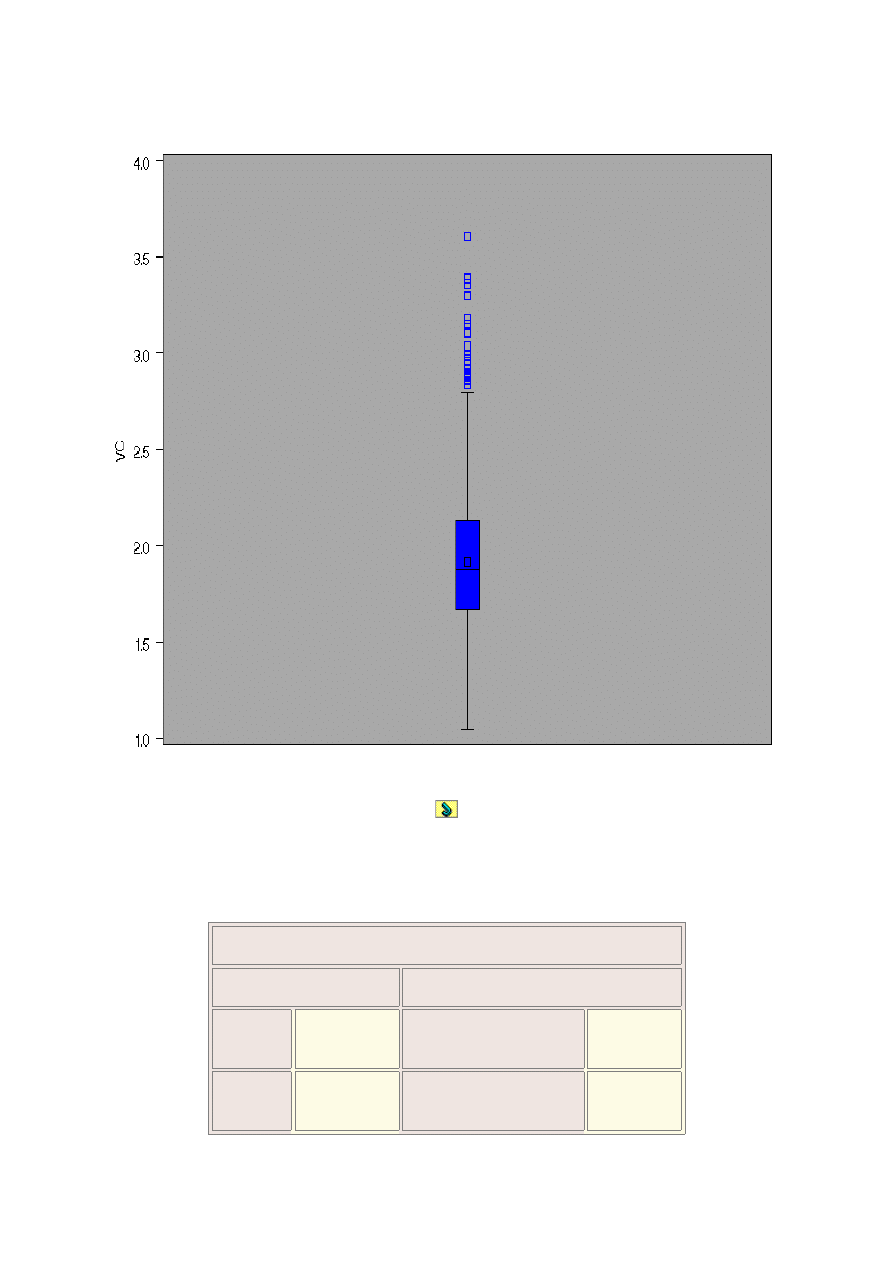
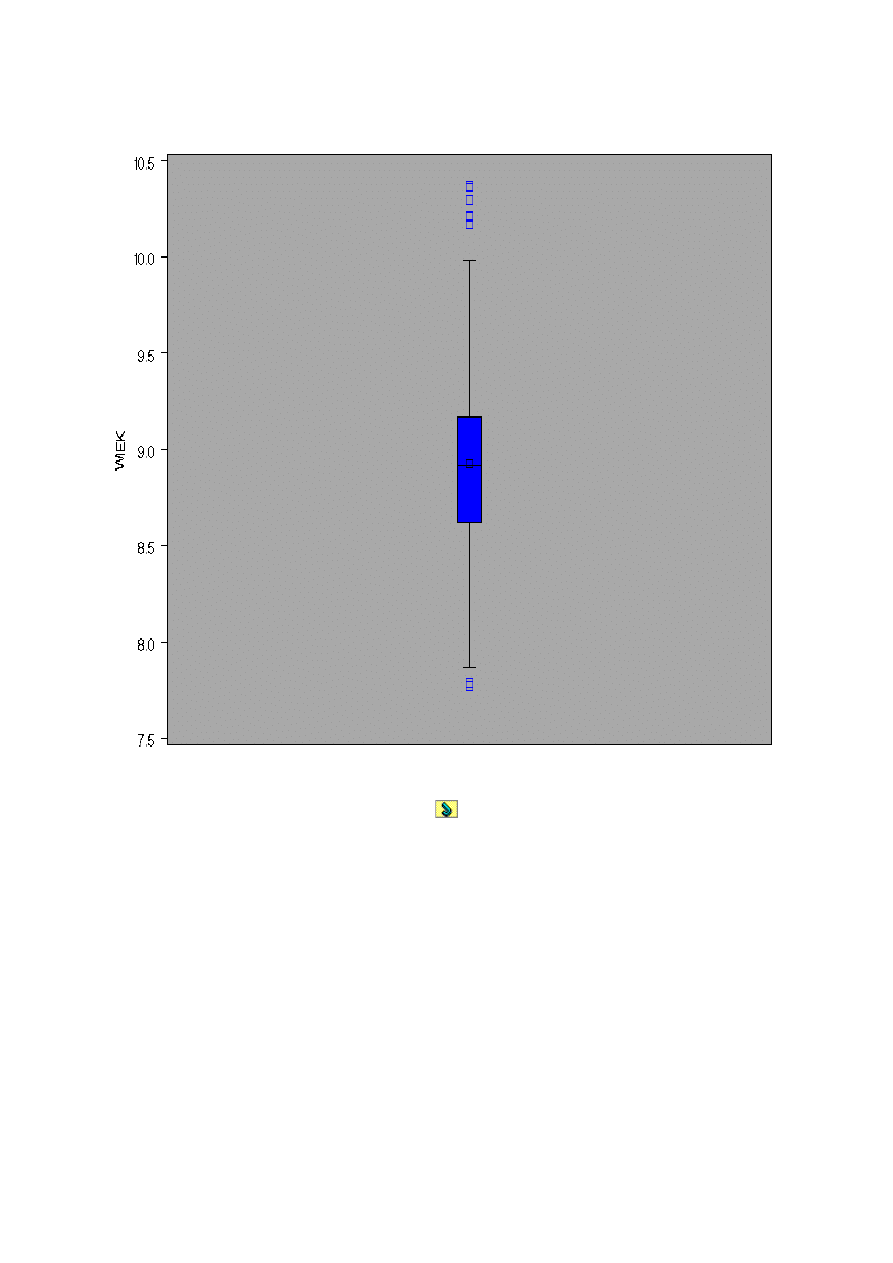
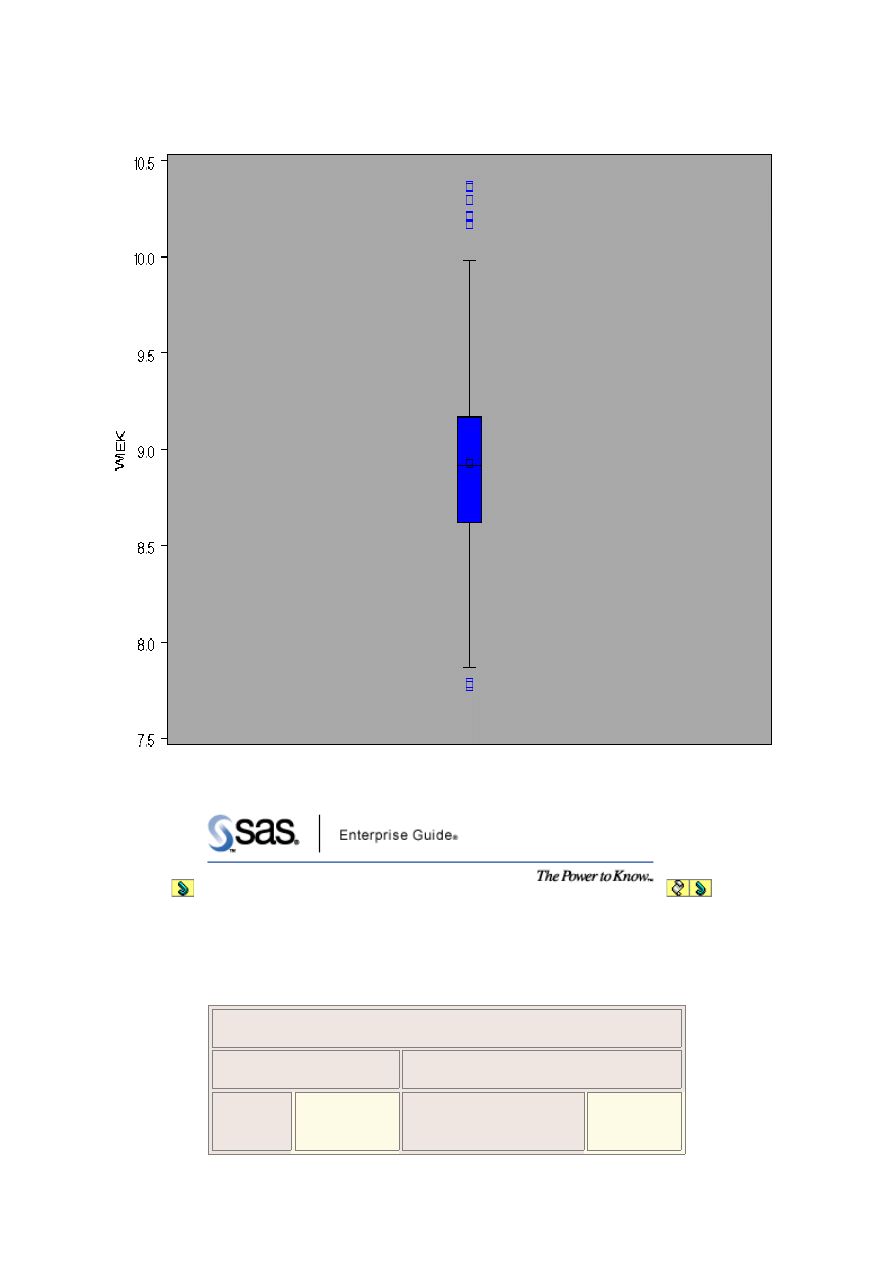
parametrach, wykresy mediana kwartale (pudełkowe z
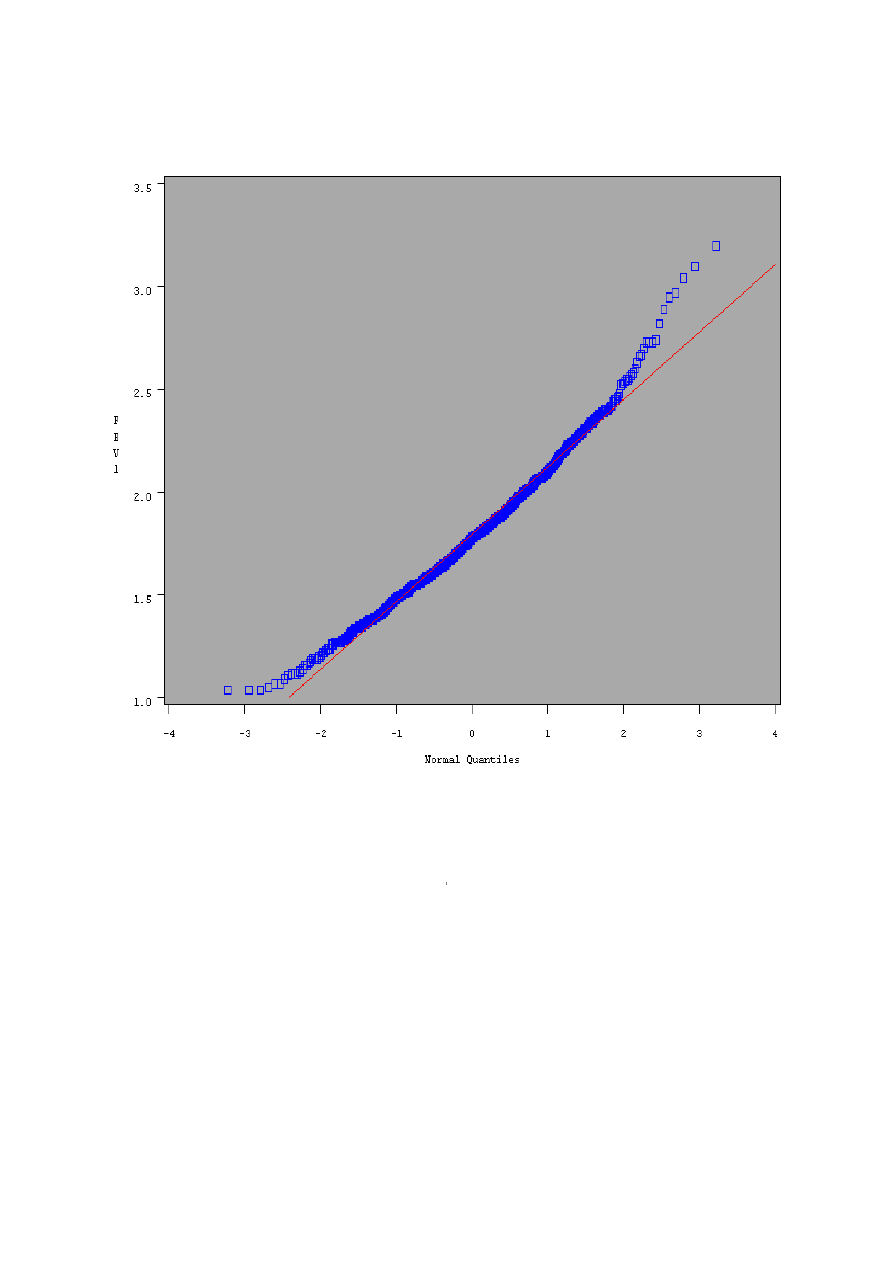
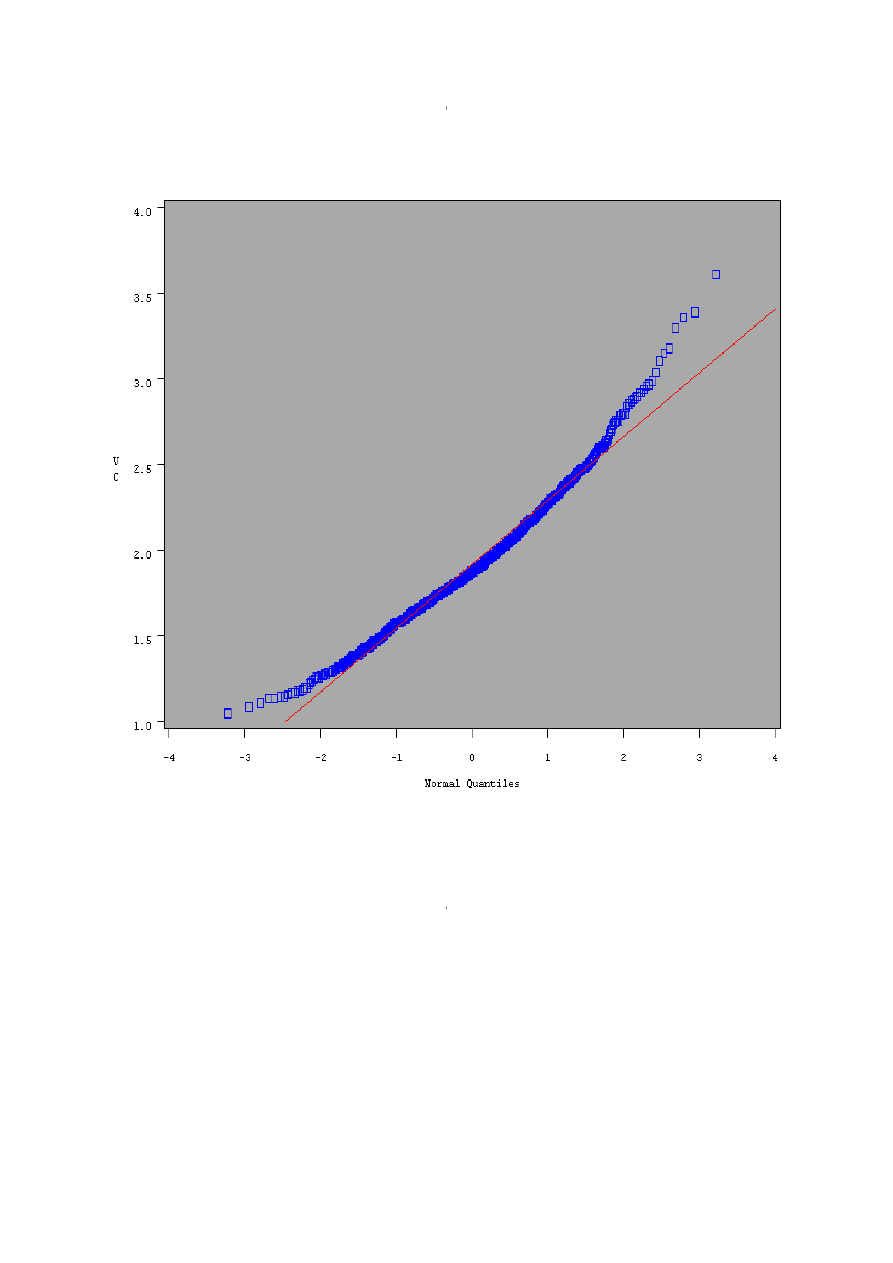
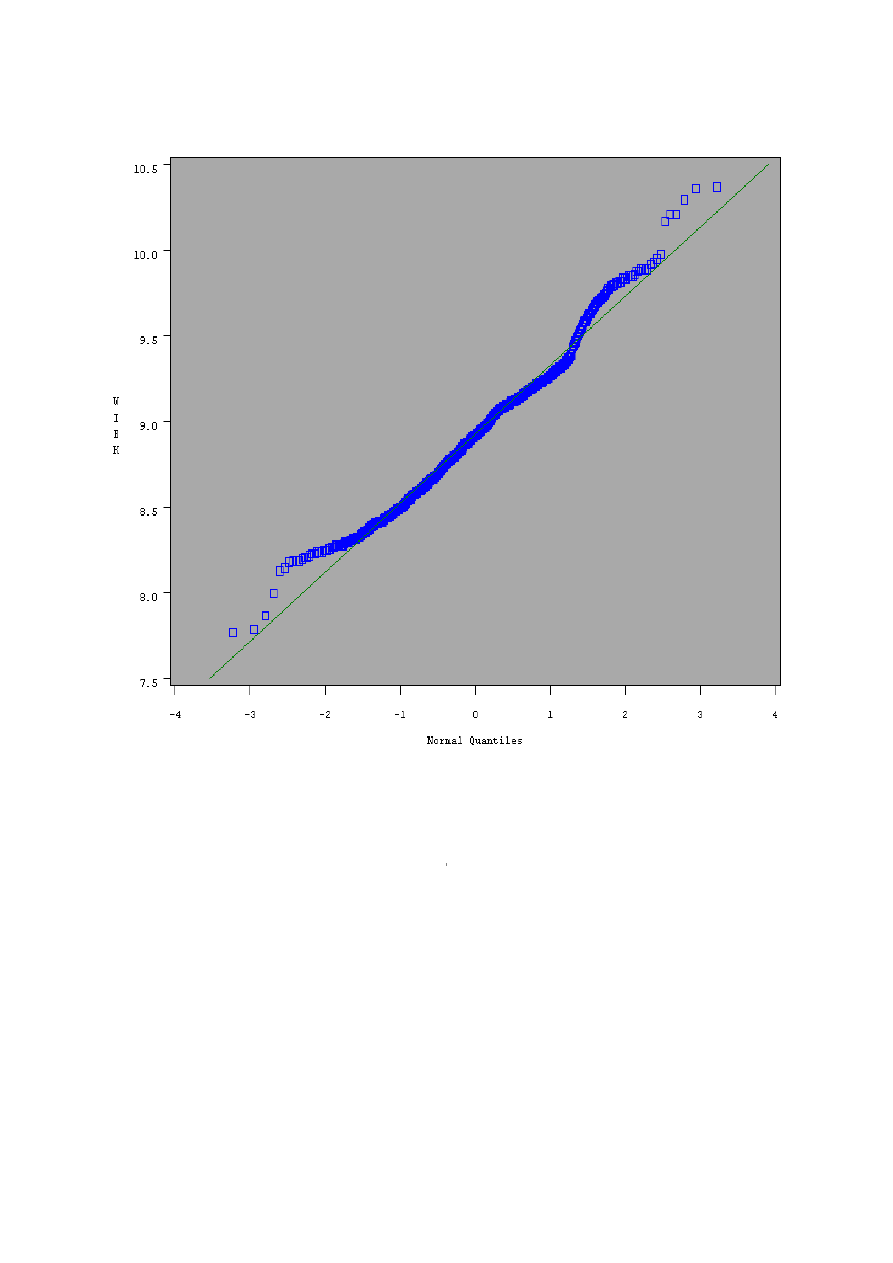
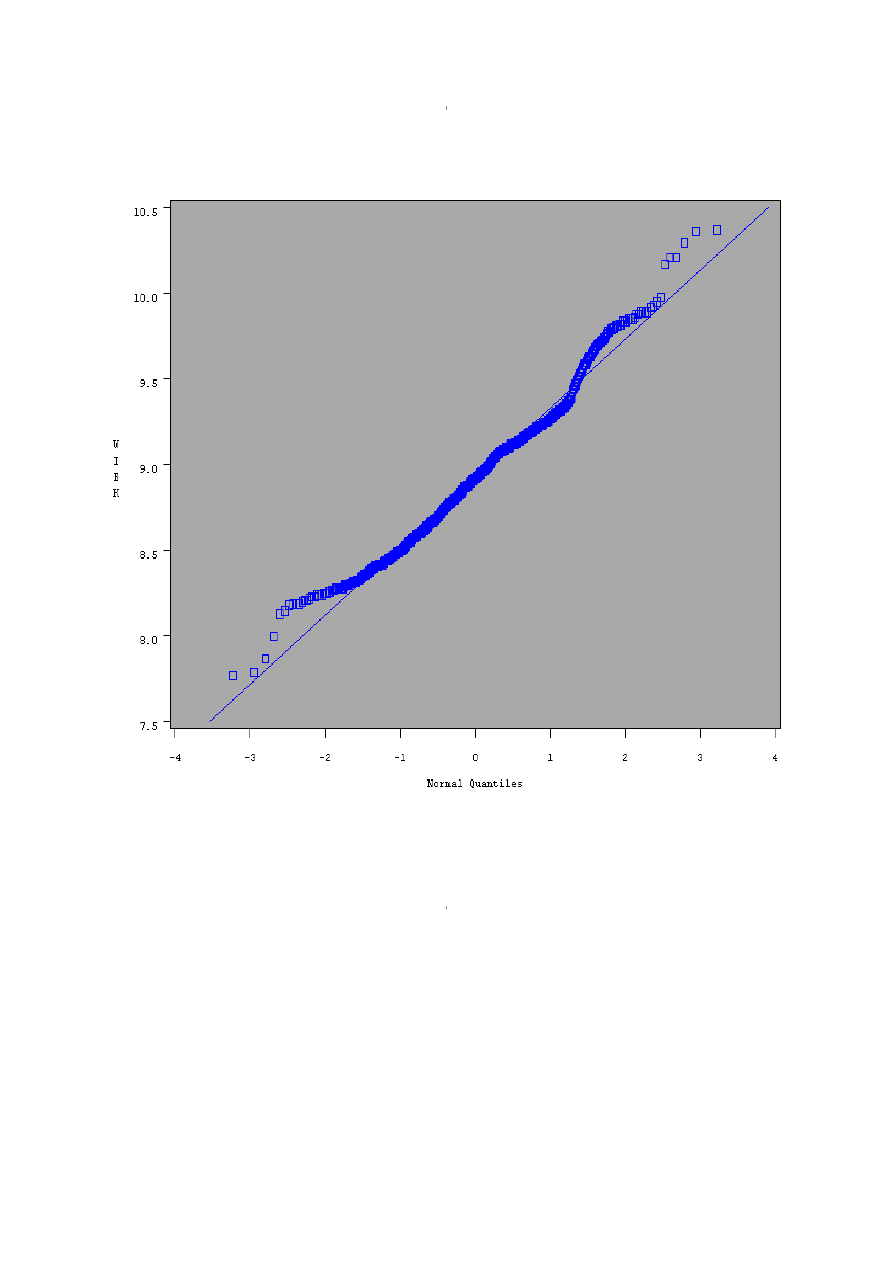
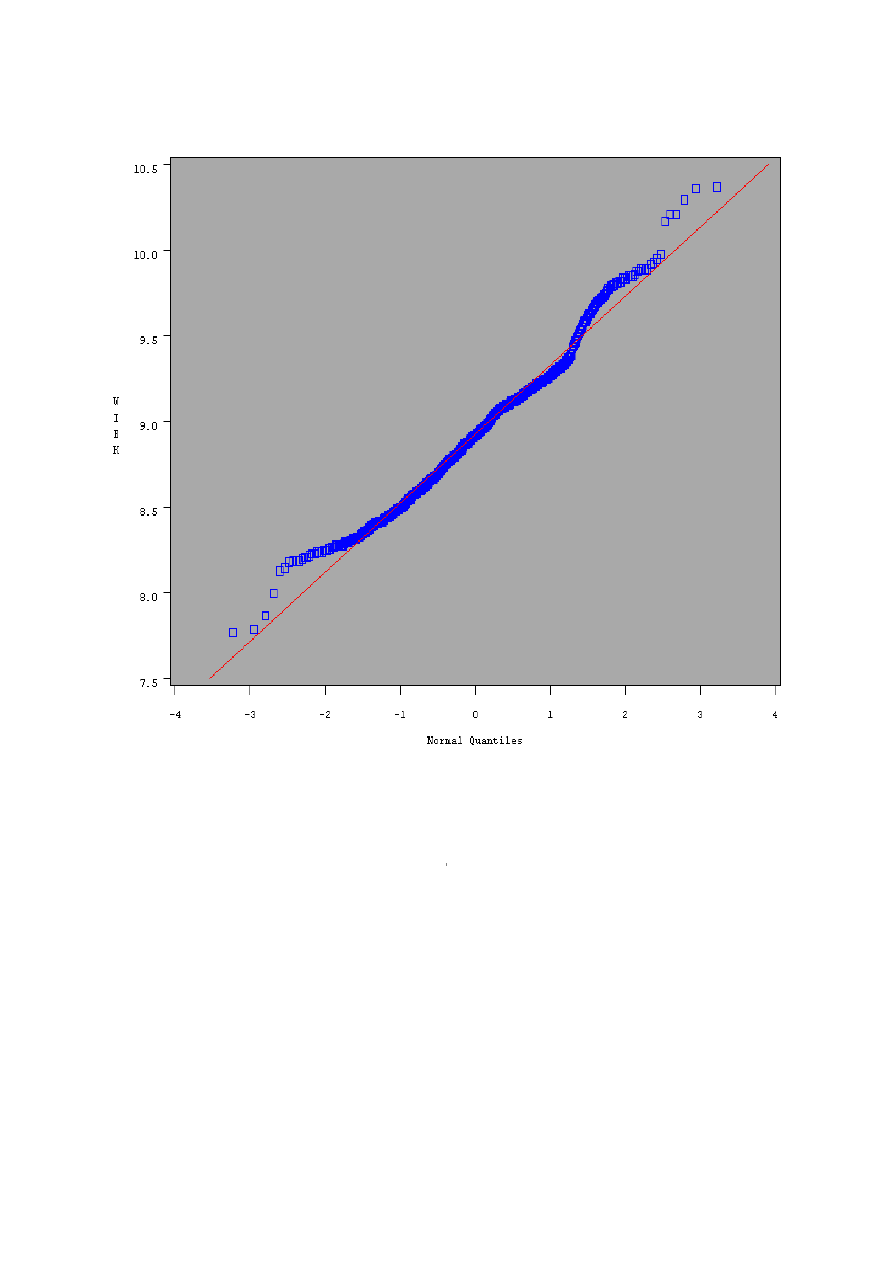
wąsami) oraz wykresy sprawdzające normalność QQ
(kwartyl-kwartyl)
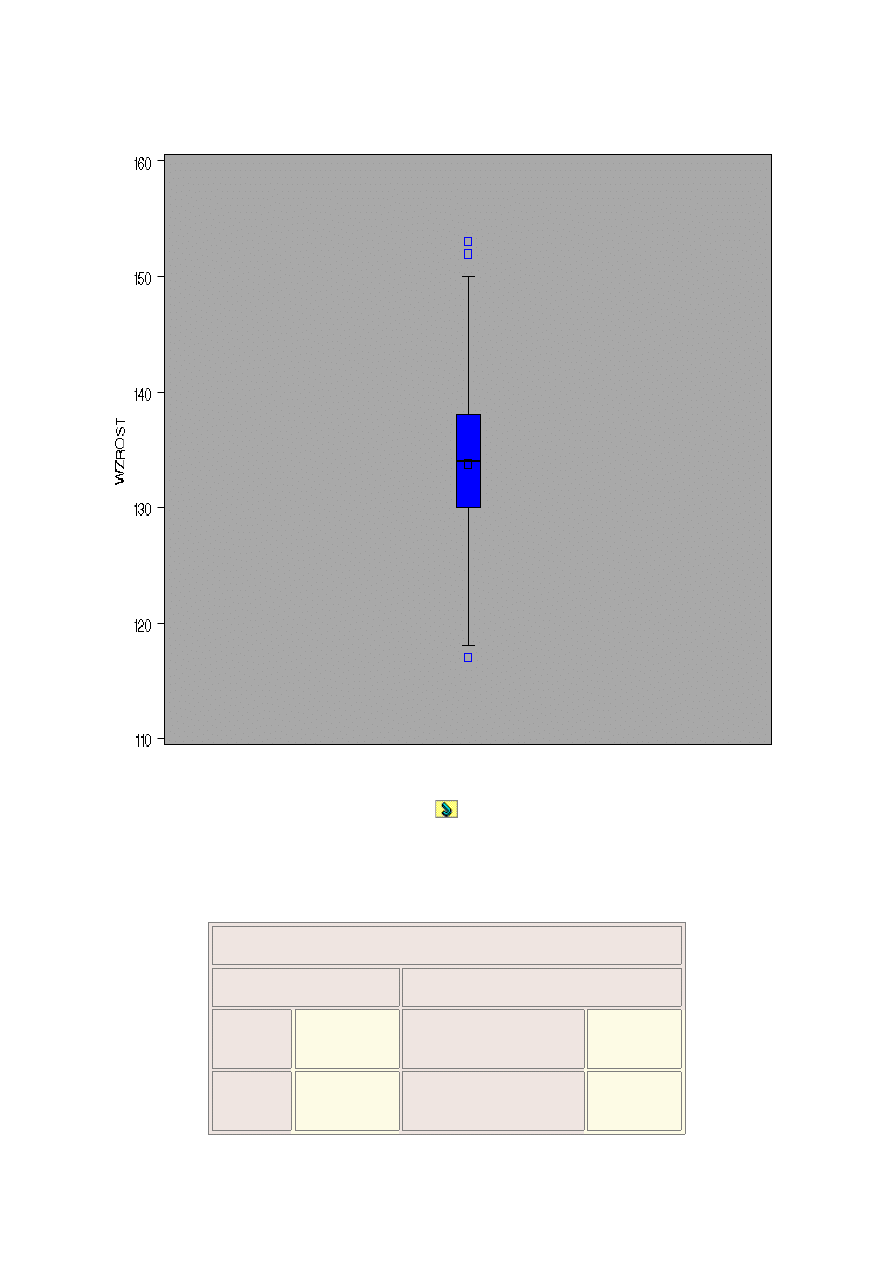
Analiza rozkladu: WZROST
The UNIVARIATE Procedure
Variable: WZROST (WZROST)
Basic Statistical Measures
Location
Variability
Mean
133.750
5
Std Deviation
5.88172
Median
134.000
0
Variance
34.59466
Mode
134.000
0
Range
36.00000
Interquartile Range
8.00000
Basic Confidence Limits Assuming Normality
Parameter
Estimate
95% Confidence Limits
Mean
133.7505
0
133.3851
5
134.11586
Std Deviation
5.88172
5.63453
6.15177
Variance
34.59466
31.74788
37.84431
Tests for Location: Mu0=0
Test
Statistic
p Value

Tests for Location: Mu0=0
Student's t
t
718.383
2
Pr > |t|
<.0001
Sign
M
499
Pr >= |M|
<.0001
Signed Rank
S
249250.
5
Pr >= |S|
<.0001
Wygenerowane przez System SAS (Local, WIN_PRO) dnia 08JUN2004 o godz. 6:46 PM
Analiza rozkladu: WZROST
The UNIVARIATE Procedure
Variable: WZROST (WZROST)
Wygenerowane przez System SAS (Local, WIN_PRO) dnia 08JUN2004 o godz. 6:46 PM
Analiza rozkladu: WZROST
The UNIVARIATE Procedure
Fitted Distribution for WZROST
Parameters for Normal Distribution
Parameter
Symbol
Estimate
Mean
Mu
133.7505

Parameters for Normal Distribution
Std Dev
Sigma
5.881722
Goodness-of-Fit Tests for Normal Distribution
Test
Statistic
p Value
Kolmogorov-Smirnov
D
0.0501513
6
Pr > D
<0.010
Cramer-von Mises
W-Sq
0.3068100
3
Pr > W-Sq
<0.005
Anderson-Darling
A-Sq
1.7379967
9
Pr > A-Sq
<0.005
Quantiles for Normal Distribution
Percent
Quantile
Observed
Estimated
1.0
121.000
120.068
5.0
124.000
124.076
10.0
126.000
126.213
25.0
130.000
129.783
50.0
134.000
133.751
75.0
138.000
137.718
90.0
142.000
141.288
95.0
144.000
143.425
99.0
148.000
147.433
Wygenerowane przez System SAS (Local, WIN_PRO) dnia 08JUN2004 o godz. 6:46 PM

Analiza rozkladu: WZROST
Wygenerowane przez System SAS (Local, WIN_PRO) dnia 08JUN2004 o godz. 6:46 PM
Analiza rozkladu: WZROST

Wygenerowane przez System SAS (Local, WIN_PRO) dnia 08JUN2004 o godz. 6:46 PM
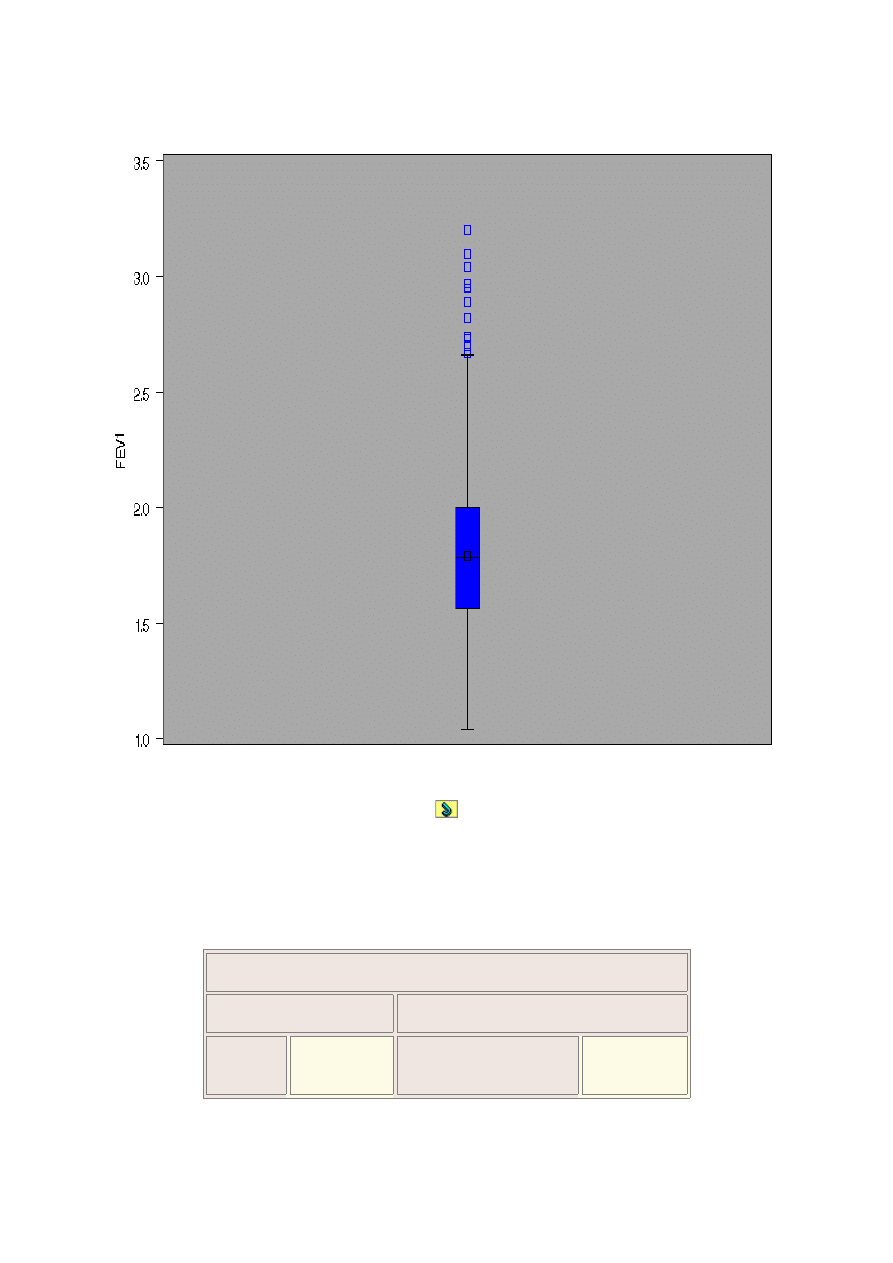
Analiza rozkladu: FEV1
The UNIVARIATE Procedure
Variable: FEV1 (FEV1)
Basic Statistical Measures
Location
Variability
Mean
1.79331
7
Std Deviation
0.32832
Median
1.78000
0
Variance
0.10780

Basic Statistical Measures
Mode
1.55000
0
Range
2.16000
Interquartile Range
0.44000
Basic Confidence Limits Assuming Normality
Parameter
Estimate
95% Confidence Limits
Mean
1.7933
2
1.77292
1.81371
Std Deviation
0.3283
2
0.31452
0.34340
Variance
0.1078
0
0.09893
0.11792
Tests for Location: Mu0=0
Test
Statistic
p Value
Student's t
t
172.552
6
Pr > |t|
<.0001
Sign
M
499
Pr >= |M|
<.0001
Signed Rank
S
249250.
5
Pr >= |S|
<.0001
Wygenerowane przez System SAS (Local, WIN_PRO) dnia 08JUN2004 o godz. 6:47 PM
Analiza rozkladu: FEV1
The UNIVARIATE Procedure
Variable: FEV1 (FEV1)
Wygenerowane przez System SAS (Local, WIN_PRO) dnia 08JUN2004 o godz. 6:47 PM
Analiza rozkladu: FEV1
The UNIVARIATE Procedure
Fitted Distribution for FEV1
Parameters for Normal Distribution
Parameter
Symbol
Estimate
Mean
Mu
1.793317

Parameters for Normal Distribution
Std Dev
Sigma
0.328323
Goodness-of-Fit Tests for Normal Distribution
Test
Statistic
p Value
Kolmogorov-Smirnov
D
0.0485254
7
Pr > D
<0.010
Cramer-von Mises
W-Sq
0.4531372
4
Pr > W-Sq
<0.005
Anderson-Darling
A-Sq
2.8223940
4
Pr > A-Sq
<0.005
Quantiles for Normal Distribution
Percent
Quantile
Observed
Estimated
1.0
1.12000
1.02952
5.0
1.29000
1.25327
10.0
1.39000
1.37255
25.0
1.56000
1.57187
50.0
1.78000
1.79332
75.0
2.00000
2.01477
90.0
2.23000
2.21408
95.0
2.37000
2.33336
99.0
2.73000
2.55711
Wygenerowane przez System SAS (Local, WIN_PRO) dnia 08JUN2004 o godz. 6:47 PM
Analiza rozkladu: FEV1
Wygenerowane przez System SAS (Local, WIN_PRO) dnia 08JUN2004 o godz. 6:47 PM
Analiza rozkladu: FEV1
Wygenerowane przez System SAS (Local, WIN_PRO) dnia 08JUN2004 o godz. 6:47 PM
Analiza rozkladu: WZROST
The UNIVARIATE Procedure
Variable: WZROST (WZROST)
Basic Statistical Measures
Location
Variability
Mean
133.750
5
Std Deviation
5.88172

Basic Statistical Measures
Median
134.000
0
Variance
34.59466
Mode
134.000
0
Range
36.00000
Interquartile Range
8.00000
Basic Confidence Limits Assuming Normality
Parameter
Estimate
95% Confidence Limits
Mean
133.7505
0
133.3851
5
134.11586
Std Deviation
5.88172
5.63453
6.15177
Variance
34.59466
31.74788
37.84431
Tests for Location: Mu0=0
Test
Statistic
p Value
Student's t
t
718.383
2
Pr > |t|
<.0001
Sign
M
499
Pr >= |M|
<.0001
Signed Rank
S
249250.
5
Pr >= |S|
<.0001
Wygenerowane przez System SAS (Local, WIN_PRO) dnia 08JUN2004 o godz. 6:46 PM
Analiza rozkladu: WZROST
The UNIVARIATE Procedure
Variable: WZROST (WZROST)

Wygenerowane przez System SAS (Local, WIN_PRO) dnia 08JUN2004 o godz. 6:46 PM
Analiza rozkladu: WZROST
The UNIVARIATE Procedure
Fitted Distribution for WZROST
Parameters for Normal Distribution
Parameter
Symbol
Estimate
Mean
Mu
133.7505

Parameters for Normal Distribution
Std Dev
Sigma
5.881722
Goodness-of-Fit Tests for Normal Distribution
Test
Statistic
p Value
Kolmogorov-Smirnov
D
0.0501513
6
Pr > D
<0.010
Cramer-von Mises
W-Sq
0.3068100
3
Pr > W-Sq
<0.005
Anderson-Darling
A-Sq
1.7379967
9
Pr > A-Sq
<0.005
Quantiles for Normal Distribution
Percent
Quantile
Observed
Estimated
1.0
121.000
120.068
5.0
124.000
124.076
10.0
126.000
126.213
25.0
130.000
129.783
50.0
134.000
133.751
75.0
138.000
137.718
90.0
142.000
141.288
95.0
144.000
143.425
99.0
148.000
147.433
Wygenerowane przez System SAS (Local, WIN_PRO) dnia 08JUN2004 o godz. 6:46 PM
Analiza rozkladu: WZROST
Wygenerowane przez System SAS (Local, WIN_PRO) dnia 08JUN2004 o godz. 6:46 PM
Analiza rozkladu: WZROST
Wygenerowane przez System SAS (Local, WIN_PRO) dnia 08JUN2004 o godz. 6:46 PM
Analiza rozkladu: FEV1
The UNIVARIATE Procedure
Variable: FEV1 (FEV1)
Basic Statistical Measures
Location
Variability
Mean
1.79331
7
Std Deviation
0.32832
Median
1.78000
0
Variance
0.10780
Basic Statistical Measures
Mode
1.55000
0
Range
2.16000
Interquartile Range
0.44000
Basic Confidence Limits Assuming Normality
Parameter
Estimate
95% Confidence Limits
Mean
1.7933
2
1.77292
1.81371
Std Deviation
0.3283
2
0.31452
0.34340
Variance
0.1078
0
0.09893
0.11792
Tests for Location: Mu0=0
Test
Statistic
p Value
Student's t
t
172.552
6
Pr > |t|
<.0001
Sign
M
499
Pr >= |M|
<.0001
Signed Rank
S
249250.
5
Pr >= |S|
<.0001
Wygenerowane przez System SAS (Local, WIN_PRO) dnia 08JUN2004 o godz. 6:47 PM
Analiza rozkladu: FEV1
The UNIVARIATE Procedure
Variable: FEV1 (FEV1)

Wygenerowane przez System SAS (Local, WIN_PRO) dnia 08JUN2004 o godz. 6:47 PM
Analiza rozkladu: FEV1
The UNIVARIATE Procedure
Fitted Distribution for FEV1
Parameters for Normal Distribution
Parameter
Symbol
Estimate
Mean
Mu
1.793317
Parameters for Normal Distribution
Std Dev
Sigma
0.328323
Goodness-of-Fit Tests for Normal Distribution
Test
Statistic
p Value
Kolmogorov-Smirnov
D
0.0485254
7
Pr > D
<0.010
Cramer-von Mises
W-Sq
0.4531372
4
Pr > W-Sq
<0.005
Anderson-Darling
A-Sq
2.8223940
4
Pr > A-Sq
<0.005
Quantiles for Normal Distribution
Percent
Quantile
Observed
Estimated
1.0
1.12000
1.02952
5.0
1.29000
1.25327
10.0
1.39000
1.37255
25.0
1.56000
1.57187
50.0
1.78000
1.79332
75.0
2.00000
2.01477
90.0
2.23000
2.21408
95.0
2.37000
2.33336
99.0
2.73000
2.55711
Wygenerowane przez System SAS (Local, WIN_PRO) dnia 08JUN2004 o godz. 6:47 PM

Analiza rozkladu: FEV1
Wygenerowane przez System SAS (Local, WIN_PRO) dnia 08JUN2004 o godz. 6:47 PM
Analiza rozkladu: FEV1
Wygenerowane przez System SAS (Local, WIN_PRO) dnia 08JUN2004 o godz. 6:47 PM
Analiza rozkladu: VC
The UNIVARIATE Procedure
Variable: VC (VC)
Basic Statistical Measures
Location
Variability
Mean
1.91643
3
Std Deviation
0.37229

Basic Statistical Measures
Median
1.88000
0
Variance
0.13860
Mode
1.58000
0
Range
2.56000
Interquartile Range
0.46000
NOTE: The mode displayed is the smallest of 2 modes with a count of 18.
Basic Confidence Limits Assuming Normality
Parameter
Estimate
95% Confidence Limits
Mean
1.9164
3
1.89331
1.93956
Std Deviation
0.3722
9
0.35665
0.38939
Variance
0.1386
0
0.12720
0.15162
Tests for Location: Mu0=0
Test
Statistic
p Value
Student's t
t
162.619
3
Pr > |t|
<.0001
Sign
M
499
Pr >= |M|
<.0001
Signed Rank
S
249250.
5
Pr >= |S|
<.0001
Wygenerowane przez System SAS (Local, WIN_PRO) dnia 08JUN2004 o godz. 6:47 PM
Analiza rozkladu: VC
The UNIVARIATE Procedure
Variable: VC (VC)
Wygenerowane przez System SAS (Local, WIN_PRO) dnia 08JUN2004 o godz. 6:47 PM
Analiza rozkladu: VC
The UNIVARIATE Procedure
Fitted Distribution for VC
Parameters for Normal Distribution
Parameter
Symbol
Estimate
Parameters for Normal Distribution
Mean
Mu
1.916433
Std Dev
Sigma
0.372295
Goodness-of-Fit Tests for Normal Distribution
Test
Statistic
p Value
Kolmogorov-Smirnov
D
0.0610011
8
Pr > D
<0.010
Cramer-von Mises
W-Sq
0.8096220
5
Pr > W-Sq
<0.005
Anderson-Darling
A-Sq
4.6536144
3
Pr > A-Sq
<0.005
Quantiles for Normal Distribution
Percent
Quantile
Observed
Estimated
1.0
1.17000
1.05035
5.0
1.35000
1.30406
10.0
1.47000
1.43932
25.0
1.67000
1.66532
50.0
1.88000
1.91643
75.0
2.13000
2.16754
90.0
2.40000
2.39355
95.0
2.57000
2.52880
99.0
2.97000
2.78252
Wygenerowane przez System SAS (Local, WIN_PRO) dnia 08JUN2004 o godz. 6:47 PM
Analiza rozkladu: VC
Wygenerowane przez System SAS (Local, WIN_PRO) dnia 08JUN2004 o godz. 6:47 PM
Analiza rozkladu: VC
Wygenerowane przez System SAS (Local, WIN_PRO) dnia 08JUN2004 o godz. 6:47 PM
Analiza rozkladu: WIEK
The UNIVARIATE Procedure
Variable: WIEK (WIEK)
Basic Statistical Measures
Location
Variability
Mean
8.92655
3
Std Deviation
0.40308
Median
8.92000
0
Variance
0.16248

Basic Statistical Measures
Mode
9.10000
0
Range
2.60000
Interquartile Range
0.55000
Basic Confidence Limits Assuming Normality
Parameter
Estimate
95% Confidence Limits
Mean
8.9265
5
8.90151
8.95159
Std Deviation
0.4030
8
0.38614
0.42159
Variance
0.1624
8
0.14911
0.17774
Tests for Location: Mu0=0
Test
Statistic
p Value
Student's t
t
699.609
3
Pr > |t|
<.0001
Sign
M
499
Pr >= |M|
<.0001
Signed Rank
S
249250.
5
Pr >= |S|
<.0001
Wygenerowane przez System SAS (Local, WIN_PRO) dnia 08JUN2004 o godz. 6:43 PM
Analiza rozkladu: WIEK
The UNIVARIATE Procedure
Variable: WIEK (WIEK)

Wygenerowane przez System SAS (Local, WIN_PRO) dnia 08JUN2004 o godz. 6:43 PM
Analiza rozkladu: WIEK
The UNIVARIATE Procedure
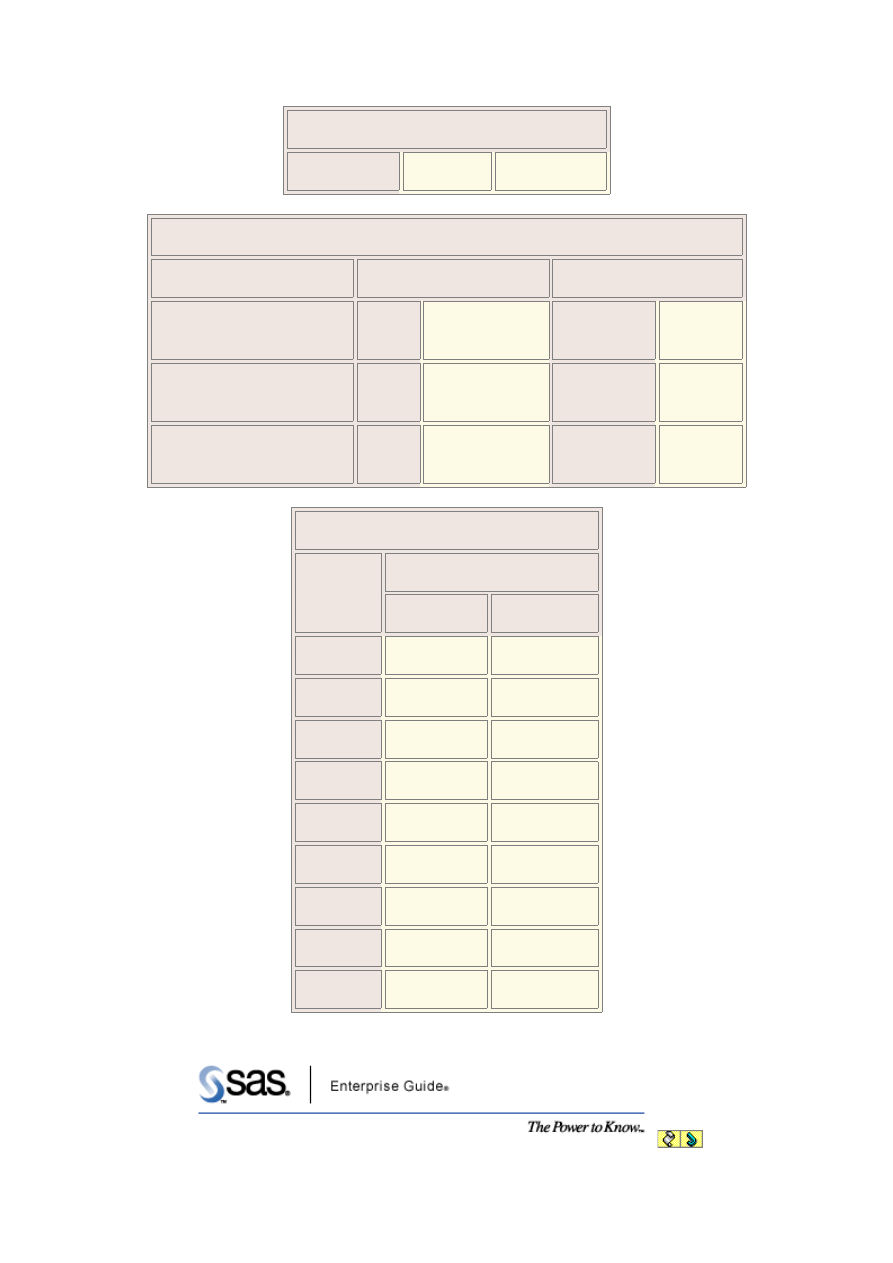
Fitted Distributions for WIEK
Parameters for Normal Distribution
Parameter
Symbol
Estimate
Mean
Mu
8.926553

Parameters for Normal Distribution
Std Dev
Sigma
0.403082
Goodness-of-Fit Tests for Normal Distribution
Test
Statistic
p Value
Kolmogorov-Smirnov
D
0.0438162
2
Pr > D
<0.010
Cramer-von Mises
W-Sq
0.3490865
6
Pr > W-Sq
<0.005
Anderson-Darling
A-Sq
3.3534023
2
Pr > A-Sq
<0.005
Quantiles for Normal Distribution
Percent
Quantile
Observed
Estimated
1.0
8.19000
7.98884
5.0
8.31000
8.26354
10.0
8.41000
8.40998
25.0
8.62000
8.65468
50.0
8.92000
8.92655
75.0
9.17000
9.19843
90.0
9.39000
9.44312
95.0
9.71000
9.58956
99.0
9.92000
9.86426
Wygenerowane przez System SAS (Local, WIN_PRO) dnia 08JUN2004 o godz. 6:43 PM
Analiza rozkladu: WIEK
The UNIVARIATE Procedure
Fitted Distributions for WIEK
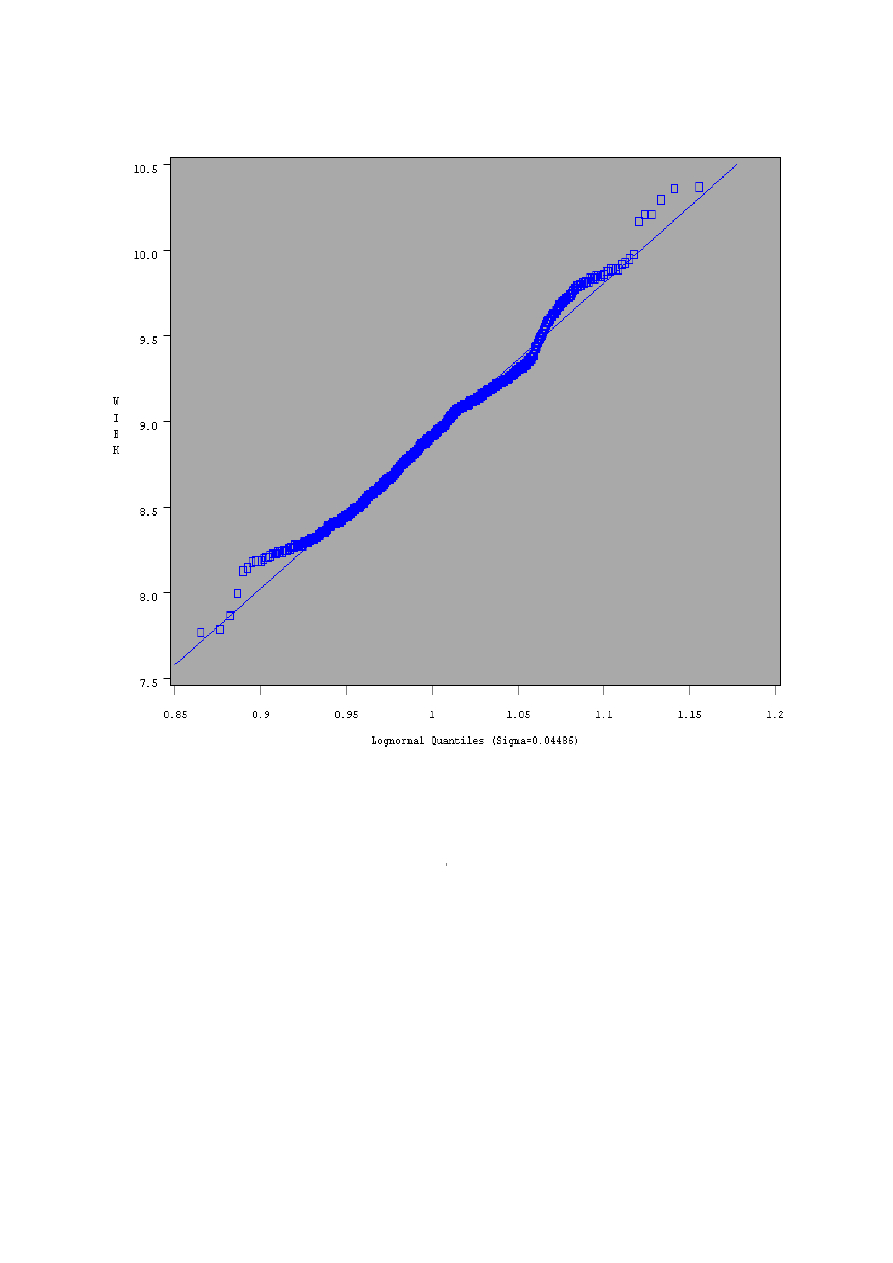
Parameters for Lognormal Distribution
Parameter
Symbol
Estimate
Threshold
Theta
0
Scale
Zeta
2.188021
Shape
Sigma
0.04486
Mean
8.926526
Std Dev
0.400648
Goodness-of-Fit Tests for Lognormal Distribution
Test
Statistic
p Value
Kolmogorov-Smirnov
D
0.0399378
9
Pr > D
<0.010
Cramer-von Mises
W-Sq
0.2839178
2
Pr > W-Sq
<0.005
Anderson-Darling
A-Sq
2.5758495
7
Pr > A-Sq
<0.005
Quantiles for Lognormal Distribution
Percent
Quantile
Observed
Estimated
1.0
8.19000
8.03382
5.0
8.31000
8.28322
10.0
8.41000
8.41933
25.0
8.62000
8.65176

Quantiles for Lognormal Distribution
50.0
8.92000
8.91755
75.0
9.17000
9.19150
90.0
9.39000
9.44525
95.0
9.71000
9.60045
99.0
9.92000
9.89849
Wygenerowane przez System SAS (Local, WIN_PRO) dnia 08JUN2004 o godz. 6:43 PM
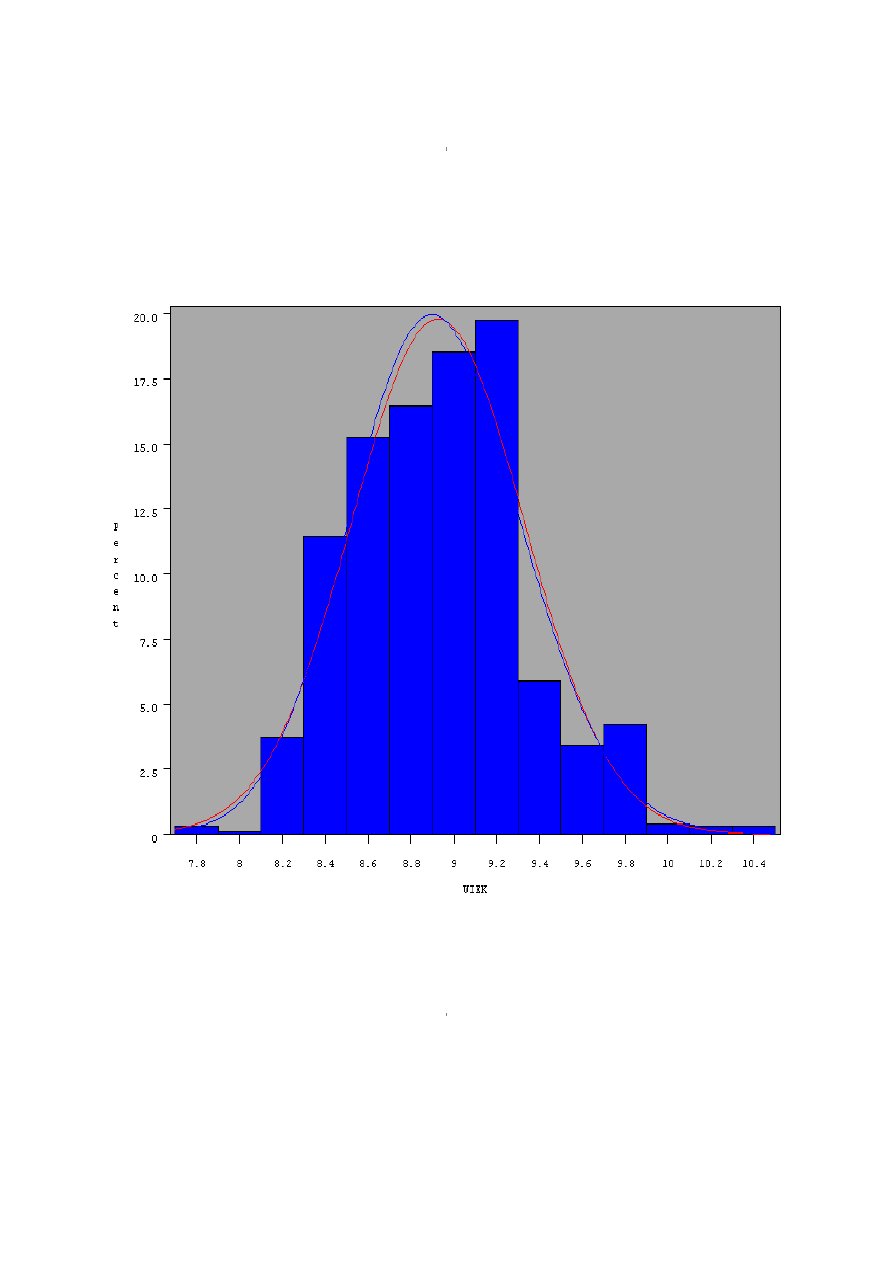
Dodanie oprócz porównania rozkładem normalnym
także rozkładu logarytmiczno-normalnego:
Analiza rozkladu: WIEK

Wygenerowane przez System SAS (Local, WIN_PRO) dnia 08JUN2004 o godz. 6:43 PM
Analiza rozkladu: WIEK
Wygenerowane przez System SAS (Local, WIN_PRO) dnia 08JUN2004 o godz. 6:43 PM
Analiza rozkladu: WIEK
Wygenerowane przez System SAS (Local, WIN_PRO) dnia 08JUN2004 o godz. 6:43 PM
Analiza rozkladu: WIEK
The UNIVARIATE Procedure
Variable: WIEK (WIEK)
Basic Statistical Measures
Location
Variability
Mean
8.92655
3
Std Deviation
0.40308
Median
8.92000
0
Variance
0.16248
Mode
9.10000
0
Range
2.60000
Interquartile Range
0.55000
Basic Confidence Limits Assuming Normality
Parameter
Estimate
95% Confidence Limits
Mean
8.9265
5
8.90151
8.95159
Std Deviation
0.4030
8
0.38614
0.42159
Variance
0.1624
8
0.14911
0.17774
Tests for Location: Mu0=0
Test
Statistic
p Value
Student's t
t
699.609
3
Pr > |t|
<.0001
Sign
M
499
Pr >= |M|
<.0001
Signed Rank
S
249250.
5
Pr >= |S|
<.0001
Wygenerowane przez System SAS (Local, WIN_PRO) dnia 08JUN2004 o godz. 6:42 PM
Analiza rozkladu: WIEK
The UNIVARIATE Procedure
Variable: WIEK (WIEK)
Wygenerowane przez System SAS (Local, WIN_PRO) dnia 08JUN2004 o godz. 6:42 PM
Analiza rozkladu: WIEK
The UNIVARIATE Procedure
Fitted Distribution for WIEK
Parameters for Normal Distribution
Parameter
Symbol
Estimate

Parameters for Normal Distribution
Mean
Mu
8.926553
Std Dev
Sigma
0.403082
Goodness-of-Fit Tests for Normal Distribution
Test
Statistic
p Value
Kolmogorov-Smirnov
D
0.0438162
2
Pr > D
<0.010
Cramer-von Mises
W-Sq
0.3490865
6
Pr > W-Sq
<0.005
Anderson-Darling
A-Sq
3.3534023
2
Pr > A-Sq
<0.005
Quantiles for Normal Distribution
Percent
Quantile
Observed
Estimated
1.0
8.19000
7.98884
5.0
8.31000
8.26354
10.0
8.41000
8.40998
25.0
8.62000
8.65468
50.0
8.92000
8.92655
75.0
9.17000
9.19843
90.0
9.39000
9.44312
95.0
9.71000
9.58956
99.0
9.92000
9.86426
Wygenerowane przez System SAS (Local, WIN_PRO) dnia 08JUN2004 o godz. 6:42 PM
Analiza rozkladu: WIEK
Wygenerowane przez System SAS (Local, WIN_PRO) dnia 08JUN2004 o godz. 6:42 PM
Analiza rozkladu: WIEK
Wygenerowane przez System SAS (Local, WIN_PRO) dnia 08JUN2004 o godz. 6:42 PM
Analiza rozkladu: WIEK
The UNIVARIATE Procedure
Variable: WIEK (WIEK)
Basic Statistical Measures
Location
Variability
Mean
8.92655
3
Std Deviation
0.40308

Basic Statistical Measures
Median
8.92000
0
Variance
0.16248
Mode
9.10000
0
Range
2.60000
Interquartile Range
0.55000
Basic Confidence Limits Assuming Normality
Parameter
Estimate
95% Confidence Limits
Mean
8.9265
5
8.90151
8.95159
Std Deviation
0.4030
8
0.38614
0.42159
Variance
0.1624
8
0.14911
0.17774
Tests for Location: Mu0=0
Test
Statistic
p Value
Student's t
t
699.609
3
Pr > |t|
<.0001
Sign
M
499
Pr >= |M|
<.0001
Signed Rank
S
249250.
5
Pr >= |S|
<.0001
Wygenerowane przez System SAS (Local, WIN_PRO) dnia 08JUN2004 o godz. 6:43 PM
Analiza rozkladu: WIEK
The UNIVARIATE Procedure
Variable: WIEK (WIEK)
Wygenerowane przez System SAS (Local, WIN_PRO) dnia 08JUN2004 o godz. 6:43 PM
Analiza rozkladu: WIEK
The UNIVARIATE Procedure
Fitted Distributions for WIEK
Parameters for Normal Distribution
Parameter
Symbol
Estimate
Mean
Mu
8.926553
Parameters for Normal Distribution
Std Dev
Sigma
0.403082
Goodness-of-Fit Tests for Normal Distribution
Test
Statistic
p Value
Kolmogorov-Smirnov
D
0.0438162
2
Pr > D
<0.010
Cramer-von Mises
W-Sq
0.3490865
6
Pr > W-Sq
<0.005
Anderson-Darling
A-Sq
3.3534023
2
Pr > A-Sq
<0.005
Quantiles for Normal Distribution
Percent
Quantile
Observed
Estimated
1.0
8.19000
7.98884
5.0
8.31000
8.26354
10.0
8.41000
8.40998
25.0
8.62000
8.65468
50.0
8.92000
8.92655
75.0
9.17000
9.19843
90.0
9.39000
9.44312
95.0
9.71000
9.58956
99.0
9.92000
9.86426
Wygenerowane przez System SAS (Local, WIN_PRO) dnia 08JUN2004 o godz. 6:43 PM

Analiza rozkladu: WIEK
The UNIVARIATE Procedure
Variable: WIEK (WIEK)
Basic Statistical Measures
Location
Variability
Mean
8.92655
3
Std Deviation
0.40308
Median
8.92000
0
Variance
0.16248
Mode
9.10000
0
Range
2.60000
Interquartile Range
0.55000
Basic Confidence Limits Assuming Normality
Parameter
Estimate
95% Confidence Limits
Mean
8.9265
5
8.90151
8.95159
Std Deviation
0.4030
8
0.38614
0.42159
Variance
0.1624
8
0.14911
0.17774
Tests for Location: Mu0=0
Test
Statistic
p Value
Student's t
t
699.609
3
Pr > |t|
<.0001
Sign
M
499
Pr >= |M|
<.0001
Signed Rank
S
249250.
5
Pr >= |S|
<.0001
Wygenerowane przez System SAS (Local, WIN_PRO) dnia 08JUN2004 o godz. 7:12 PM
Analiza rozkladu: WIEK
The UNIVARIATE Procedure
Variable: WIEK (WIEK)
Wygenerowane przez System SAS (Local, WIN_PRO) dnia 08JUN2004 o godz. 7:12 PM
Analiza rozkladu: WIEK
The UNIVARIATE Procedure
Fitted Distributions for WIEK
Parameters for Normal Distribution
Parameter
Symbol
Estimate
Mean
Mu
8.926553
Std Dev
Sigma
0.403082
Goodness-of-Fit Tests for Normal Distribution
Test
Statistic
p Value
Kolmogorov-Smirnov
D
0.0438162
2
Pr > D
<0.010
Cramer-von Mises
W-Sq
0.3490865
6
Pr > W-Sq
<0.005
Anderson-Darling
A-Sq
3.3534023
2
Pr > A-Sq
<0.005
Quantiles for Normal Distribution
Percent
Quantile
Observed
Estimated
1.0
8.19000
7.98884
5.0
8.31000
8.26354
10.0
8.41000
8.40998
25.0
8.62000
8.65468
50.0
8.92000
8.92655
75.0
9.17000
9.19843
90.0
9.39000
9.44312
95.0
9.71000
9.58956
99.0
9.92000
9.86426
Wygenerowane przez System SAS (Local, WIN_PRO) dnia 08JUN2004 o godz. 7:12 PM
Analiza rozkladu: WIEK
The UNIVARIATE Procedure
Fitted Distributions for WIEK
Parameters for Lognormal Distribution
Parameter
Symbol
Estimate
Threshold
Theta
0
Scale
Zeta
2.188021
Shape
Sigma
0.04486
Mean
8.926526
Std Dev
0.400648
Goodness-of-Fit Tests for Lognormal Distribution
Test
Statistic
p Value
Kolmogorov-Smirnov
D
0.0399378
9
Pr > D
<0.010
Cramer-von Mises
W-Sq
0.2839178
2
Pr > W-Sq
<0.005
Anderson-Darling
A-Sq
2.5758495
7
Pr > A-Sq
<0.005
Quantiles for Lognormal Distribution
Percent
Quantile
Observed
Estimated
1.0
8.19000
8.03382
5.0
8.31000
8.28322
10.0
8.41000
8.41933
Quantiles for Lognormal Distribution
25.0
8.62000
8.65176
50.0
8.92000
8.91755
75.0
9.17000
9.19150
90.0
9.39000
9.44525
95.0
9.71000
9.60045
99.0
9.92000
9.89849
Wygenerowane przez System SAS (Local, WIN_PRO) dnia 08JUN2004 o godz. 7:12 PM
Analiza rozkladu: WIEK
Wygenerowane przez System SAS (Local, WIN_PRO) dnia 08JUN2004 o godz. 7:12 PM
Analiza rozkladu: WIEK
Wygenerowane przez System SAS (Local, WIN_PRO) dnia 08JUN2004 o godz. 7:12 PM
Analiza rozkladu: WIEK

Wygenerowane przez System SAS (Local, WIN_PRO) dnia 08JUN2004 o godz. 7:12 PM
Wyszukiwarka
Podobne podstrony:
zestaw9, Matematyka stosowana, Analiza, Analiza matematyczna dla leniwych
Analiza wskaźnikowa, Dla Studentów, Analiza
analiza ryzyka dla elektronika
zestaw10, Matematyka stosowana, Analiza, Analiza matematyczna dla leniwych
analiza ryzyka dla administracji(1)
Analiza dzwieku dla ucznia
p l o c h Zadania z analizy matematycznej dla semestru I WEL
Analiza regresji między dwiema zmiennymi, Płyta farmacja Bydgoszcz, statystyka, pozostałe
matematyka ROZKŁADMATERIAŁU DLA KLASY I GIMNAZJUM
analiza ryzyka dla kierujacych naukowymi
analiza ryzyka dla zaopatrzeniowca
Analiza regresji między dwiema zmiennymi, Statystyka, statystyka(3)
analiza ryzyka dla lekarza internisty
ANALIZA FUNKCJONALNA DLA CE, Inne
rachunek prawdopodobieństwa, rachl5, Rozkłady, funkcje, parametry zmiennych losowych jedno i dwuwymi
analiza ryzyka dla kierownikow
analiza ryzyka dla bibliotekarza (2)
więcej podobnych podstron