
UNIT 14.11
Basic Confocal Microscopy
Confocal microscopy produces sharp im-
ages of structures within relatively thick speci-
mens (up to several hundred microns). It is
particularly useful for examining fluorescent
specimens. Thick fluorescent specimens
viewed with a conventional widefield fluores-
cent microscope appear blurry and lack contrast
because fluorophores throughout the entire
depth of the specimen are illuminated and fluo-
rescence signals are collected not only from the
plane of focus but also from areas above and
below. Confocal microscopes selectively col-
lect light from thin (
∼1-µm) optical sections
representing single focal planes within the
specimen. Structures within the focal plane
appear more sharply defined than they would
with a conventional microscope because there
is essentially no flare of light from out-of-focus
areas. A three-dimensional view of the speci-
men can be reconstructed from a series of
optical sections at different depths.
The confocal microscope is the instrument
of choice for examining fluorescence-stained
cells in tissue slices or small, intact organisms
such as Drosophila (Fig. 14.11.1A,B) and ze-
brafish embryos. It is also useful for localizing
fluorescent-tagged molecules in dissociated
cells (Fig. 14.11.1C,D). Its sensitivity even al-
lows fluorescence in living specimens to be
monitored, making it feasible to follow the
movements in living cells of fluorescent probes
such as the green fluorescent protein (GFP; Fig.
14.11.1D). In addition, some types of confocal
microscopes can be configured to perform pho-
tobleach experiments (Fig. 14.11.1D) and to
photoactivate “caged” molecules (molecules
that are inactive until released with UV illumi-
nation).
Biologists use confocal microscopy in a
number of creative ways that are beyond the
scope of this article. The information presented
herein is intended to provide background and
practical tips needed to get started with confo-
cal microscopy. An excellent source of theoreti-
cal and technical information is the Handbook
of Biological Confocal Microscopy (1995; ed-
ited by J. Pawley). Also recommended are Cell
Biological Applications of Confocal Micros-
copy (1993; edited by B. Matsumoto), a good
source of practical information; Confocal Mi-
croscopy (1990; edited by T. Wilson), for theo-
retical background; and Video Microscopy
(1997; Inoue and Spring) for fundamentals of
microscopy.
THE BASIS OF OPTICAL
SECTIONING
Confocal microscopes accomplish optical
sectioning by scanning the specimen with a
focused beam of light and collecting the fluo-
rescence signal from each spot via a spatial
filter (generally a pinhole aperture) that blocks
signals from out-of-focus areas of the speci-
men. The physical basis of optical sectioning
in fluorescence confocal microscopy is illus-
trated in Figure 14.11.2. A point light source
(typically a laser) evenly illuminates the back
focal plane of the objective, which focuses the
light to a diffraction-limited spot in the speci-
men. The irradiation is most intense at the focal
spot, although areas of the specimen above and
below the focal spot also are illuminated. Fluo-
rescent molecules excited by the incident light
emit fluorescence in all directions. The fluores-
cence collected by the objective comes to focus
in the image plane, which is conjugate (confo-
cal) with the focal plane in the specimen. A
pinhole aperture in the image plane allows
fluorescence from the illuminated spot in the
specimen to pass to the detector but blocks light
from out-of-focus areas.
The diameter of the pinhole determines how
much of the fluorescence emitted by the illu-
minated spot in the specimen is detected, and
the thickness of the optical section. From wave
optics we know that a point light source in the
plane of focus of an objective produces a three-
dimensional diffraction pattern in the image
plane. The cross section at the image plane is
an Airy disk (see Fig. 14.10.9), a circular dif-
fraction pattern with a bright central region.
The radius of the bright central region of the
Airy disk in the reference frame of the specimen
is given by
R
Airy
= 0.61
λ/NA
where
λ is the emission wavelength and NA is
the numerical aperture of the objective (see
UNIT
14.10
for a discussion of NA). At the image plane
(the location of the pinhole aperture), the radius
of the central region is R
Airy
multiplied by the
magnification at that plane (for a more com-
plete explanation see Wilson, 1995).
Adjustment of the pinhole to a diameter
slightly less than the diameter of the central
region of the Airy disk allows most of the light
from the focal point to reach the detector and
reduces the background from out-of-focus ar-
eas by
∼1000-fold relative to widefield micros-
Supplement 44
Contributed by Carolyn L. Smith
Current Protocols in Molecular Biology (1998) 14.11.1-14.11.12
Copyright © 1998 by John Wiley & Sons, Inc.
14.11.1
In situ
Hybridization
and Immuno-
histochemistry
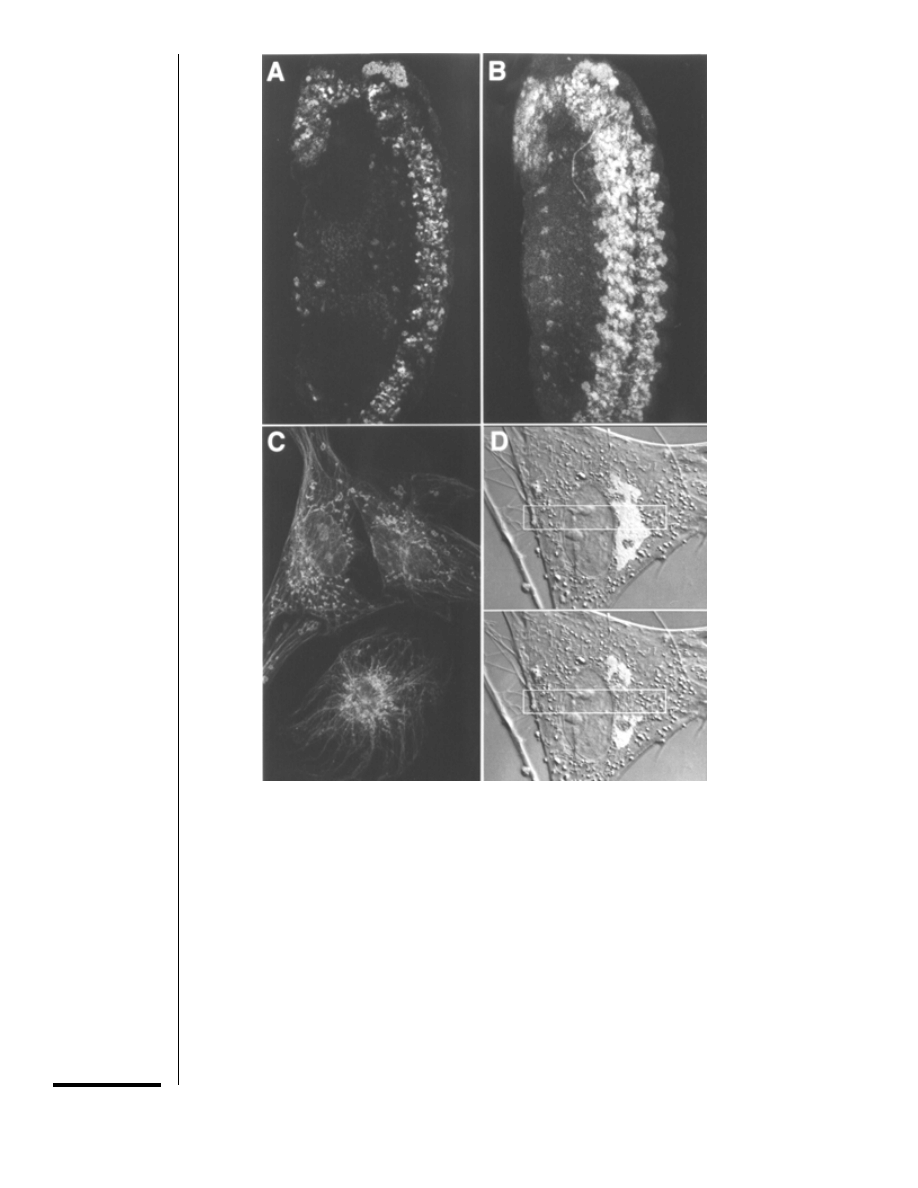
Figure 14.11.1 Applications of laser scanning microscopy. (A,B) (From W. Oldenwald; see
Kamabadur et al., 1998.) 3-D analysis of thick specimens. Different neuronal populations of an
∼250-µm-thick Drosophila embryo were immunolabeled with antibodies against three transcription
factors. A,
∼2.5-µm optical section collected with 25×, 0.8-NA objective using a detector pinhole
diameter of
∼1.3 Airy units. Labeled neurons in the plane of focus appear sharply defined, while those
outside it are not visualized. B, projection (superimposition) of 65 optical sections collected at 2-
µm
intervals in the
z axis. Neurons at different focal planes appear to overlap in this flattened image, but
are distinct in a 3-D reconstruction. (C) Localization of intracellular structures. Dissociated rat
fibroblasts were immunolabeled with anti-tubulin antibodies to visualize microtubules (green) and
stained with fluorescent probes for mitochondria (Mitotracker, red) and DNA (DAPI, blue). The image
is a projection of 20 optical sections collected at 0.3-
µm intervals in the z axis with 100×, 1.4-NA
objective. (D) Measuring molecular motility. In a living fibroblast expressing a Golgi membrane protein
(galactosyltransferase) fused to GFP (S65T-GFP), GFP fluorescence (green) localized to the Golgi
complex, shown superimposed on a DIC image of the cell. After the first image was collected, the
boxed region (yellow) was scanned with full laser power; this photobleached the GFP in the boxed
area as shown in the second image collected
∼2 sec later. The rate of fluorescence recovery into the
photobleached zone (not illustrated) indicated that GFP-galactosyltransferase fusion is highly mobile
in Golgi membranes.
This black and white facsimile of the figure is intended only as a placeholder;
for full-color version of figure go to http://www.currentprotocols.com/colorfigures
Supplement 44
Current Protocols in Molecular Biology
14.11.2
Basic Confocal
Microscopy
copy (Sandison et al., 1995). The separation of
the in-focus signal from the out-of-focus back-
ground achieved by a properly adjusted pinhole
is the principle advantage of confocal micros-
copy for examination of thick specimens (see
Fig. 14.11.1A,B).
Point illumination and the presence of a
pinhole in the detection light path also produces
improved lateral and axial resolution relative to
conventional microscopy (Table 14.11.1). The
actual extent of improvement depends on the
size of the pinhole. Near-maximal axial resolu-
tion is obtained with a pinhole radius
∼0.7 ×
R
Airy
whereas optimal lateral resolution is ob-
tained with a pinhole less than 0.3
× R
Airy
(Wilson, 1995). However, a pinhole smaller
than
∼0.7 × R
Airy
significantly reduces the total
signal, a sacrifice that may not be worth the gain
in resolution, especially when imaging dim
samples. In fluorescence imaging, resolution
also is influenced by the emission and excita-
tion wavelengths (Table 14.11.1).
TYPES OF CONFOCAL
MICROSCOPES
Several types of confocal microscopes are
available, each having unique features and ad-
vantages. The types most commonly used for
examining fluorescence specimens are laser-
scanning confocal microscopes. These micro-
scopes, as their name implies, use lasers as light
sources and collect images by scanning the
laser beam across the specimen.
Lasers provide intense illumination within
a narrow range of wavelengths. The emission
wavelengths of several types of lasers, together
with the excitation spectra of familiar fluoro-
phores, are illustrated in Figure 14.11.3. Mixed
krypton-argon gas lasers are popular for multi-
wavelength confocal microscopy because they
emit at three well-separated wavelengths (488,
568, and 647 nm) that can be used to simulta-
neously image two or three fluorophores (e.g.,
FITC, lissamine rhodamine, and Cy5). The
disadvantage of krypton-argon lasers is that
point
light
source
photodetector
confocal pinhole
dichroic mirror
objective lens
focal plane
specimen
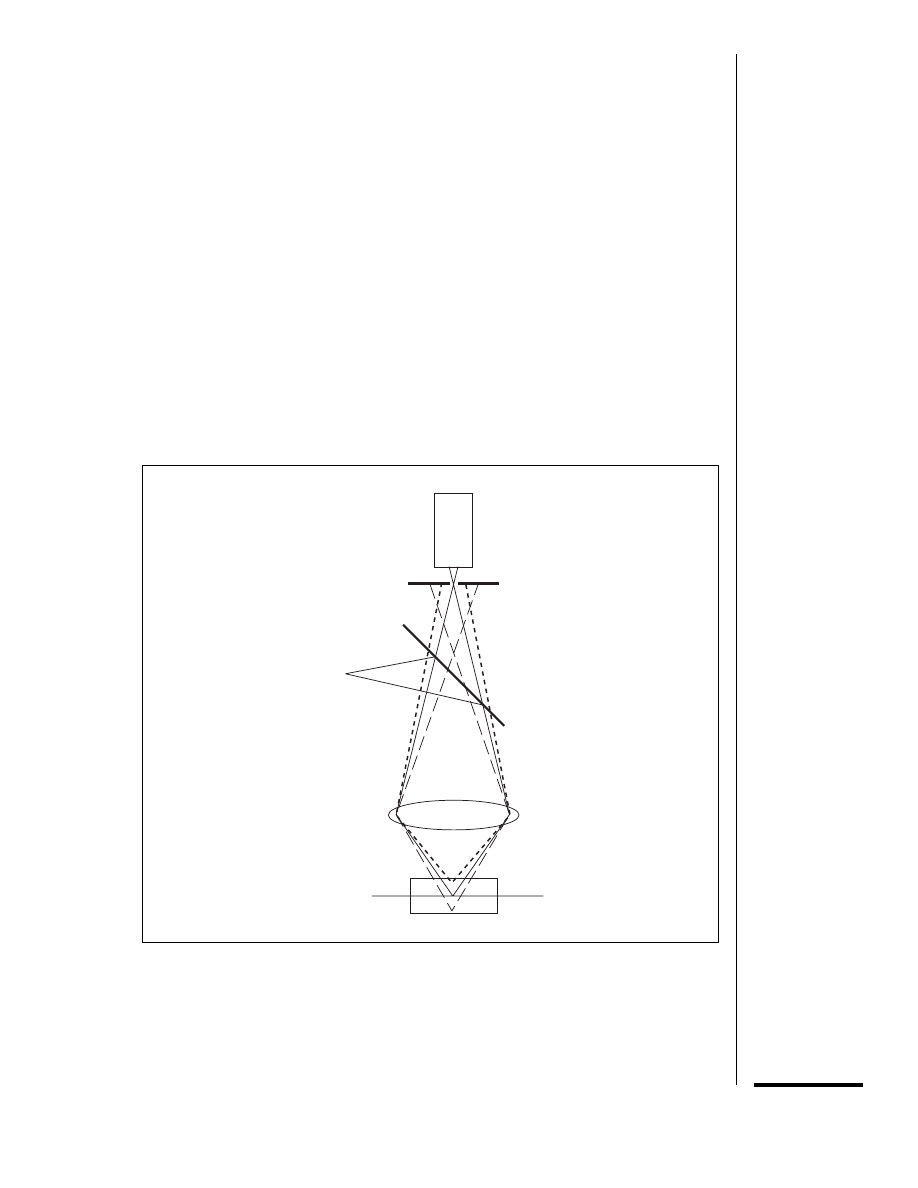
Figure 14.11.2 The basis of optical sectioning in confocal epifluorescence microscopy. Illumina-
tion from the point light source is reflected by the dichroic mirror and focused by the objective lens
to a diffraction-limited spot within the specimen. Fluorophores within the focal spot as well as in the
cone of light above and below it are excited, emitting fluorescence at a longer wavelength than the
incident light. The fluorescence captured by the objective passes through the dichroic mirror
because of its longer wavelength. The confocal pinhole allows fluorescence from the plane of focus
in the specimen to reach the photodetector but blocks fluorescence from areas above and below
the plane of focus. Redrawn from Shotton (1993).
Current Protocols in Molecular Biology
Supplement 44
14.11.3
In situ
Hybridization
and Immuno-
histochemistry
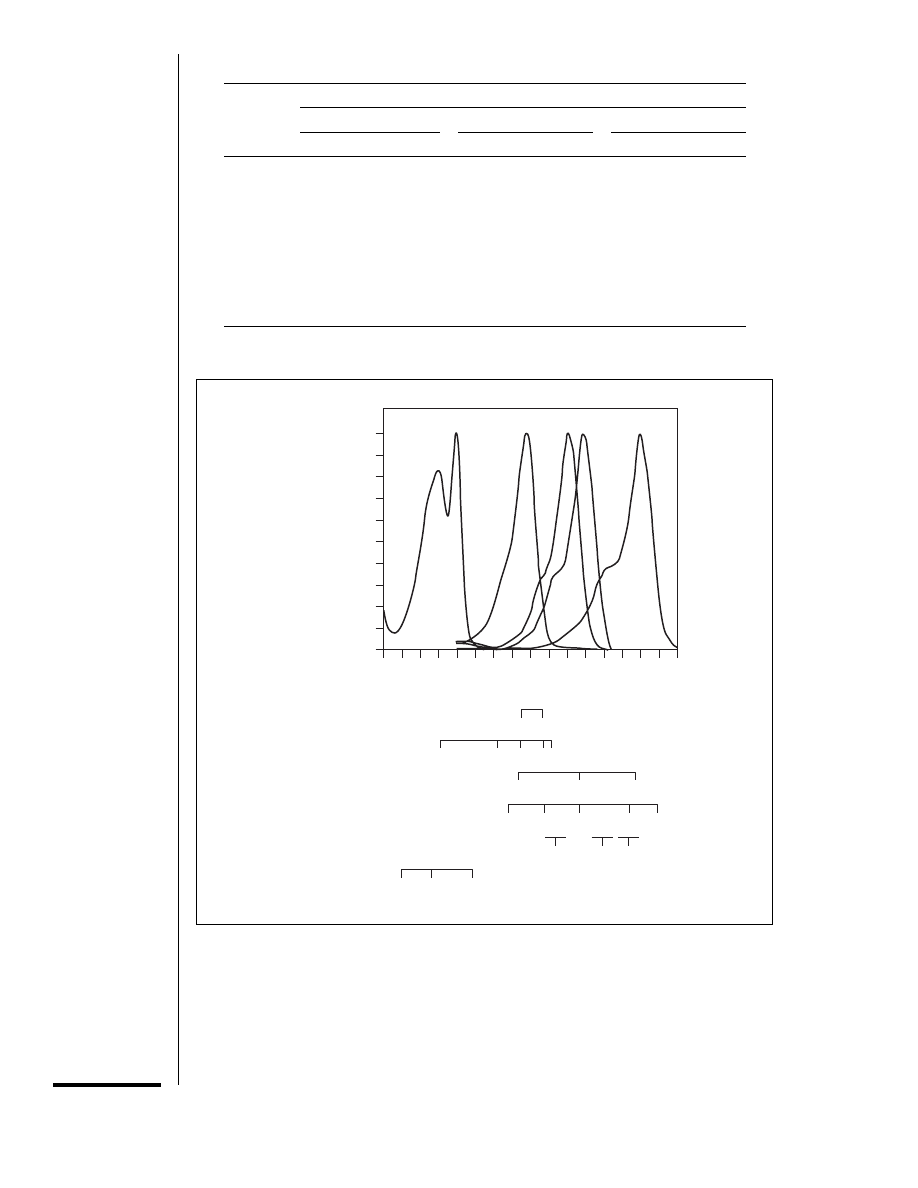
Table 14.11.1 Theoretical Resolutions of Confocal and Conventional Microscopes
a
λ
ex
/
λ
em
Objective
10
×, 0.4 NA, air
40
×, 0.85 NA, air
60
×, 1.4 NA, oil
Lat. res.
Ax. res.
Lat. res.
Ax. res.
Lat. res.
Ax. res.
Confocal fluorescence microscope
488/518
0.55
4.50
0.26
0.99
0.16
0.56
568/590
0.64
5.17
0.30
1.09
0.18
0.64
647/677
0.72
5.88
0.34
1.28
0.21
0.72
Conventional fluorescence microscope
518
0.79
6.48
0.37
1.43
0.24
0.93
590
0.90
7.38
0.42
1.63
0.28
1.06
680
1.04
8.50
0.49
1.88
0.32
1.22
a
Data reprinted from Brelje et al. (1993) by permission of Academic Press.
λ
ex
and
λ
em
, excitation and emission
wavelengths; lat. res. and ax. res., lateral and axial resolutions.
Cascade blue
Relative excitation efficiency
300
350
400 450
500
550
600
650
700
0
20
40
60
80
100
488 514
488 514 528
457
351, 364
488
568
647
478/482
568
647
520
676
595 633
543
325 354
422
FITC TRITC LRSC Cy5.18
argon
UV argon
krypton-argon
krypton
helium-neon
helium-cadmium
Wavelength (nm)
Figure 14.11.3 Comparison of the emission wavelengths of various lasers and the excitation
spectra of representative fluorophores. The lasers most commonly used for laser-scanning confocal
microscopy are air-cooled argon (488 and 514 nm), krypton-argon, and helium-neon lasers. UV
argon lasers generally require water cooling and are more expensive. They may be configured to
provide only UV wavelengths (351 nm and 364 nm) or both UV and longer wavelengths. Data for
the excitation spectra of Cascade blue, fluorescein (FITC), tetramethylrhodamine (TRITC), lis-
samine rhodamine (LRSC), and cyanine 5.18 (Cy5.18) are from Wessendorf and Brelje (1993) and
were downloaded from the web page of Aryeh Weiss,
http://optics.jct.ac.il/
∼aryeh/Spectra. Modified
from Brelje et al. (1993).
Supplement 44
Current Protocols in Molecular Biology
14.11.4
Basic Confocal
Microscopy
their life spans are short (
∼2000 hr). Another
way to achieve multiwavelength excitation is
to combine the outputs of two or more lasers.
Several methods have been devised for scan-
ning the sample with the laser beam to illumi-
nate different positions in the specimen. The
most common method employs a pair of galva-
nometer mirrors to both scan the laser beam
across the specimen and collect the fluores-
cence emitted from the specimen (Fig.
14.11.4). One galvanometer mirror scans se-
quential spots along the x axis, and the second
mirror moves from line to line in the y axis. The
fluorescence emission is separated from the
illuminating beam by a dichroic beam splitter
and is directed to a photomultiplier tube which
collects the fluorescence produced as each spot
in the specimen is illuminated. The photodetec-
tor output is converted to a digital image that
can be displayed on a monitor and stored as a
digital image file for later analysis. Most laser-
scanning confocal microscopes have 8-bit digi-
tizers that encode 256 gray levels, although
some recent models have 12- or 16-bit digitiz-
ers. Collection of a full-size image (typically
1024
× 1024 pixels) takes ∼2 sec. Laser-scan-
ning microscopes that employ galvanometer
mirror scanners sometimes are called “slow-
scan” microscopes because of their relatively
slow image acquisition rates. Slow-scan micro-
scopes are available from several sources (Bio-
Rad, Zeiss, Leica, Olympus, Nikon, Molecular
Dynamics, and Meridian; see
APPENDIX 4
).
The movements of the galvanometer mirrors
in laser-scanning microscopes are under the
control of a computer, providing flexibility in
the scanning pattern. For example, it is possible
to “zoom” a region of interest (visualize it at
higher magnification) by reducing the scan area
and the distances between sample points. In
addition, many laser-scanning microscopes
have the ability to repetitively scan a single line
or to “park” the scanner to monitor fluores-
cence at a single spot. The latter technique is
specimen
objective
mirror
microscope
scanner
X
Y
dichroic
beam
splitter 1
dichroic
beam
splitter 2
photomultiplier
tube 1
photomultiplier
tube 2
krypton-argon
laser
line-selection filter
neutral-density filter
variable
pinhole
emission
filter
488-nm laser beam
568-nm laser beam
FITC
lissamine rhodamine
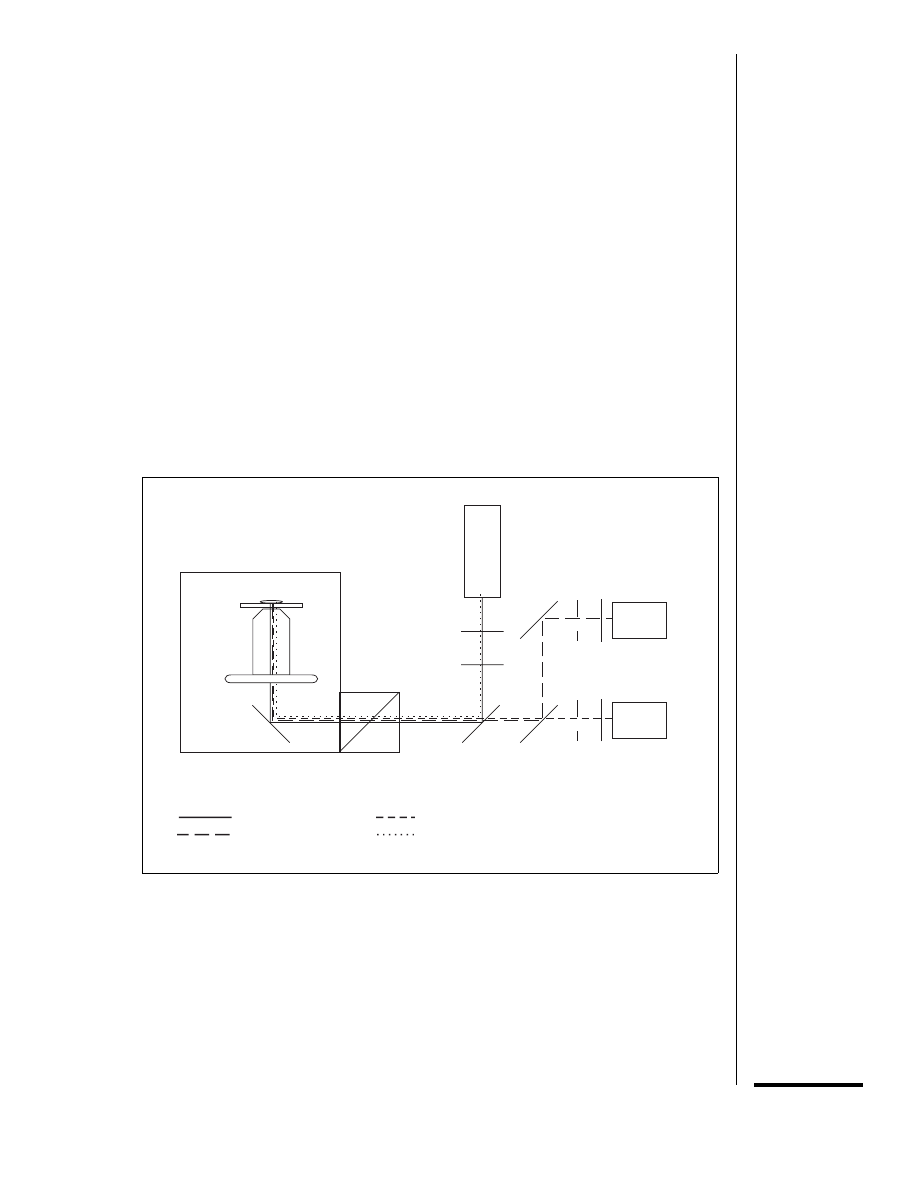
Figure 14.11.4 The light path of a laser-scanning confocal microscope set up for simultaneous
imaging of FITC and lissamine rhodamine. The 488-nm and 568-nm lines of a krypton-argon laser
are reflected by dichroic beam splitter 1 into the optical axis of the microscope. The scanner contains
two galvanometer mirrors, which generate the
x and y axis movements of the beam. The beam is
reflected by a mirror into the objective which focuses the beam onto the specimen. The specimen
is scanned line by line in a raster pattern. Fluorescence emitted by the specimen as each spot is
illuminated travels the reverse path through the scanning system. The FITC fluorescence (peak at
520 nm) and lissamine rhodamine fluorescence (peak at 590 nm) pass through dichroic beam
splitter 1 to dichroic beam splitter 2, which transmits the lissamine rhodamine fluorescence to
photomultiplier tube 1 and reflects the FITC fluorescence to photomultiplier tube 2. A variable
pinhole in front of each photodetector blocks light from out-of-focus areas of the specimen while
allowing light from the illuminated spot to reach the detector.
Current Protocols in Molecular Biology
Supplement 44
14.11.5
In situ
Hybridization
and Immuno-
histochemistry

particularly useful for studying rapidly chang-
ing fluorescence signals, such as those pro-
duced by a Ca
2+
indicator in an active neuron.
Laser-scanning microscopes are available
(from Norau, Life Sciences Resources, and
Meridian; see
APPENDIX 4
) that can collect im-
ages at video rates (30 frames/sec) or faster.
Several methods for achieving rapid scanning
rates have been employed, such as acousto-op-
tical deflection devices, rotating mirrors, or
resonating mirrors (reviewed by Art and Good-
man, 1993; Tsien and Bacskai, 1995). The gain
in imaging speed always comes at a cost, how-
ever. For example, rapid-scan confocal micro-
scopes do not provide the degree of control over
the scan pattern offered by top-of-the-line slow-
scan microscopes, and some video-rate confo-
cal microscopes are incapable of multiwav-
elength illumination. Video-rate microscopes
that rely on slit apertures rather than pinhole
apertures have slightly poorer lateral and axial
resolution.
A type of rapid-scan confocal microscope
that deserves mention because of its lower cost
(among other reasons) uses a spinning disk with
multiple pinholes (
∼200,000) to simultane-
ously illuminate and detect emission from
many spots in the specimen. The light source
can be a laser or a broad-spectrum lamp like
that used for conventional epifluorescence mi-
croscopy. The principle advantage of this type
of confocal microscope is that it is capable of
collecting images very rapidly (up to 700
frames/sec at 5000 lines resolution; Kino,
1995). The images can be examined directly by
eye or captured with a sensitive camera. The
main disadvantage is that the disk transmits
only
∼1% of the available light because the
holes in the spinning disk need to be widely
spaced. A new type of spinning-disk confocal
microscopy has recently become available that
uses “microlenses” to improve optical through-
put and achieve high-speed confocal imaging
with better sensitivity (Ultra View; Life Sci-
ences Resources; see
APPENDIX 4
).
Another form of laser-scanning microscopy
that promises to be of great value uses two-pho-
ton (and three-photon) excitation to induce
fluorescence emission (Denk et al., 1995).
Two-photon excitation occurs when a fluoro-
phore absorbs two photons, each having half
the energy needed to raise the fluorophore to
the excited state. The light intensities required
for simultaneous absorption occur only at the
focal point, so only fluorophores at the focal
point are excited. Therefore, two-photon exci-
tation allows optical sectioning without a spa-
tial filter in front of the detector. Moreover,
since fluorophores outside the focal point are
not excited, the specimen is less subject to
photobleaching than in a conventional laser-
scanning microscope. The wavelengths needed
to excite standard visible light fluorophores by
two-photon absorption are longer and penetrate
tissue better than the wavelengths used for
one-photon excitation, making it possible to
look deeper into a specimen. In addition, UV
fluorophores can be imaged without many of
the problems that arise when UV wavelengths
are used in conventional laser-scanning micro-
scopes. A current drawback of two-photon con-
focal microscopy is the high cost of an appro-
priate laser (
∼$100,000). Two-photon scanning
microsopes are now available from commercial
sources (Bio-Rad, Leica; see
APPENDIX 4
).
PRACTICAL GUIDELINES
Sample Preparation:
Immunofluorescence in Fixed
Specimens
Additional guidelines for sample prepara-
tion are discussed in
UNITS 14.6 & 14.10
.
Fixation
The best fixative is one that accurately pre-
serves the three-dimensional geometry of the
specimen. The standard fixative for fluores-
cence microscopy (2% to 4% formaldehyde in
PBS) is not ideal because it can cause blebbing
of the plasma membrane, vesiculation of intra-
cellular membrane compartments, and other
alterations in cellular morphology. Moreover,
some commercial preparations of formalde-
hyde contain methanol, which shrinks cells.
Techniques for optimizing formaldehyde fixa-
tion are described by Bacallao et al. (1995; also
see
UNITS 14.6 & 14.10
). The buffer should be chosen
to match the osmolality and pH of the specimen.
Fixatives containing 0.125% to 0.25% glutaral-
dehyde in addition to formaldehyde preserve
cellular morphology better than those contain-
ing formaldehyde alone. Some investigators
avoid using glutaraldehyde for fluorescence
microscopy because it induces autofluores-
cence. However, autofluorescence can be re-
duced by treating the sample after fixation with
NaBH
4
(1 mg/ml in PBS, pH 8.0, using two
treatments of 5 min each for dissociated cells,
longer for thicker samples). A more serious
drawback of glutaraldehyde for immunofluo-
rescence studies is that it destroys the antibody
recognition sites of some antigens. An alterna-
tive fixation technique that preserves tissue
Supplement 44
Current Protocols in Molecular Biology
14.11.6
Basic Confocal
Microscopy

better than chemical fixation is rapid freezing
followed by freeze substitution (Bridgman and
Reese, 1984).
Choices of fluorophores
Criteria to consider in selecting fluorophores
for fluorescence microscopy are described in
UNITS 14.6 & 14.10
. The only additional consideration
for confocal microscopy is to choose fluoropho-
res that can be excited by the wavelengths pro-
vided by the available lasers. However, it is not
essential for the excitation spectrum peak to pre-
cisely match the laser wavelength because the
lasers on most microscopes are sufficiently pow-
erful to maximally excite fluorophores at off-peak
wavelengths. For experiments that depend on
imaging two fluorophores, it is best to select
fluorophores whose excitation and emission
spectra have minimal overlap. Good choices for
multiwavelength imaging with a krypton-argon
laser are: FITC/Oregon green/Alexa 488 (Mo-
lecular Probes) for excitation at 488 nm; lis-
samine rhodamine/Cy3/Texas red/Alexa 568
(Molecular Probes) for excitation at 568 nm;
and Cy5 for excitation at 647 nm. UV fluoro-
phores also are good for multicolor imaging
(with absorption at 350 to 390 nm; some of the
best dyes for DNA are UV fluorophores).
Control samples
Confocal microscopes rely on electronic im-
age enhancement techniques that can make
even a dim autofluorescence signal or nonspe-
cific background staining look bright. In order
to be able to distinguish a real signal from
background it is essential to prepare appropri-
ate control samples. For immunofluorescence
experiments with one primary antibody, the
appropriate control samples are unstained
specimens and specimens treated with the sec-
ondary antibody but no primary antibody. Ex-
periments with two primary and secondary an-
tibodies require additional controls to test
whether the secondary antibodies cross-react
with the “wrong” primary antibody. Other con-
trol experiments may be required to verify the
specificity of labeling (see
UNIT 14.10
).
Mounting the specimen
The mounting medium should preserve the
three-dimensional structure of the specimen.
PBS (
APPENDIX 2
) or a mounting medium con-
sisting of 50% glycerol/50% PBS preserves the
shapes of cells quite well, but Mowiol and
gelvatol cause a 10% decrease in height (Ba-
callao et al., 1995). Adding an antioxidant to
the mounting medium helps to alleviate photo-
bleaching. One of the best antioxidants is
100 mg/ml 1,4-diazabicyclo[2,2,2]octane
(DABCO; Sigma; Bacallao et al., 1995). n-
propyl gallate (Giloh and Sedat, 1982) and
p-phenylenediamine (PPD; Johnson et al.,
1982) also are effective antibleaching agents,
but the former may cause dimming of the fluo-
rescence while the latter may damage the speci-
men (Bacallao et al., 1995).
The choice of mounting medium should take
into account the type of microscope objective
that will be used to observe the specimen. In
order for an objective to perform optimally, the
mounting medium should have the same refrac-
tive index as the objective immersion medium.
Table 14.11.2 gives the refractive indexes of
standard objective immersion media and
mounting media. Mismatches in the refractive
indexes produce spherical aberration leading to
loss of light at the detector, as well as decreased
z axis resolution and incorrect depth discrimi-
nation. Image deterioration caused by spherical
aberration increases with depth into the speci-
men. Significant losses of signal intensity and
axial resolution are apparent at distances of just
5 to 10
µm when an oil immersion objective is
used to examine a specimen in an aqueous
medium (Keller, 1995).
Most microscope objectives are designed
for viewing specimens through a glass
coverslip of a specific thickness (typically 0.17
µm, a no. 1
1
⁄
2
coverslip). Correct coverslip
thickness is especially critical for high-NA
(>0.5) dry objectives and water immersion ob-
jectives (Keller, 1995). Use of a coverslip that
differs from the intended thickness by only 5%
causes significant spherical aberration. High-
NA dry and water immersion objectives typi-
cally have an adjustable collar to correct for
small variations in coverslip thickness.
The specimen should be mounted as close
to the coverslip as possible, especially for ob-
servation with immersion objectives, which
have short working distances (
∼100 to 250 µm,
depending on the type of objective). This also
helps to avoid image deterioration due to
spherical aberration. Fragile specimens should
be protected by supporting the coverslip; for
example, using a thin layer of nail polish, strips
of coverslips, or a gasket made from a sheet of
silicon rubber (Reiss; see
APPENDIX 4
). Sealing
the edges of the coverslip—with nail polish or
silicon vacuum grease (Dow Corning; see
AP-
PENDIX 4
)—helps to prevent specimen desicca-
tion and movement.
Current Protocols in Molecular Biology
Supplement 46
14.11.7
In situ
Hybridization
and Immuno-
histochemistry

Living Specimens
Confocal microscopy of living preparations
is challenging for several reasons. The speci-
men must be mounted in a chamber that keeps
it healthy and immobile while at the same time
providing access for the objective. For high-
resolution transmitted-light imaging (e.g., by
laser-scanning differential interference con-
trast microscopy), the chamber must be thin
enough to accommodate a high-NA (oil immer-
sion) condenser. Fluorescence signals in living
specimens generally are weak and the illumi-
nation levels needed to detect them can be
damaging to the specimen. Photobleaching in-
evitably is a problem for experiments that re-
quire collecting many images. Temperature
fluctuations in specimens kept at nonambient
temperatures make it difficult to maintain ac-
curate focus.
A simple chamber for culture preparations
grown on glass coverslips can be made by form-
ing a well on a glass slide with a gasket cut from
a sheet of silicon rubber or a plastic ruler. To
prevent the well from leaking, it should be sealed
with silicon vacuum grease, a mixture of melted
paraffin and petroleum jelly, or Sylgard (Dow
Corning; see
APPENDIX 4
). The well is filled with
medium and then the coverslip with attached
cells is placed, cell side down, on top of the well.
The preparation can be kept warm during obser-
vation on the microscope with a heated air
blower—e.g., a hair dryer with variable power
source or a commercial air-stream incubator
(e.g., Neutek; see
APPENDIX 4
)—or with infrared
lamps. More elaborate chambers, some of which
have built-in heaters and ports for changing
solutions, are available from commercial
sources (see Terasaki and Dailey, 1995, for a
partial listing of manufacturers). An important
factor to consider in choosing a chamber is
whether it maintains the desired temperature
while in contact with an immersion objective
that acts as a heat sink. One solution to this
problem is to heat the objective as well as the
chamber. A heated chamber and objective
warmer designed for microscopy with a high-
NA objective and condenser are available from
Bioptechs (see
APPENDIX 4
).
Addition of an oxygen quencher to the me-
dium can help to alleviate photobleaching of
the fluorophores. Photobleaching not only
leads to dimming of the signal but also to
generation of oxygen radicals that can damage
cells. Several oxygen quenchers have been re-
ported to be effective, including oxyrase (0.3
U/ml; Oxyrase [see
APPENDIX 4
]; Waterman-
Storer et al., 1993); ascorbic acid (0.1 to 3.0
mg/ml; Sigma; Terasaki and Dailey, 1995); a
mixture of Trolox (10
µM; Aldrich) and N-ace-
tylcysteine (50
µM; Sigma; M. Burack and G.
Table 14.11.2 Refractive Indexes of Common Immersion and
Mounting Media
Medium
Refractive index
(RI)
Immersion media
Air
1.00
Water
1.338
Glycerol
1.47
Immersion oil
1.518
Mounting media
50% glycerol/PBS/DABCO
1.416
a
5% n-propyl gallate/0.0025% p-phenylene
diamine (PPD) in glycerol
1.474
a
0.25% PPD/0.0025% DABCO/5% n-propyl
gallate in glycerol
1.473
a
VectaShield (Vector Labs)
1.458
a
Slow Fade (Molecular Probes)
1.415
b
Prolong (Molecular Probes)
1.3865
b,c
a
Data from Bacallao et al. (1995).
b
Data from Molecular Probes.
c
RI for liquid medium (RI for solidified medium will be higher).
Supplement 46
Current Protocols in Molecular Biology
14.11.8
Basic Confocal
Microscopy

Banker, pers. comm.); and crocetin (Tsien and
Waggoner, 1995).
Optimizing Imaging Parameters
Choice of objectives
High-NA objectives generally are prefer-
able for fluorescence microscopy because they
collect more light than low-NA objectives
(brightness is proportional to NA
4
). Most high-
quality high-NA objectives have >80% trans-
mission at visible wavelengths, but some have
low transmission at UV wavelengths (Keller,
1995).
Water immersion objectives are the best
choice for visualizing specimens in aqueous
solutions (e.g., living specimens). Several mi-
croscope manufacturers recently have intro-
duced high-NA water immersion objectives
specifically designed for confocal microscopy
of biological specimens. These objectives dif-
fer from previously available types of water
immersion objectives in that they are intended
for viewing specimens mounted under a cover-
slip. They have working distances of
∼250 µm.
Oil immersion objectives can have higher
NAs than water immersion objectives. Most
have fairly short working distances (
∼100 µm)
although some recently introduced oil objec-
tives have working distances of
∼200 µm. A
long-working-distance oil objective will be
useful only if the specimen is mounted in a
medium that matches the refractive index of
immersion oil (
η = 1.518). If an aqueous
mounting medium is used, images from depths
at more than
∼20 µm into the specimen will be
noticeably degraded by spherical aberration.
Also, distance measurements in the z axis will
need to be corrected. The actual movement of
the focal plane in the specimen (d
s
) produced
by a movement of the objective (d
obj
) depends
on the ratio of the refractive indexes of the
specimen and immersion medium. A reason-
able approximation (Majilof and Forsgren,
1993) of the relationship is given by:
d
s
/d
obj
=
η
s
/
η
obj
Pinhole size
As was explained above (see Basis of Opti-
cal Sectioning), the size of the pinhole has a
critical influence on image quality. A pinhole
with a radius equal to the radius of the first
minimum of the Airy disk—which is approxi-
mately equivalent to the diameter at half maxi-
mal intensity (Amos, 1995)—will let most of
the light from the plane of focus reach the
detector, while blocking most of the out-of-fo-
cus flare. The lateral resolution will be
∼20%
better than that obtainable by conventional mi-
croscopy with the same optics (Centonze and
Pawley, 1995), although not as good as can be
achieved with a smaller pinhole. Lateral reso-
lution continues to improve as pinhole radius
is decreased down to a pinhole size of
∼0.2 ×
Airy disk radius, but a pinhole this small ex-
cludes
∼95% of the signal (Wilson, 1995). Ax-
ial resolution improves as pinhole size de-
creases, down to
∼0.7 × Airy disk radius, then
levels off. The best trade-off between signal
intensity and resolution will depend on the
characteristics of the sample and aims of the
experiment.
Zoom factor
The zoom setting on a confocal microscope
determines the size of the scan region and the
apparent magnification of the image. A zoom
factor of 2 will scan an area half as long and wide
as a zoom factor of 1. Images are made up of the
same number of samples (points along the hori-
zontal axis, lines along the vertical axis) and are
displayed on the image monitor by a fixed number
of pixels regardless of the zoom factor. Therefore,
the pixels in a zoom-2 image will represent areas
within the specimen half as large in each dimen-
sion as the areas represented by the pixels at zoom
1. If the pixel size for an objective at zoom 1
represents 0.25
µm × 0.25 µm, then the pixel
size at zoom 2 will be 0.125
× 0.125 µm. The
pixel dimensions (referring to the specimen)
are inversely related to the zoom setting.
For each objective, there is an optimal zoom
setting which yields pixel dimensions small
enough to take advantage of the full resolution
of the objective but large enough to avoid over-
sampling. In order for the minimum resolvable
entity to be visible on the display monitor, the
pixel dimensions need to be smaller than (less
than one-half) the optical resolution. However,
if the pixel size is made too small by using a
higher-than-optimal zoom factor, the specimen
is subjected to more irradiation than necessary
with an increased risk of photobleaching. The
rate of photobleaching increases proportionally
to the square of the zoom factor (Centonze and
Pawley, 1995). A guideline for selecting an
appropriate zoom factor derived from informa-
tion theory (the Nyquist Sampling Theorem)
states that the pixel dimensions should be equal
to the optical resolution divided by 2.3 (see
Webb and Dorey, 1995). However, pixel dimen-
sions smaller than this may produce more in-
formative images.
Current Protocols in Molecular Biology
Supplement 44
14.11.9
In situ
Hybridization
and Immuno-
histochemistry

Z axis sectioning interval
In order to study the three-dimensional
structure of a specimen, images are collected at
a series of focal levels at intervals determined
by the commands sent to the focus motor. The
most straightforward way to ensure that the
reconstructed images have correct proportions
in the x, y, and z axes is to collect optical sections
at z axis intervals equal to the x,y pixel dimen-
sion. However, the interfocal plane interval
needed to adequately sample the specimen in
the z axis is not as small as the x,y pixel dimen-
sion because the axial resolution is poorer than
the lateral resolution (see Table 14.11.1). The
optimal interfocal plane interval (according to
the Nyquist Sampling Theorem) is equal to the
axial resolution divided by 2.3. Collecting im-
ages at shorter intervals results in oversampling
with an increased risk of photobleaching.
Illumination intensity
Fluorescence emission increases linearly
with illumination intensity up to a level at
which emission saturates. Optimal signal-to-
background and signal-to-noise ratios are ob-
tained with illumination levels well below satu-
ration (Tsien and Waggoner, 1995). The illumi-
nation intensity on a laser-scanning microscope
can be adjusted by inserting neutral-density
filters into the light path and/or by operating
the laser at submaximal power. In general, the
best images are obtained with illumination lev-
els that are as high as possible without produc-
ing unacceptable rates of photobleaching.
PMT black level and gain
The contrast and information content of con-
focal images are influenced by the black level
and gain of the photomultiplier tube (PMT)
amplifiers. To obtain maximal information, the
black level and gain should be adjusted to take
advantage of the full dynamic range of the
PMTs. The appropriate black level setting can
be found by scanning while the light path to the
PMT is blocked. The image that appears on the
display monitor should be just barely brighter
than the background, which is black (gray
level = 0). To set the gain, scan the specimen
and adjust the gain so that the brightest pixel in
the image is slightly below white (gray level =
255). Selecting black level and gain settings
which ensure that all signals fall within the
dynamic range of the PMT is important for
quantitative imaging experiments. The soft-
ware provided with many confocal micro-
scopes includes a pseudocolor image display
mode that facilitates selection of appropriate
black level and gain settings by highlighting
pixels with intensity values near absolute black
and absolute white.
Averaging
Confocal images of dimly fluorescent speci-
mens captured at typical scan rates (1 to 2
sec/frame for a slow-scan confocal micro-
scope) appear noisy because of the small num-
bers of photons collected from each spot. In
some instances, it may be possible to improve
the signal-to-noise ratio by scanning the speci-
men at slower rates. Another way to obtain a
better image is by summing and averaging the
signals obtained in multiple scans (frame aver-
aging). Some confocal microscopes provide a
second averaging method (line averaging), in
which individual lines are repeatedly scanned
and averaged. Line averaging generally pro-
duces sharper images than frame averaging
(which averages full frames) because there is
less risk of blurring due to movements or
changes in the specimen.
Image display
Commercial confocal microscope packages
provide software for some types of image en-
hancement and display. The display options for
three-dimensional datasets typically include “z
projections” (see Fig. 14.11.1B), which are
two-dimensional displays formed by superim-
position of stacks of optical sections, and
stereoscopic views, which are made by com-
bining two image stacks, one aligned in the z
axis and the other with a displacement between
successive images. Many systems also have the
capability to compute cross-sections and pro-
jections of the specimen from varying angles.
Computed projections for a sequence of view
angles can be played as a movie in which the
specimen appears to rotate around an axis. Such
movies give the viewer a striking impression of
the three-dimensional geometry of the speci-
men. Additional display options are available
in various integrated software/hardware pack-
ages specifically designed for visualization and
analysis of three-dimensional images.
Anticipated Results
Fluorescence in fixed specimens protected
with an antifade agent is often sufficiently
bright and resistant to photobleaching to make
it possible to reconstruct three-dimensional im-
ages using imaging parameters that provide
optimal resolution. Superb three-dimensional
views may be obtained of structures as small
and complex as a cell’s cytoskeleton or the
Supplement 44
Current Protocols in Molecular Biology
14.11.10
Basic Confocal
Microscopy

terminal arbor of an axon. The maximum depth
in the specimen at which adequate images can
be obtained depends on a number of factors
(e.g., the match in refractive indexes of the
immersion and mounting media, the wave-
length of light, and the extent of scattering and
absorption by the specimen). Under optimal
conditions, it may be possible to image struc-
tures at depths near the limit allowed by the
working distance of the objective; in practice,
image quality usually deteriorates at depths in
the range of a few hundred micrometers or less.
Although confocal microscopy on living
cells is more difficult and damage to the tissue
may preclude extensive three-dimensional re-
construction, the added time dimension and
confidence in the reality of the images makes
it well worth the effort. In addition, it is possible
to study dynamic processes lasting for hours by
collecting sequences of time-lapse images. Ro-
bust fluorophores such as certain variants of
GFP (S65T, EGFP) can be imaged repeatedly
with minimal loss of fluorescence (see, for
example, Ellenberg et al., 1997). In addition,
modern laser-scanning confocal microscopes
provide a versatile optical bench and sophisti-
cated specimen positioner which permit a wide
range of experiments with the controlled appli-
cation of laser light to living tissues. Current
examples of these approaches are photobleach-
ing (Cole et al., 1996; Wedekind et al., 1996)
and release of caged compounds (Callaway and
Katz, 1993; Svobodoa et al., 1996). These are
only the harbingers of many future applications
of light probe physiology made possible by the
versatilily of the confocal microscope.
Resources Available via Internet
NIH Image, a powerful image analysis pro-
gram for Macintosh computers developed by
W. Rasband (Research S ervices Branch, Na-
tional Institute of Mental Health, NIH), has
many useful tools for analysis of confocal im-
a ge s . I t ca n b e d ow nl oaded from
http://rsb.info.nih.gov/nih-image/ or obtained
via FTP from zippy. nimh.nih.gov. A version of
NIH Image modified for operation under Win-
dows also is available. Much information about
fluorescent probes can be obtained from the
M o l ec ul a r
P r ob es
We b
S i te
at
http:/www.probes.com/.
Many topics of interest to confocal micros-
copists are discussed on the confocal e-mail
listserver network. To subscribe to the list, send
the message “subscribe confocal<your name>”
to listserv@ubvm.cc.buffalo.edu.
LITERATURE CITED
Amos, W.B. 1995. Appendix 1: Optical units. In
Handbook of Biological Confocal Microscopy,
2nd ed. (J. Pawley, ed.) pp. 579-580. Plenum,
New York.
Art, J.J. and Goodman, M.B. 1993. Rapid scanning
confocal microscopy. In Cell Biological Appli-
cations of Confocal Microscopy (B. Matsumoto,
ed.) pp. 47-78. Academic Press, San Diego.
Bacallao, R., Kiai, K., and Jesaitis, L. 1995. Guiding
principles of specimen preservation for confocal
fluorescence microscopy. In Handbook of Bio-
logical Confocal Microscopy, 2nd ed. (J. Pawley,
ed.) pp. 311-326. Plenum, New York.
Brelje, T.C., Wessendorf, M.W., and Sorenson, R.L.
1993. Multicolor laser scanning confocal im-
munofluorescence microscopy: Practical appli-
cations and limitations. In Cell Biological Appli-
cations of Confocal Microscopy (B. Matsumoto,
ed.) pp. 98-182. Academic Press, San Diego.
Bridgman, P.C. and Reese, T. 1984. The structure of
cytoplasm in directly frozen cultured cells. 1.
Filamentous meshworks and the cytoplasmic
ground substance. J. Cell. Biol. 99:1655-1668.
Callaway, E.M. and Katz, L.C. 1993. Photostimula-
tion using caged glutamate reveals functional
circuitry in living brain slices. Proc. Natl. Acad.
Sci. U.S.A. 90:7661-7665.
Centonze, V. and Pawley, J. 1995. Tutorial on prac-
tical confocal microscopy and use of the confo-
cal test specimen. In Handbook of Biological
Confocal Microscopy, 2nd ed. (J. Pawley, ed.)
pp. 549-570. Plenum, New York.
Cole, N., Smith, C., Sciaky, N., Terasaki, M., Edidin,
M., and Lippincott-Schwartz, J. 1996. Diffu-
sional mobility of Golgi proteins in membranes
of living cells. Science 237:797-801.
Denk, W., Piston, D.W., and Webb, W.W. 1995.
Two-photon molecular excitation in laser-scan-
ning microsopy. In Handbook of Biological
Confocal Microscopy, 2nd ed. (J. Pawley, ed.)
pp. 445-458. Plenum, New York.
Ellenberg, J., S iggia, E.D., Moreira, J.E., S mith,
C.L., Presley, J.F., Worman, J.J., and Lippincott-
Schwartz, J. 1997. Nuclear membrane dy-
anamics and reassembly in living cells: Targeting
of an inner nuclear membrane protein in inter-
phase and mitosis. J. Cell Biol. 138:1193-1206.
Giloh, H. and Sedat, J.W. 1982. Fluorescence mi-
croscopy: Reduced photobleaching of rho-
damine and fluorescein protein conjugates by
n-propyl gallate. Science 217:1252-1255.
Inoue, S. and Spring, K.R. 1997. Video Microscopy:
The Fundamentals, 2nd ed. Plenum, New York.
Johnson, G.D., Davidson, R.S., McNamee, K.C.,
Russell, G., Goodwin, D., and Holborow, E.J.
1982. Fading of immunofluorescence during mi-
croscopy: A study of the phenomenon and its
remedy. J. Immunol. Methods. 55:231-242.
Kamabadur, R., Koizumi, K., Stivers, C., Nagle, J.,
Poole, S., and Oldenwald, W. 1998. Regulation
of POU genes by castor and hunchback estab-
lishes layered compartments in the Drosophila
CNS. Genes & Devel. 12:246-260.
Current Protocols in Molecular Biology
Supplement 44
14.11.11
In situ
Hybridization
and Immuno-
histochemistry

Keller, E. 1995. Objective lenses for confocal mi-
croscopy. In Handbook of Biological Confocal
Microscopy, 2nd ed. (J. Pawley, ed.) pp. 111-
126. Plenum, New York.
Kino, G.S. 1995. Intermediate optics in Nipkow disk
microscopes. In Handbook of Biological Confo-
cal Microscopy, 2nd ed. (J. Pawley, ed.) pp.
155-166. Plenum, New York.
Majilof, L. and Forsgren, P. 1993. Confocal micros-
copy: Important considerations for accurate im-
aging. In Cell Biological Applications of Confo-
cal Microscopy (B. Matsumoto, ed.) pp. 79-97.
Academic Press, San Diego.
Matsumoto, B. (ed.) 1993. Cell Biological Applica-
tions of Confocal Microscopy. Academic Press,
London.
Sandison, D.R., Williams, R.M., Wells, K.S., Strick-
ler, J., and Webb, W.W. 1995. Quantitative fluo-
rescence confocal laser scanning microscopy. In
Handbook of Biological Confocal Microscopy,
2nd ed. (J. Pawley, ed.) pp. 39-54. Plenum, New
York.
Shotton, D.M. 1993. Electronic acquistion of light
microscope images. In Electronic Light Micros-
copy (D.M. Shotton, ed.) pp. 1-38. Wiley-Liss,
New York.
Svobodoa, K., Tank, D.W., and Denk, W. 1996.
Direct measurement of coupling between den-
dritic spines and shaft. Science 272:716-719.
Terasaki, M. and Dailey, M.E. 1995. Confocal mi-
croscopy of living cells. In Handbook of Biologi-
cal Confocal Microscopy, 2nd ed. (J. Pawley, ed.)
pp. 327-346. Plenum, New York.
Tsien, R.Y. and Bacskai, B.J. 1995. Video-rate con-
focal microscopy. In Handbook of Biological
Confocal Microscopy, 2nd ed. (J. Pawley, ed.)
pp. 459-478. Plenum, New York.
Tsien, R.Y. and Waggoner, A. 1995. Fluorophores
for confocal microscopy. In Handbook of Bio-
logical Confocal Microscopy, 2nd ed. (J. Pawley,
ed.) pp. 267-280. Plenum, New York.
Waterman-Storer, C.M., Sanger, J.W., and Sanger,
J.M. 1993. Dynamics of organelles in the mitotic
spindles of living cells: Membrane and micro-
tubule interactions. Cell Motil. Cytoskel. 26:19-
39.
Webb, R.H. and Dorey, C.K. 1995. The pixilated
image. In Handbook of Biological Confocal Mi-
croscopy, 2nd ed. (J. Pawley, ed.) pp. 55-68.
Plenum, New York.
Wedekind, P., Kubitscheck, U., Heinrich, O., and
Peters, R. 1996. Line-scanning microphotolysis
for diffraction-limited measurements of lateral
diffusion. Biophys. J. 71:1621-1632.
Wessendorf, M.W. and Brelje, T.C. 1993. Multicolor
fluorescence microscopy using the laser-scan-
ning confocal microscope. Neuroprotocols
2:121-140.
Wilson, T. (ed.) 1990. Confocal Microscopy. Aca-
demic Press, London.
Wilson, T. 1995. The role of the pinhole in confocal
imaging system. In Handbook of Biological
Confocal Microscopy, 2nd ed. (J. Pawley, ed.)
pp. 167-182. Plenum, New York.
KEY REFERENCES
Inoue and Spring, 1997. See above.
Covers basics of light microscopy, video micros-
copy, and much more.
Matsumoto, B. (ed.) 1993. See above.
Good source of practical information.
Pawley, J. (ed.) 1995. Handbook of Biological Con-
focal Microscopy, 2nd ed. Plenum, New York.
Excellent source of theoretical and technical infor-
mation.
Russ, J. 1995. The Image Processing Handbook.
CRC Press, Boca Raton, Fla.
Excellent source of information about digital image
processing.
Shotton, D.M. (ed.) 1993. Electronic Light Micros-
copy. John Wiley and Sons, New York.
Covers many aspects of light microscopy, including
confocal microscopy.
Wilson, T. (ed.) 1990. See above.
Good source of theoretical background information.
INTERNET RESOURCES
zippy.nimh.nih.gov
Use to obtain NIH Image via FTP.
http://optics.jct.ac.il/
∼aryeh/Spectra
Source of excitation emission spectra for common
fluorophores.
http://rsb.info.nih.gov/nih-image/
Use to obtain NIH Image.
http://www.probes.com
Molecular Probes web site, including product list-
ings and much more.
http://www.mwrn
Microworld Resources, a comprehensive list of mi-
croscopy products and vendors.
listserv@ubvm.cc.buffalo.edu
Confocal e-mail listserv network.
Contributed by Carolyn L. Smith
National Institute of Neurological Disorders
and Stroke
Bethesda, Maryland
Supplement 44
Current Protocols in Molecular Biology
14.11.12
Basic Confocal
Microscopy
Wyszukiwarka
Podobne podstrony:
7 LASER SCANNING CONFOCAL MICROSCOPY Intro
Practical Aspects of Quantitative Confocal Microscopy by John M Murray
Microsoft Visual Basic NET 2003 Księga eksperta
Microsoft Visual Basic NET 2003 Ksiega eksperta vbn23k
Microsoft Visual Basic NET 2003 Ksiega eksperta vbn23k
Microsoft Visual Basic NET 2003 Ksiega eksperta vbn23k
A Confocal Laser Scanning Microscope investigation of different dental adhesives bonded to root cana
Microsoft Visual Basic NET 2003 Ksiega eksperta 2
Microsoft Visual Basic NET 2003 Ksiega eksperta 2
Confocal optics microscopy for biochemical and cellular high throughput screening by Lenka Zemanová,
Nowy Prezentacja programu Microsoft PowerPoint 5
Rola rynku i instytucji finansowych INowy Prezentacja programu Microsoft PowerPoint
ZADANIA PiP Prezentacja Microsoft PowerPoint
Nowy Prezentacja programu Microsoft PowerPoint ppt
3 ABAP 4 6 Basic Functions
więcej podobnych podstron