
High Probability Futures Options
Trading with Seasonal Straddles
Steve Lentz
Director of Education and Research
OptionVue Research, Inc.
Disclaimer
Option trading can involve highly volatile
returns and unlimited risk. Option trading is
not suitable for every investor.
Results depicted in this presentation come
from historical and theoretical option prices.
Future results will vary and not necessarily
match the results presented here.
Overview
Introduction to the Straddle Play
The Role of Volatility
Coffee
Soybeans
Natural Gas
Introduction to the
Straddle Play
Call Option – Right but not obligation to buy a futures
contract at a certain price on a certain date
Put Option – Right but not obligation to sell a futures
contract at a certain price on a certain date
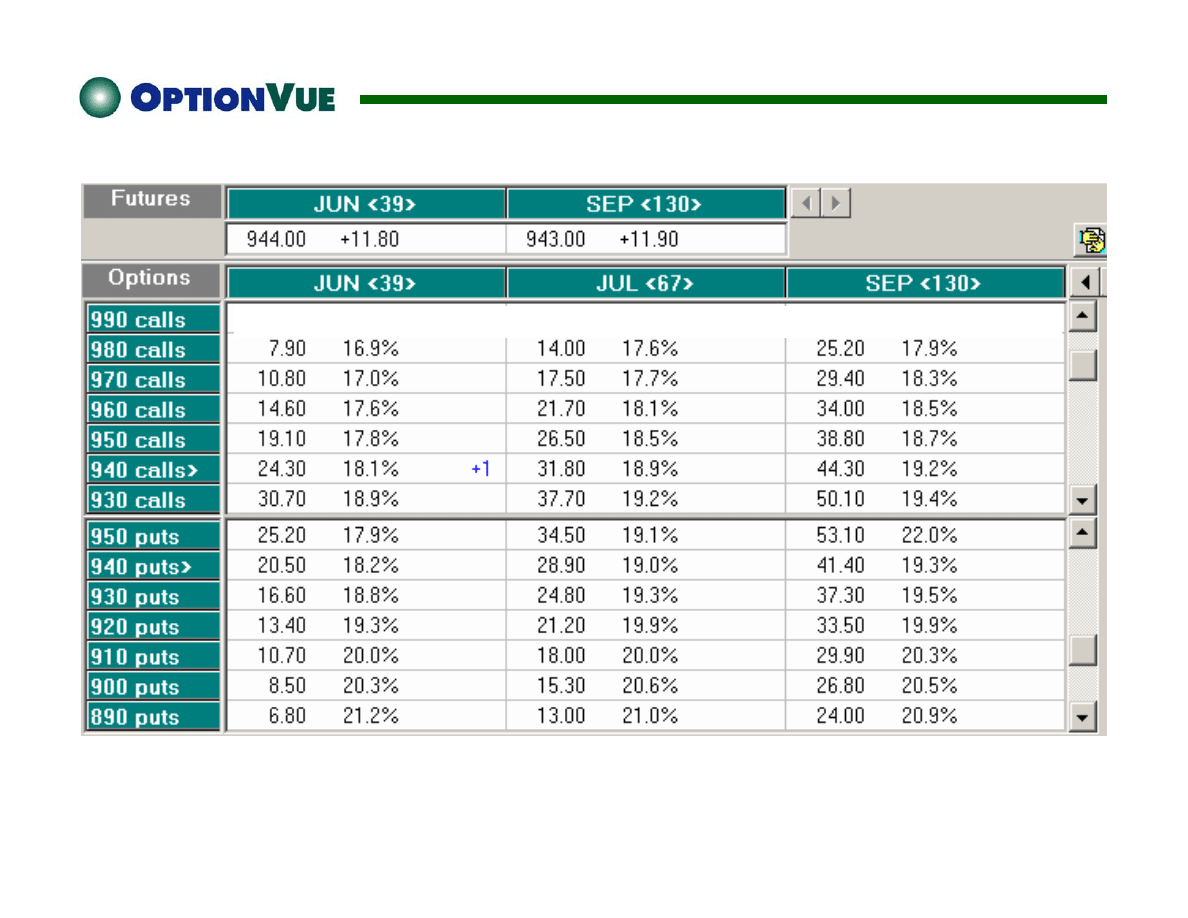
Last MIV Trade Last MIV Trade Last MIV Trade
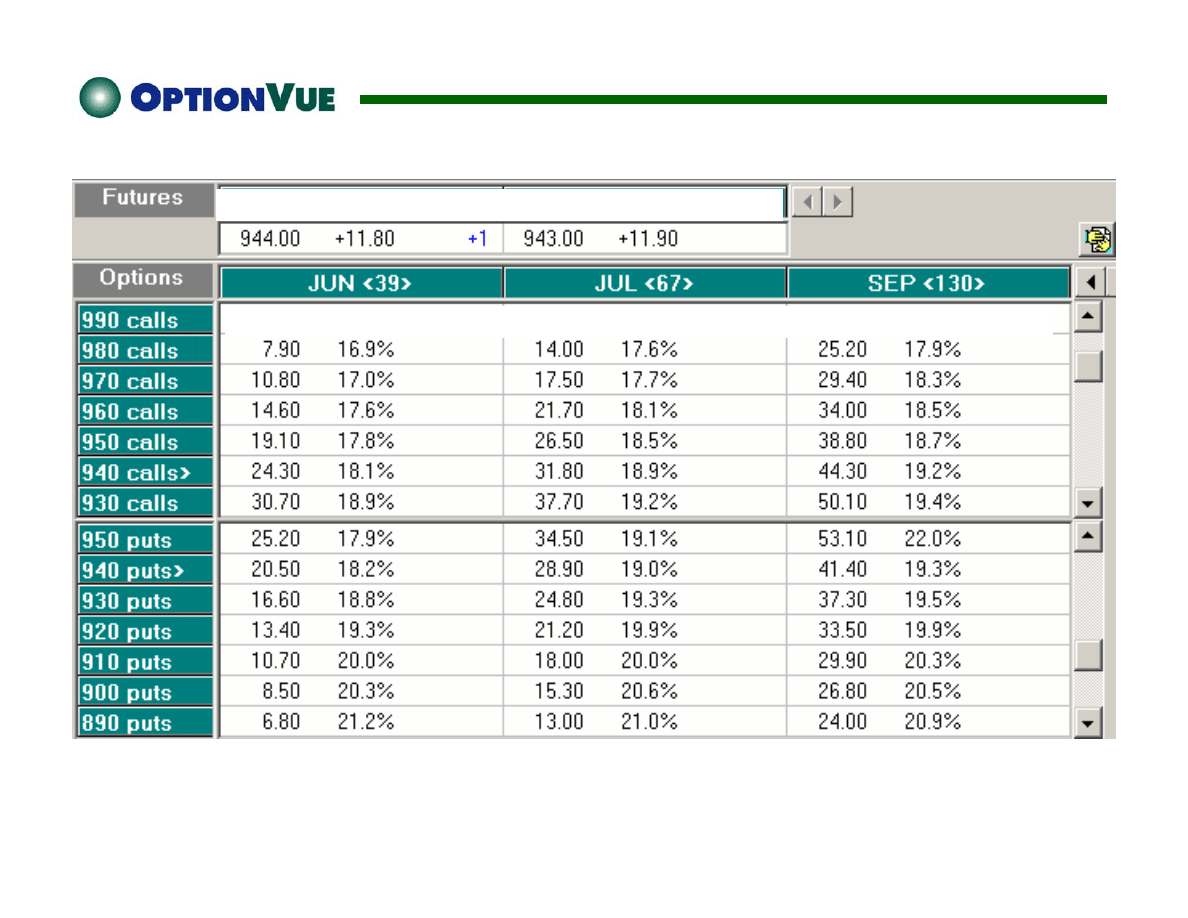
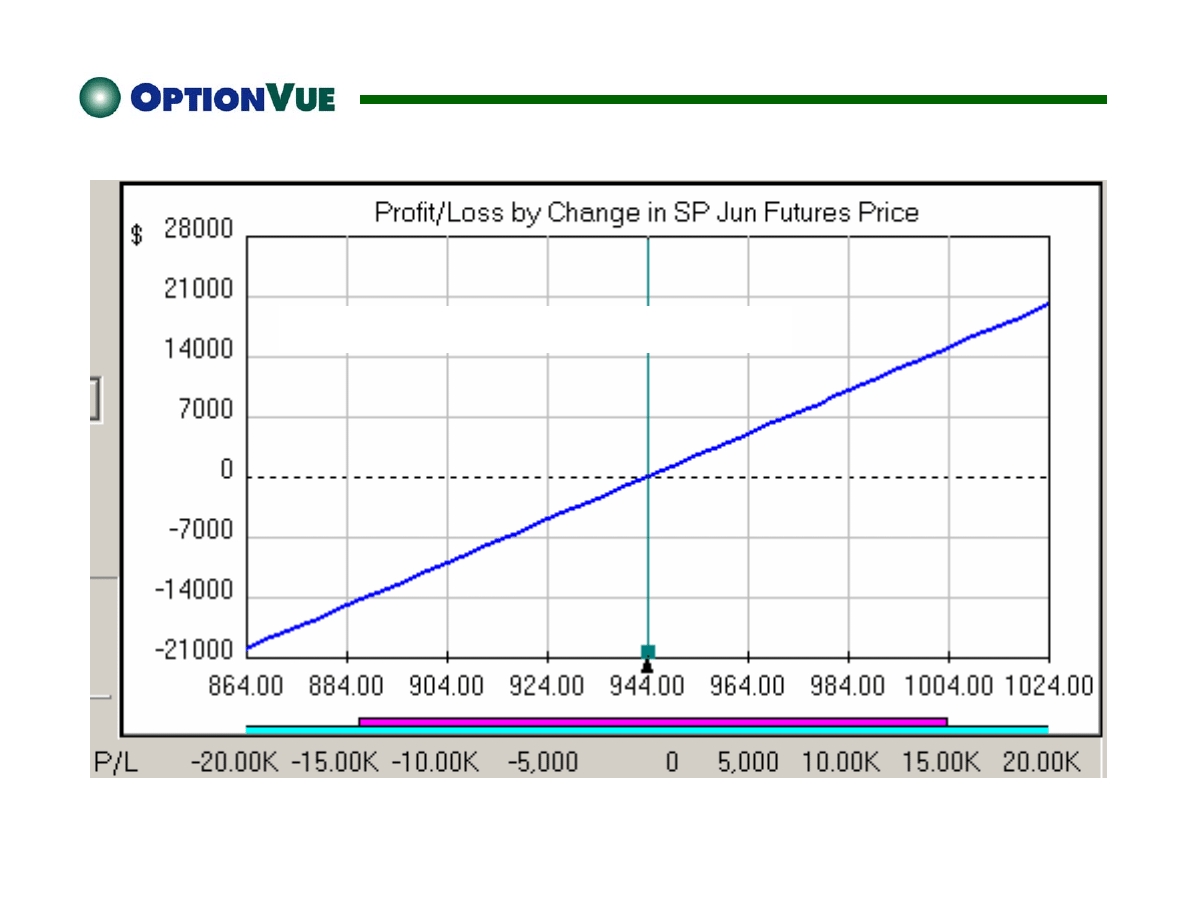
S&P 500 Index Futures
5/12/03
Last Change Trade Last Change
Trade
S&P 500 Index Futures
5/12/03
Long 1 June Futures Contract
Last MIV Trade Last MIV Trade Last MIV Trade
S&P 500 Index Futures
5/12/03
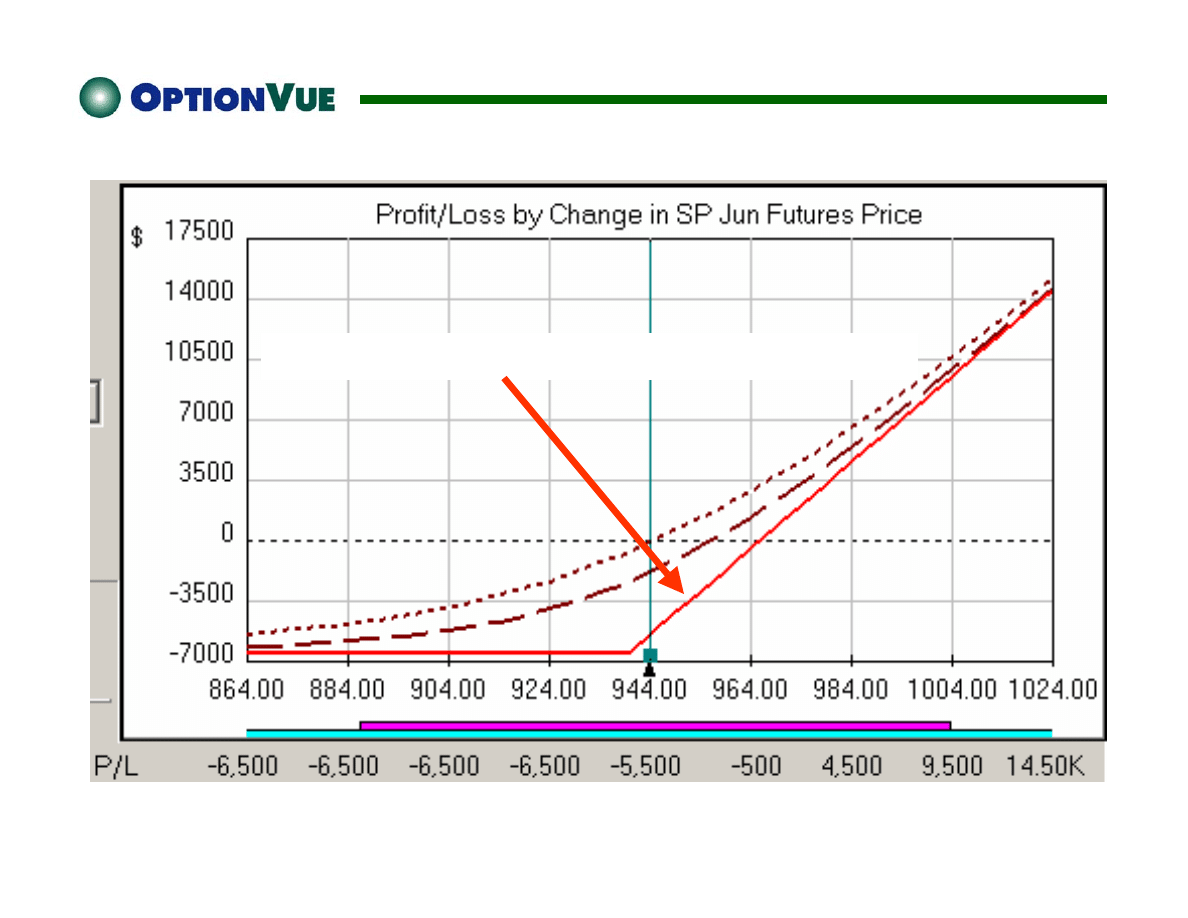
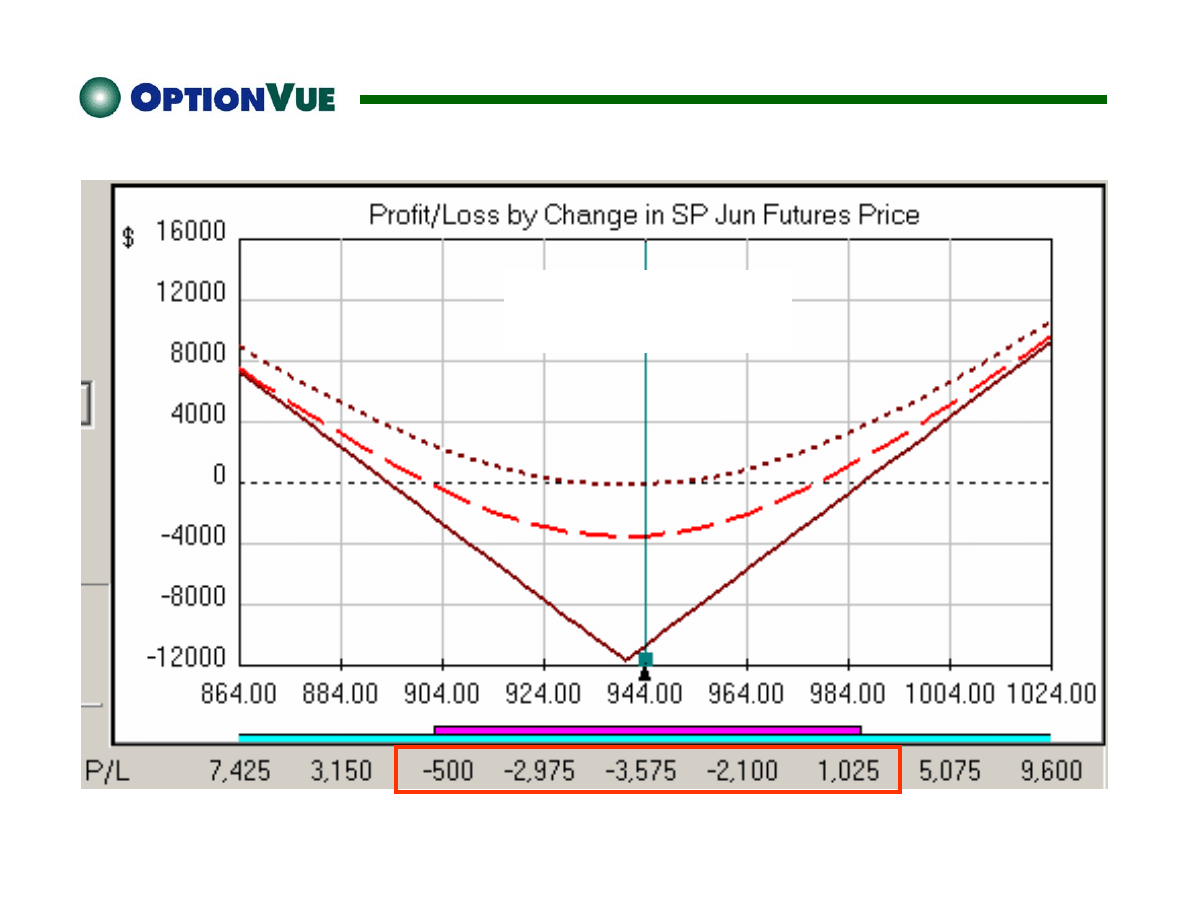
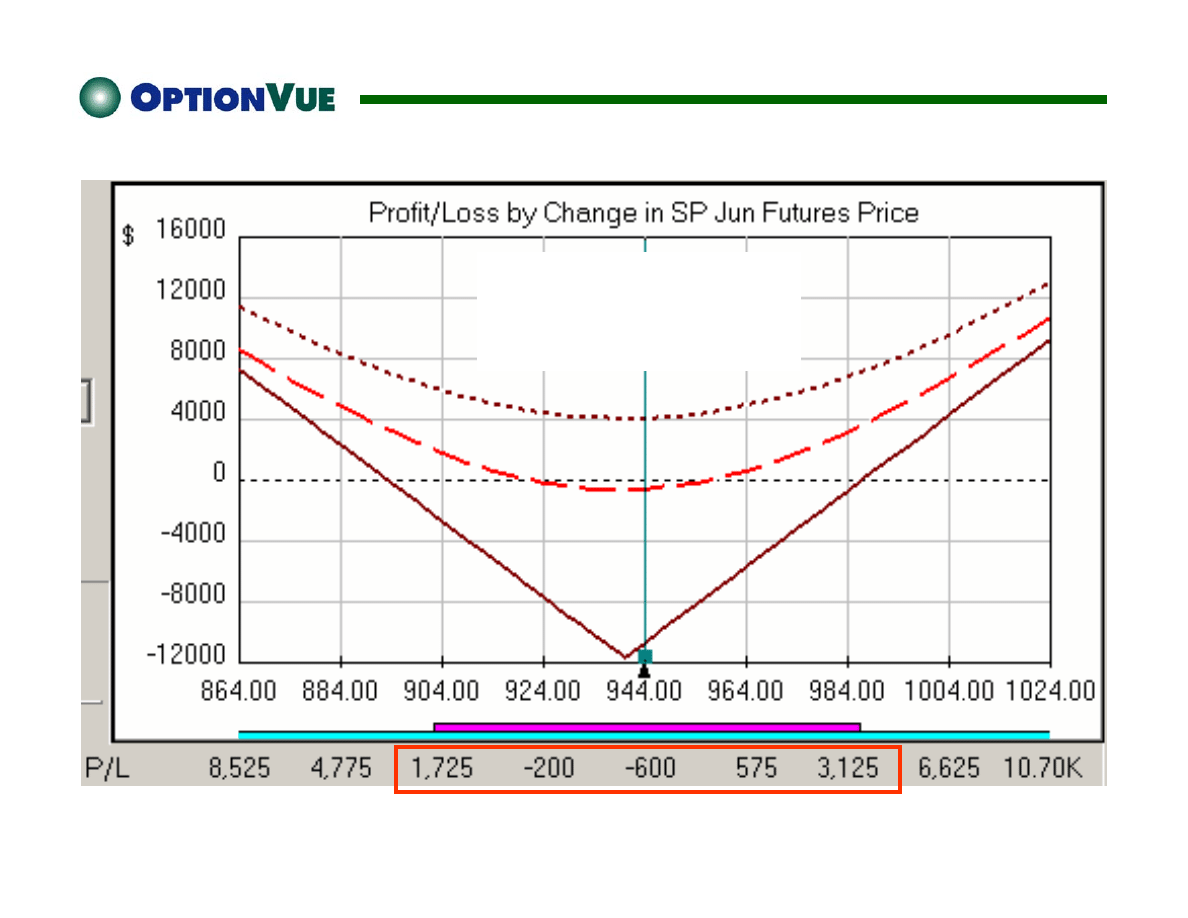
S&P 500 Index Futures
Today’s Risk/Reward Line
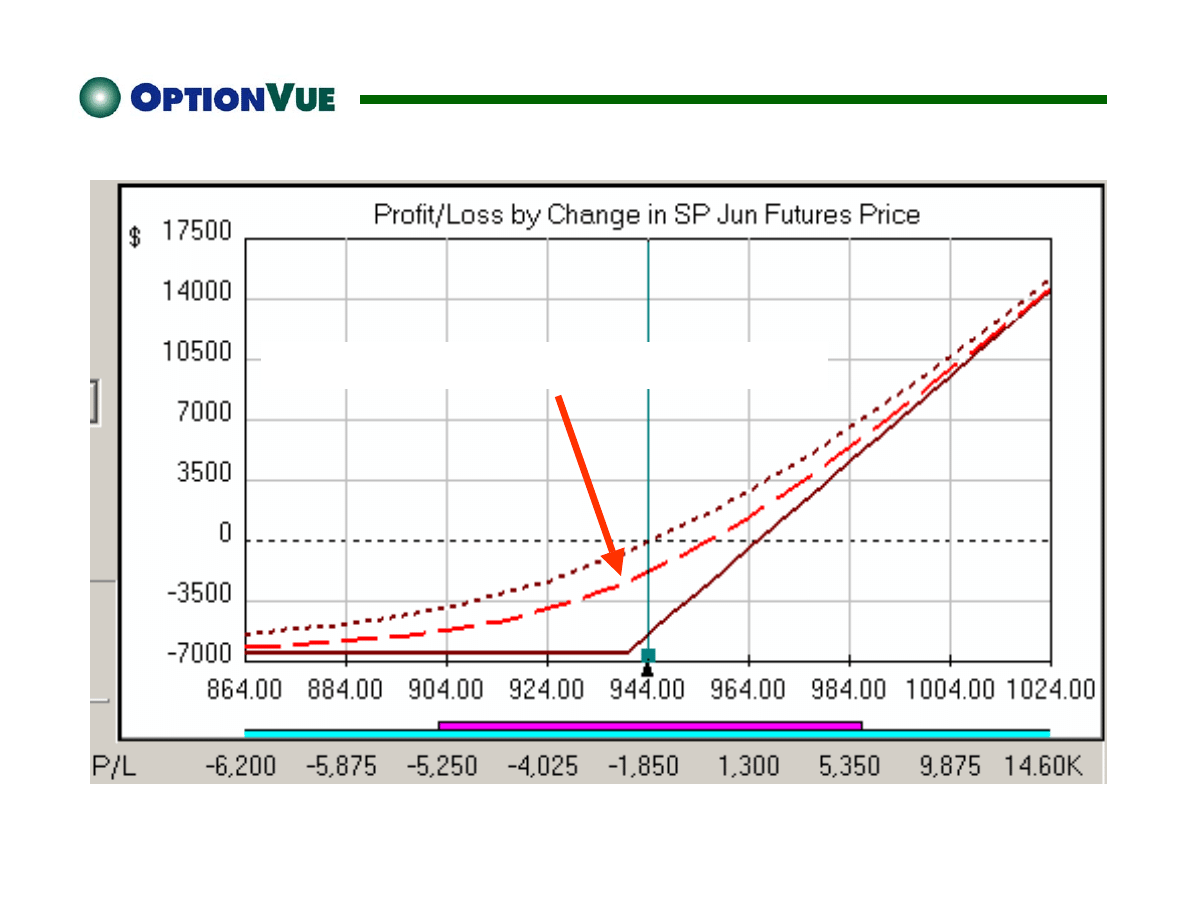
S&P 500 Index Futures
Risk/Reward Line for 20 Days Away
S&P 500 Index Futures
1
st
Standard Deviation of
Possible Price Outcomes
Based on Last Month of Trading
S&P 500 Index Futures
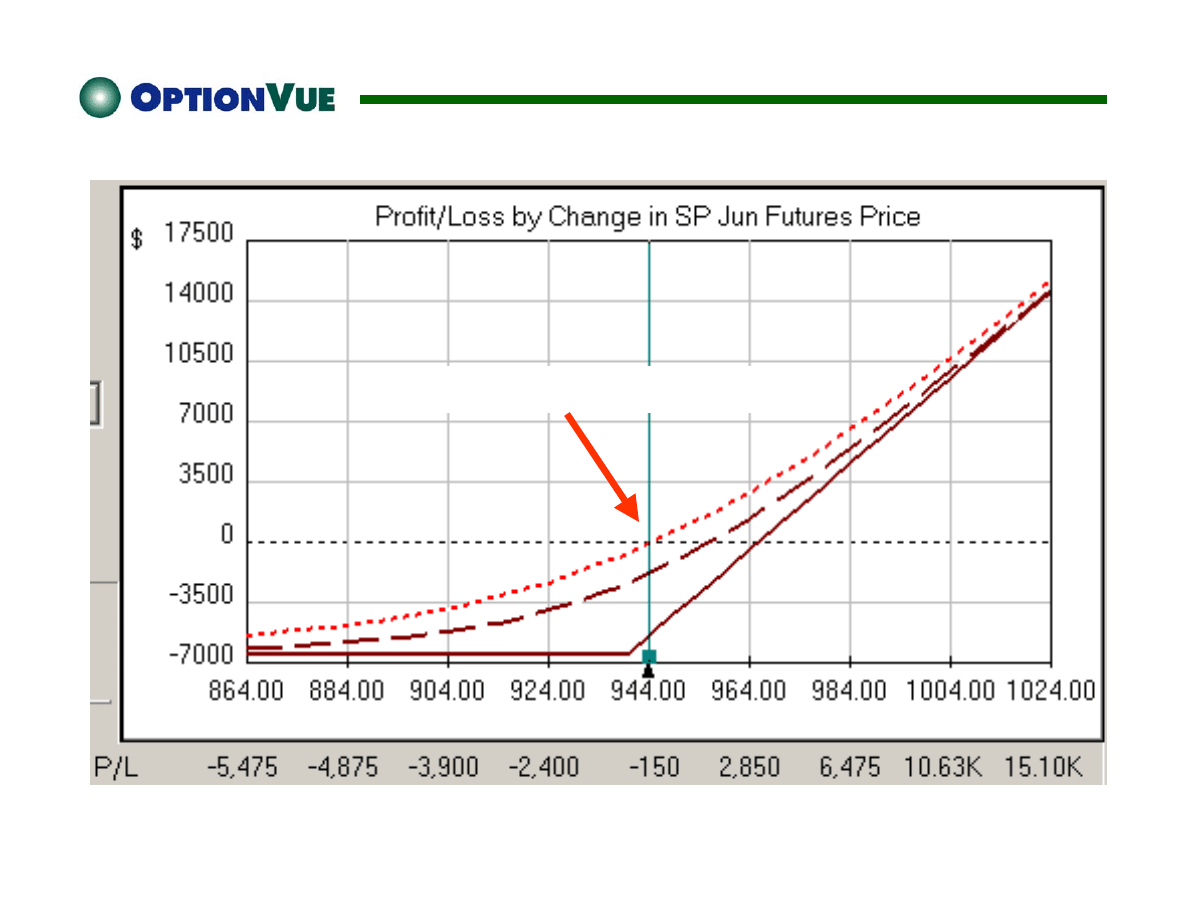
Risk/Reward Line for Expiration in 39 Days
S&P 500 Index Futures
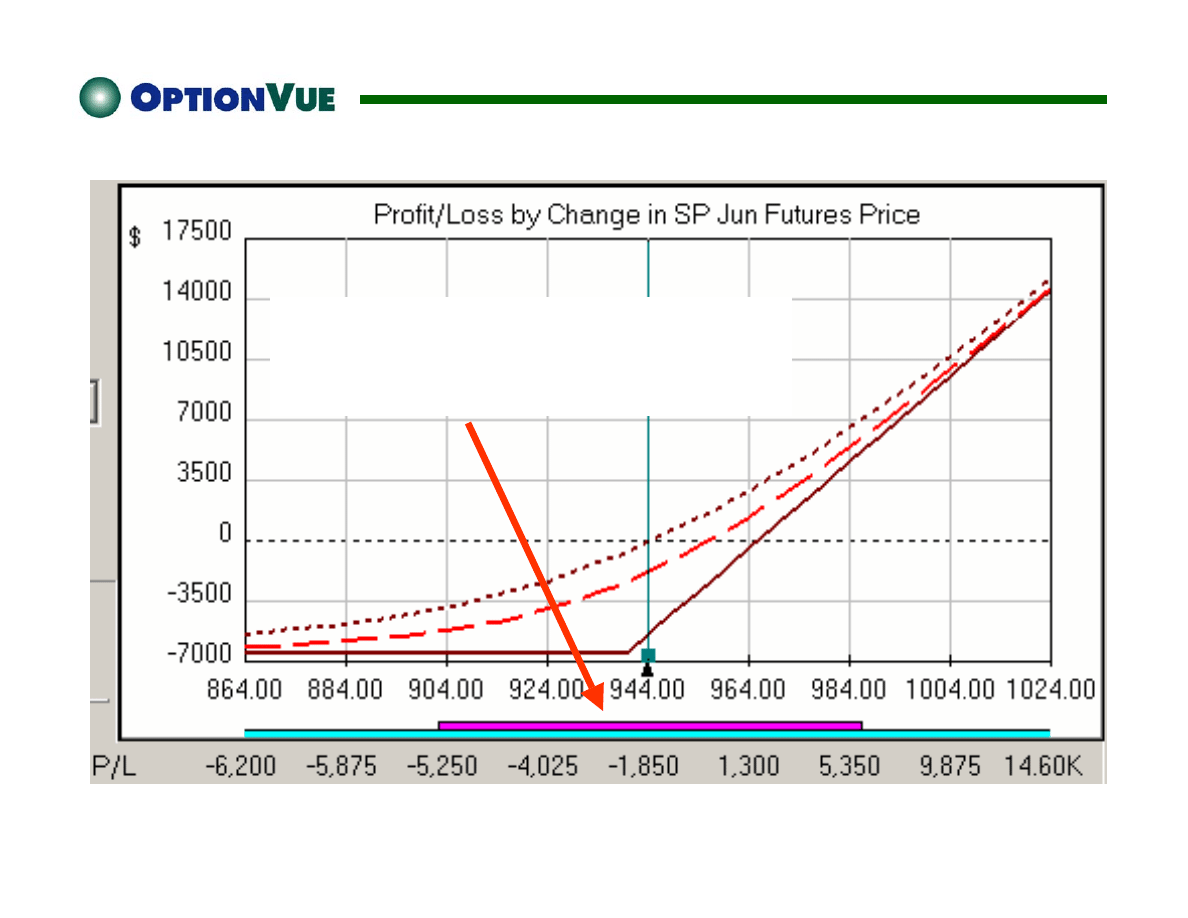
Buy 1 June 940 Put Option
S&P 500 Index Futures
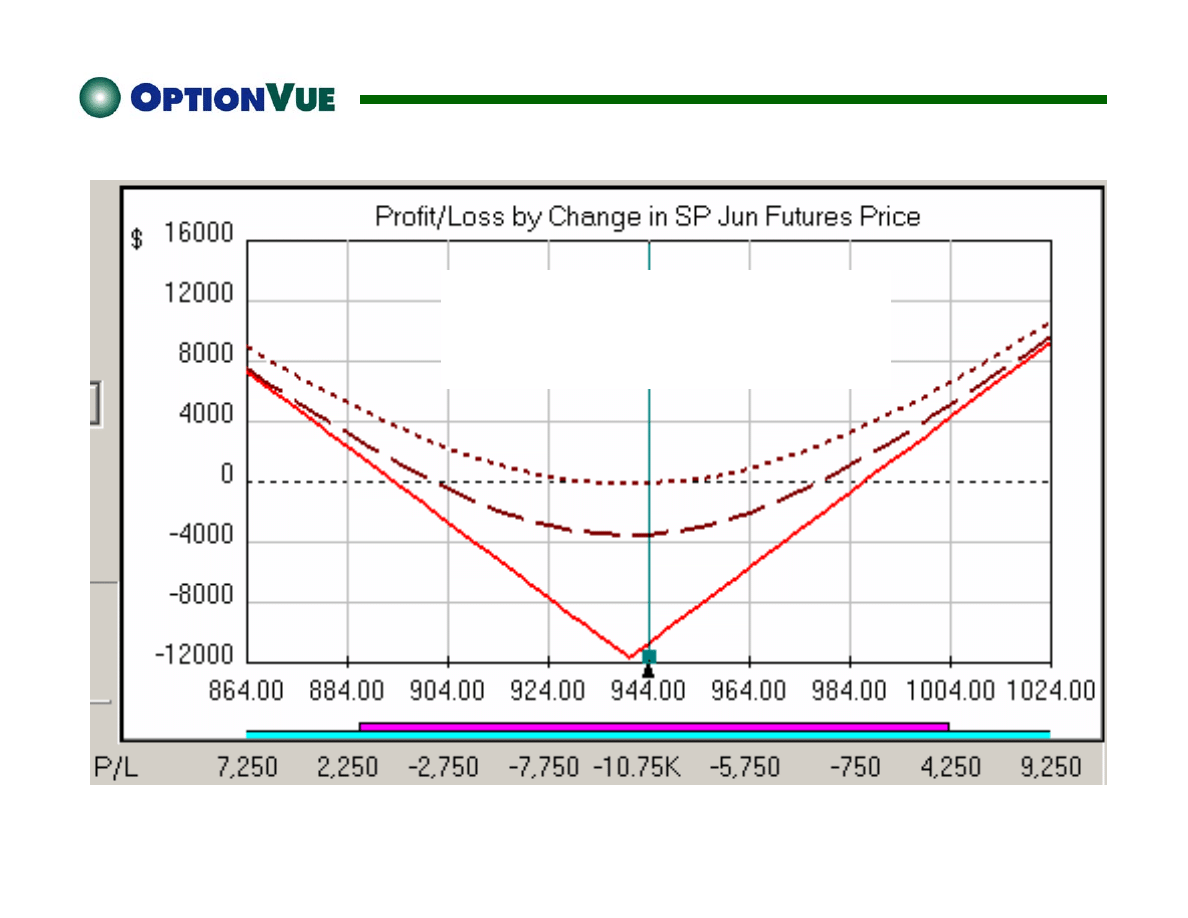
Straddle
Buy 1 June 940 Call Option
Buy 1 June 940 Put Option
The Role of Volatility
IMPLIED VOLATILITY (IV)
Measures the volatility of the underlying asset
implied by current option prices
Higher IV Means More Time Premium to Buy or Sell
The Role of Volatility
STATISTICAL VOLATILITY (SV)
Measures how much the price of the asset itself has
bounced around recently
Higher SV Means a Wider Standard Deviation of
Possible Price Outcomes
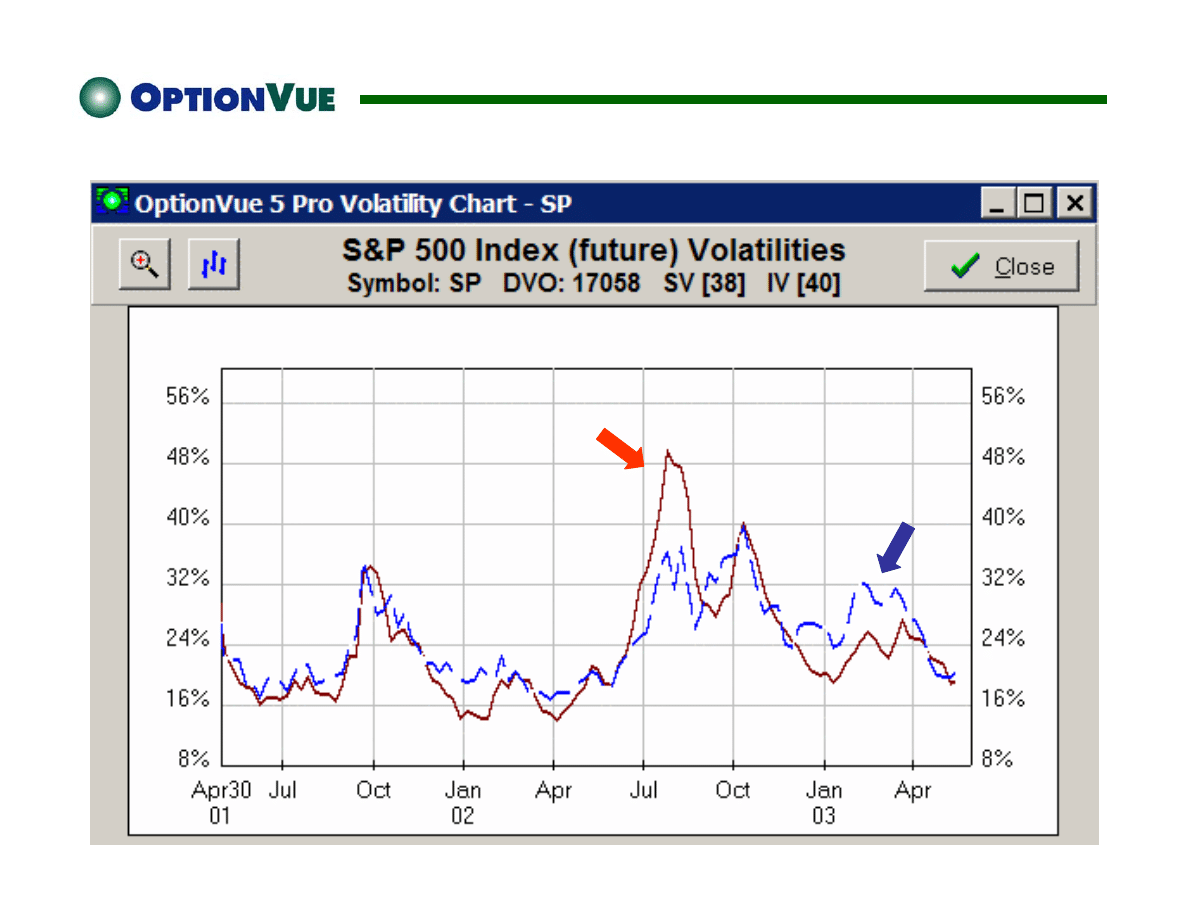
S&P 500 Index Futures
SV
IV
S&P 500 Index Futures
June Straddle
20 Days Out
S&P 500 Index Futures
June Straddle
20 Days Out
IV Increases by 7 %
The Role of Volatility
Vega
Option’s Sensitivity to IV Movement
Daily $ Amount Gained/Lost with a 1% IV Move
Theta
Option’s Sensitivity to Time
Daily $ Amount Gained/Lost with 1 Day of Time Decay
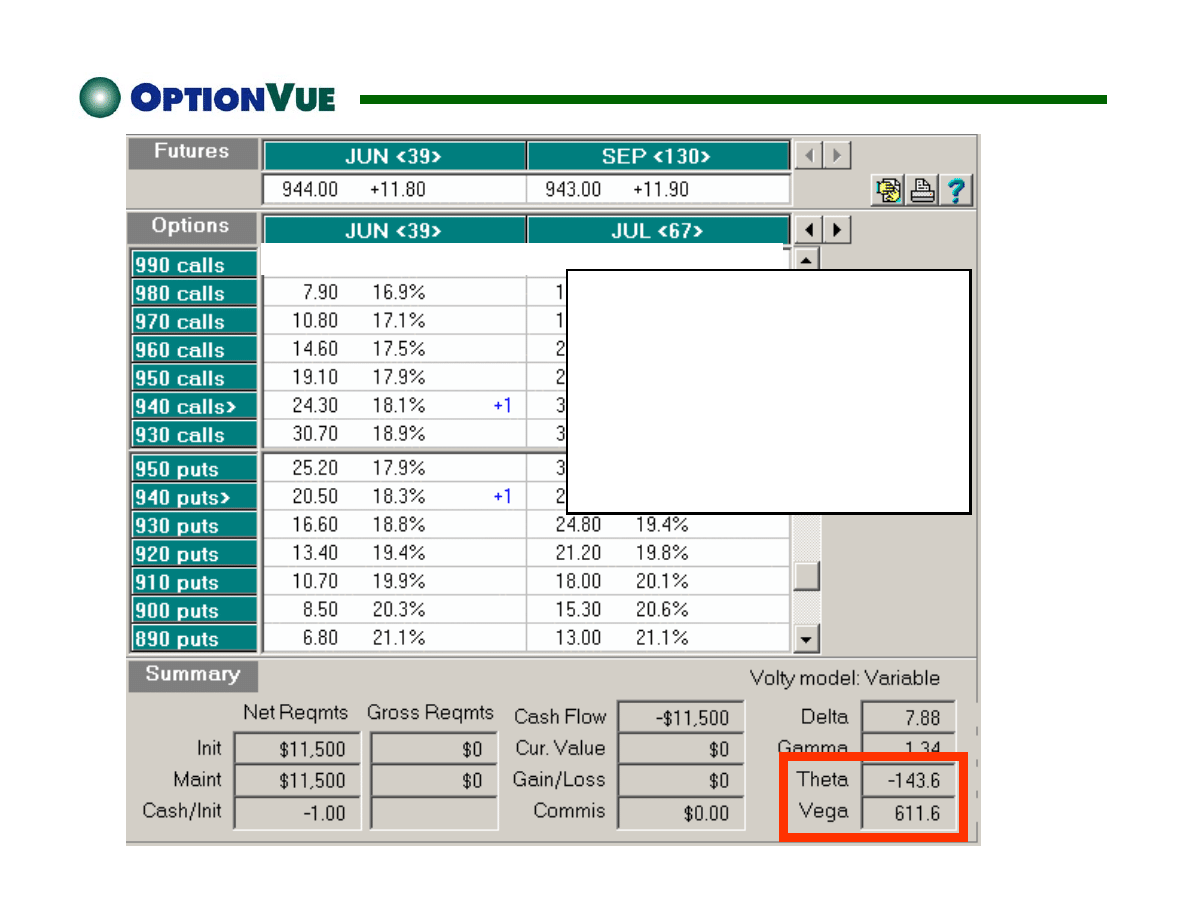
Last MIV Trade Last MIV
Trade
5/12/03
[Vega / Theta]
=
[611.6 / -143.6] =
4.26
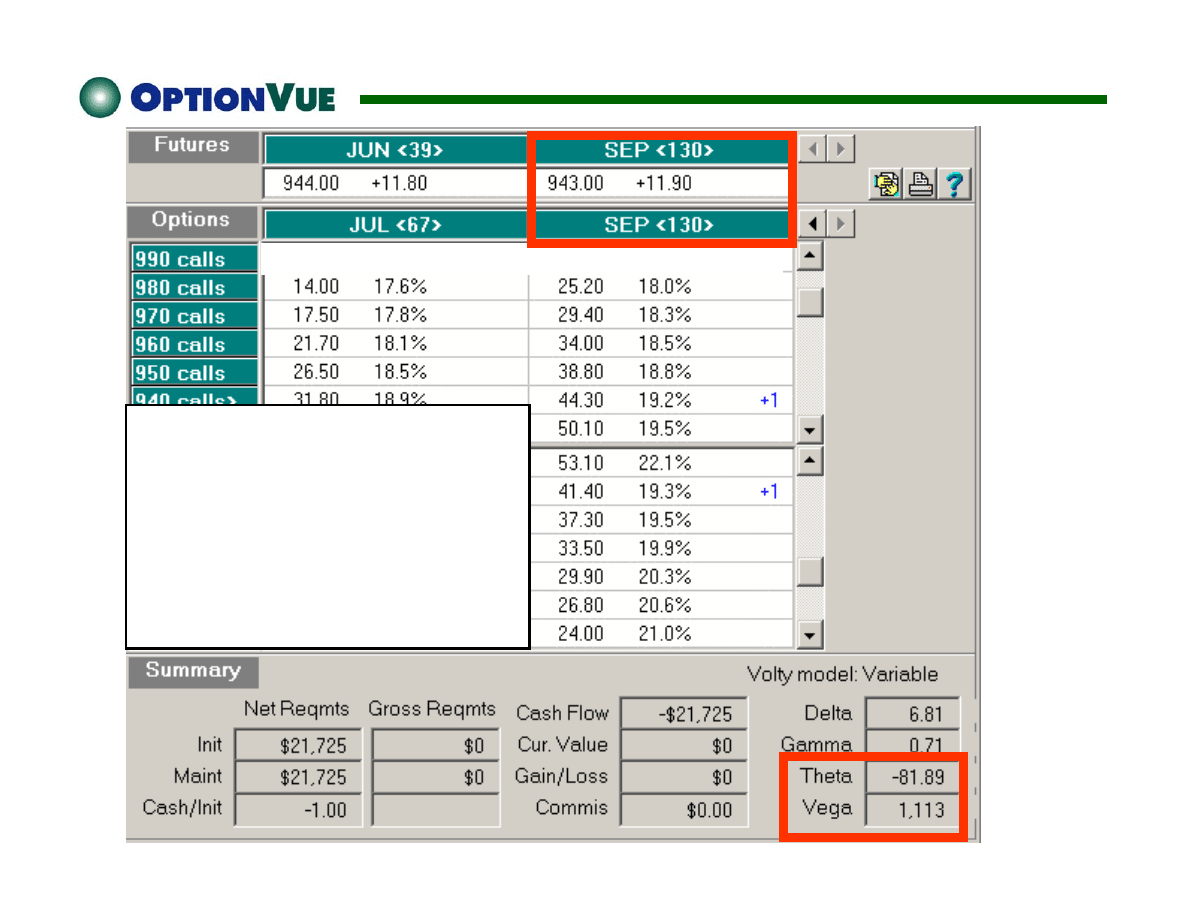
Last MIV Trade Last MIV
Trade
5/12/03
[Vega / Theta]
=
[1113 / -81.89] =
13.59
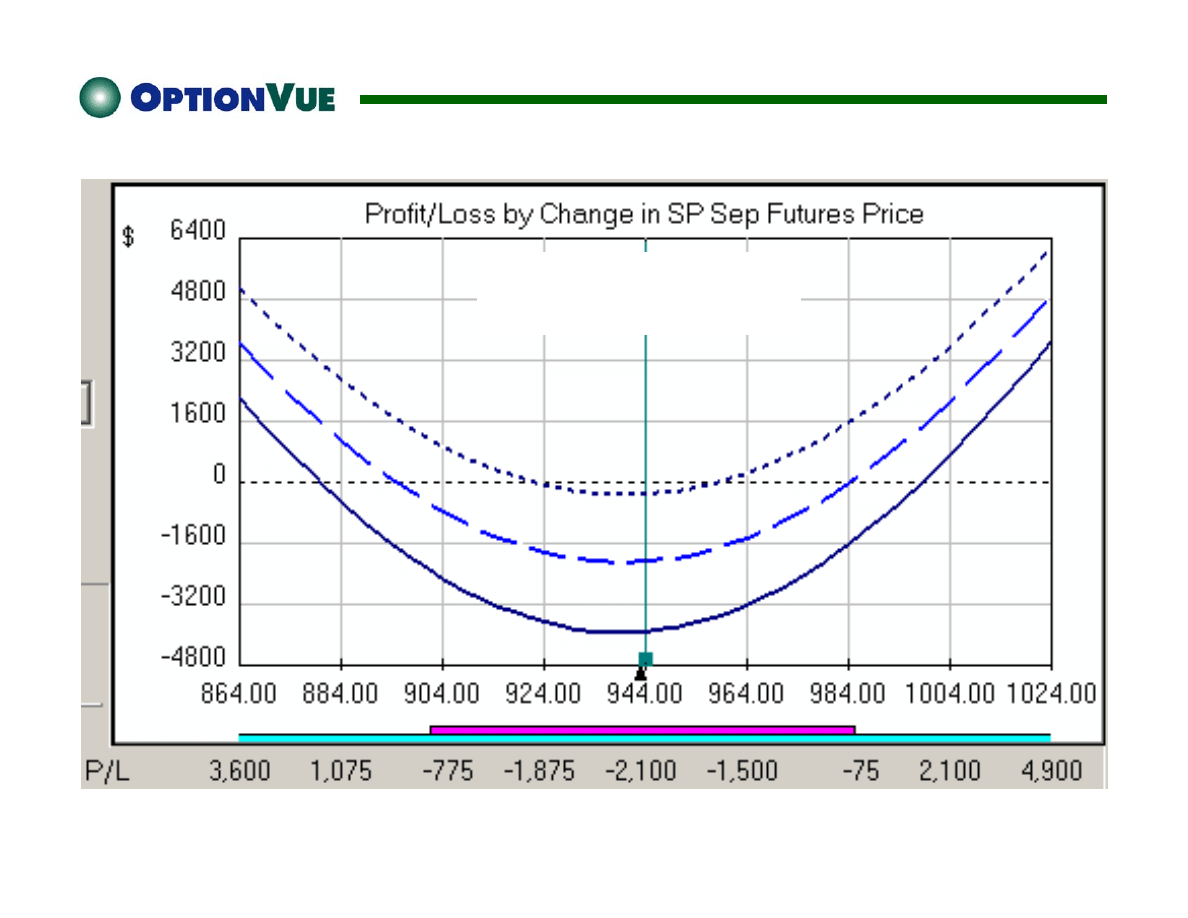
S&P 500 Index Futures
5/12/03
June Straddle
20 Days Out
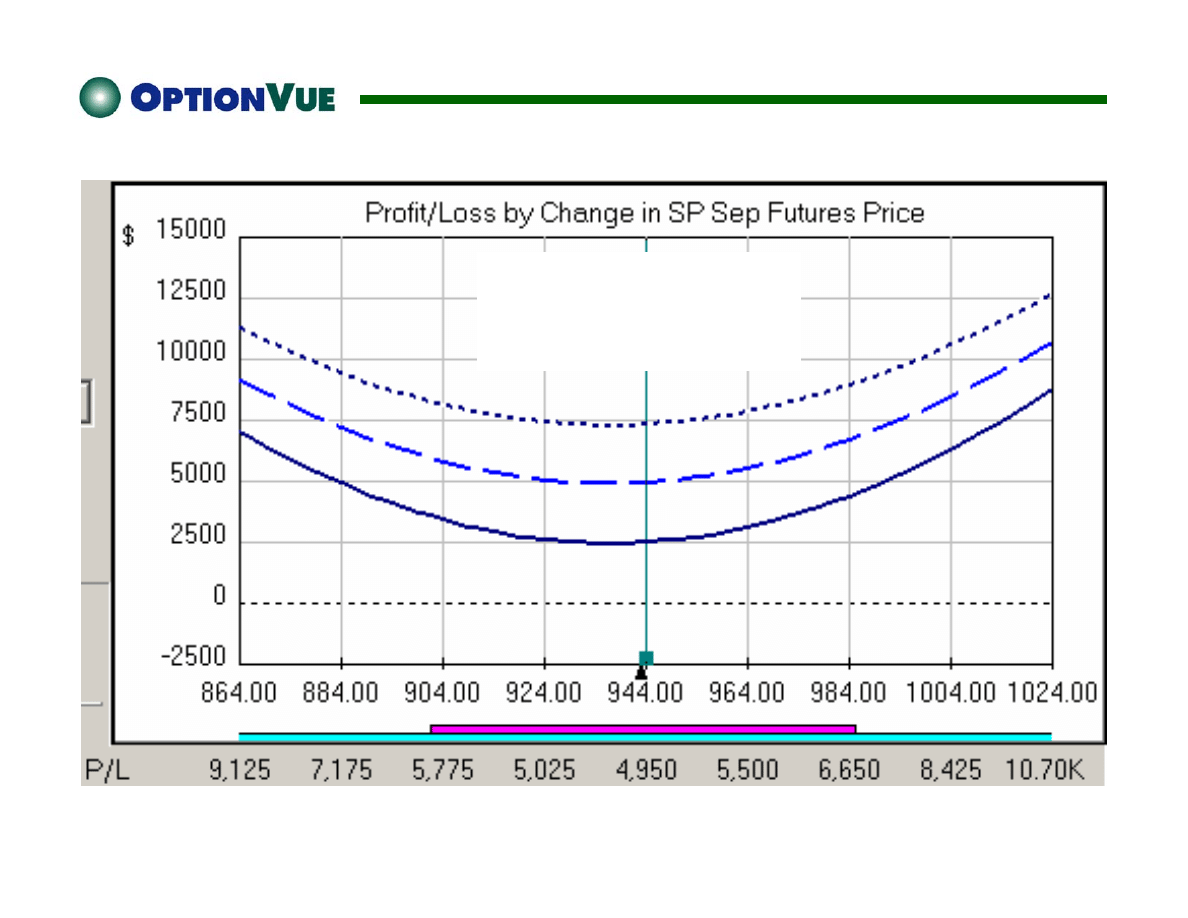
S&P 500 Index Futures
5/12/03
June Straddle
20 Days Out
IV Increases by 7%
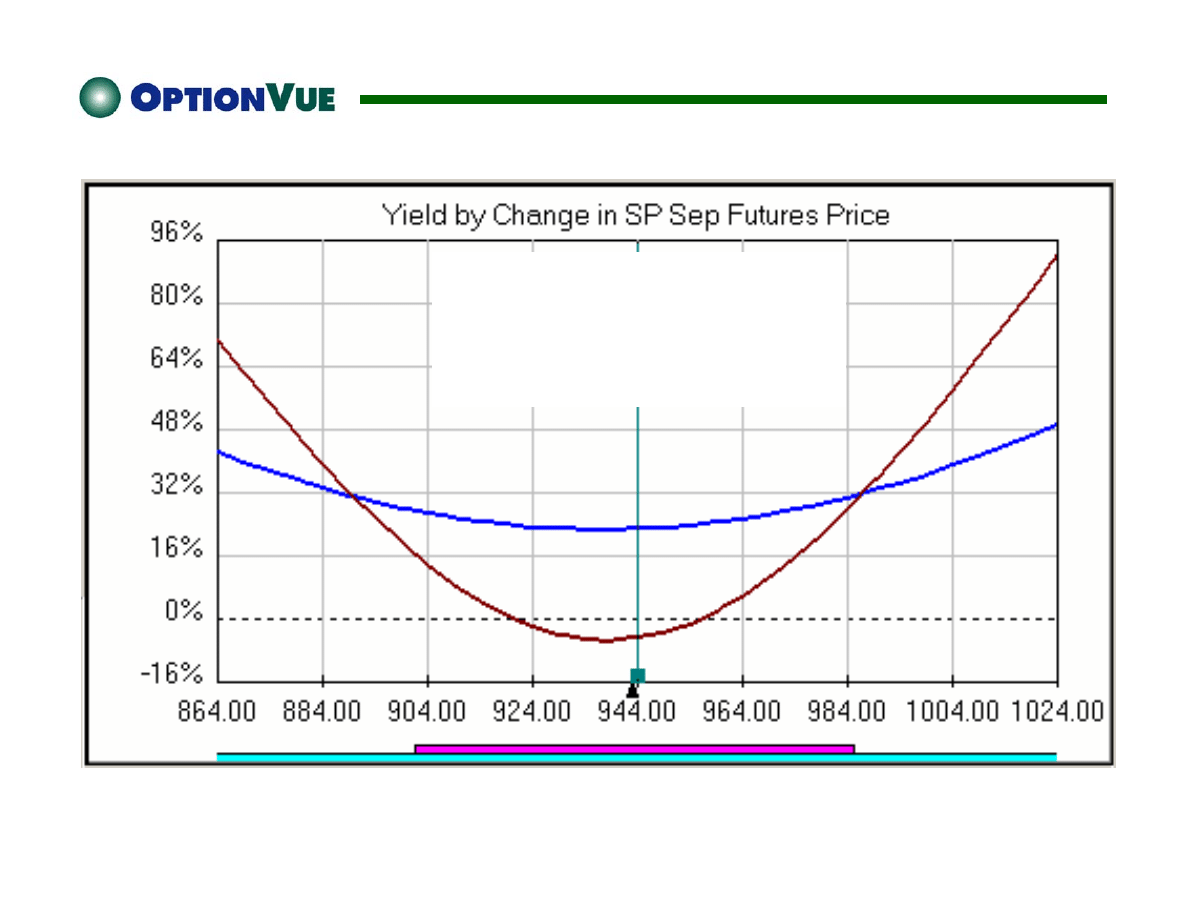
S&P 500 Index Futures
5/12/03
Yield Comparison of
June versus Sept Straddle
20 Days Out
IV Increases by 7%
Coffee
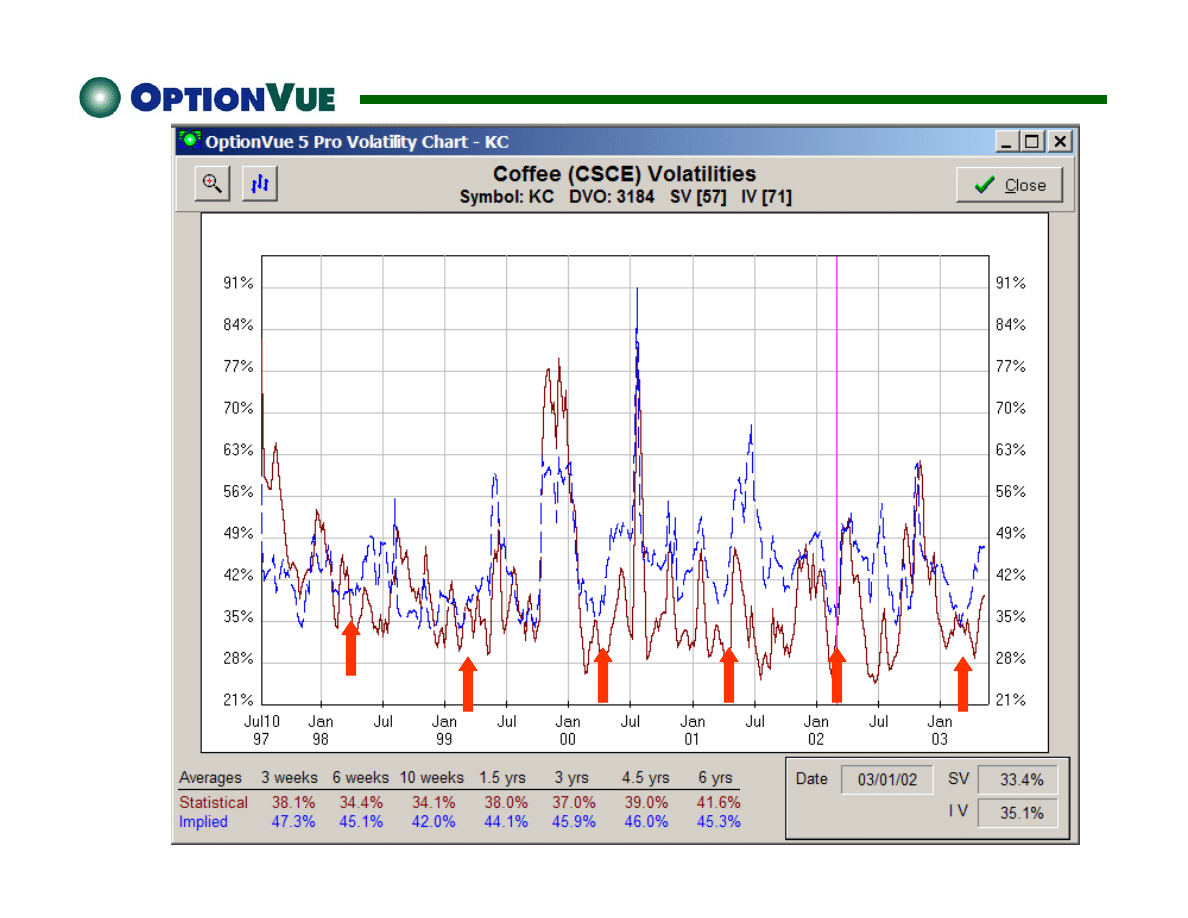
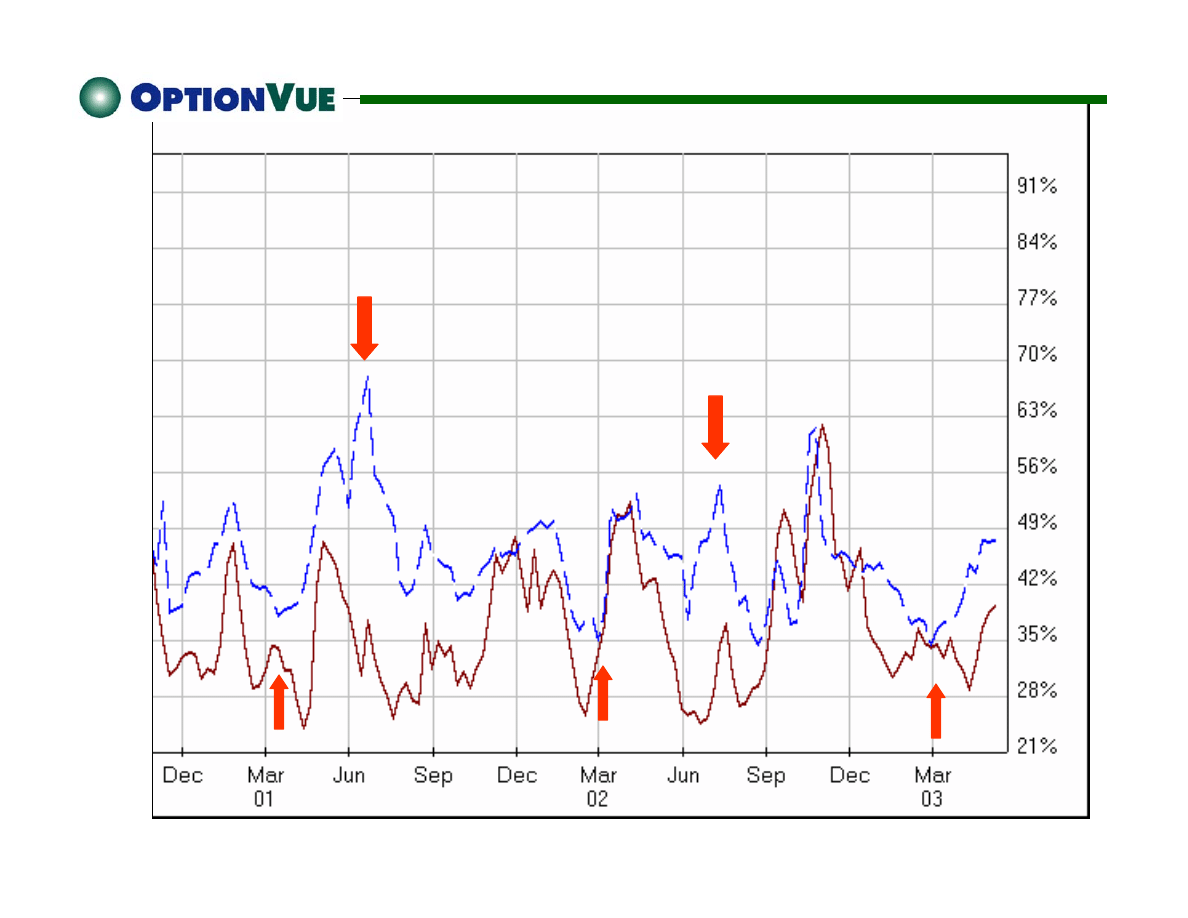
Coffee
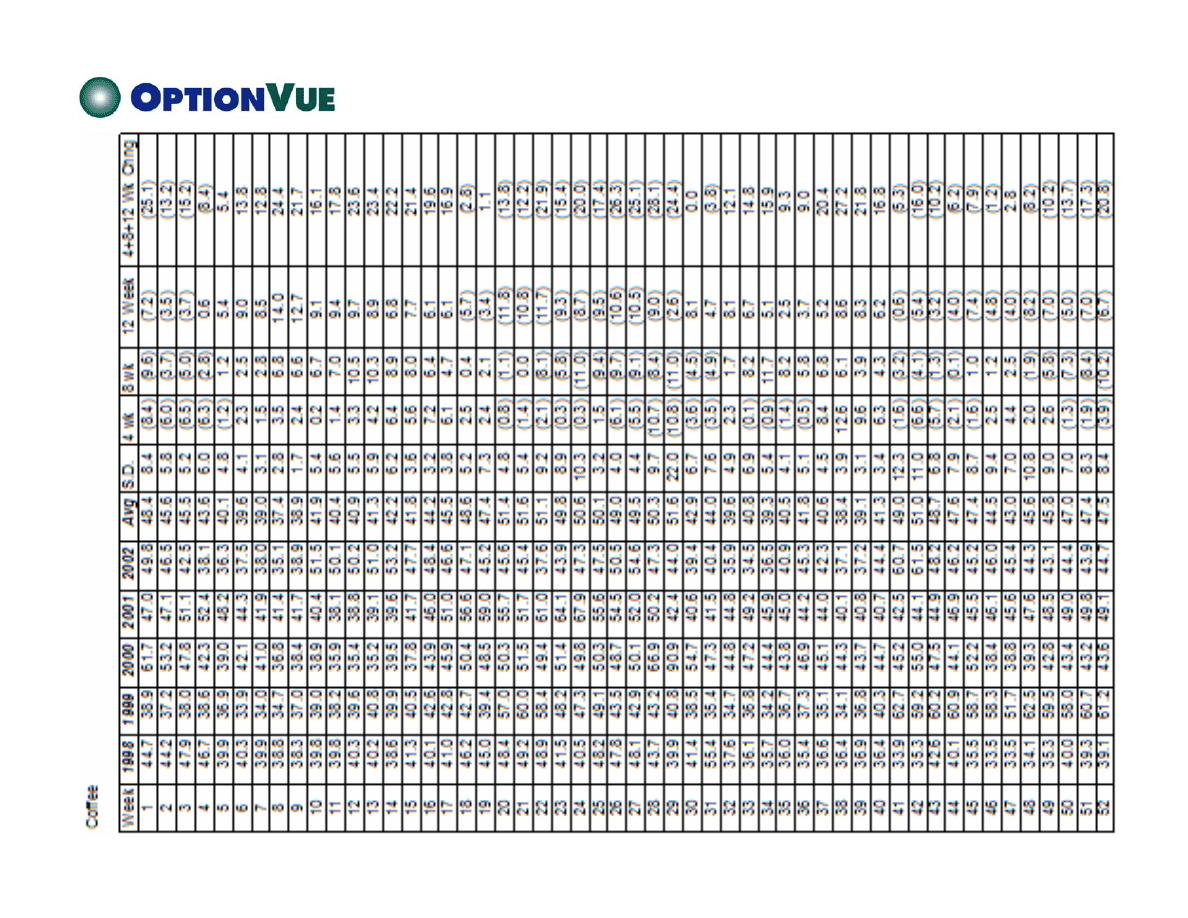
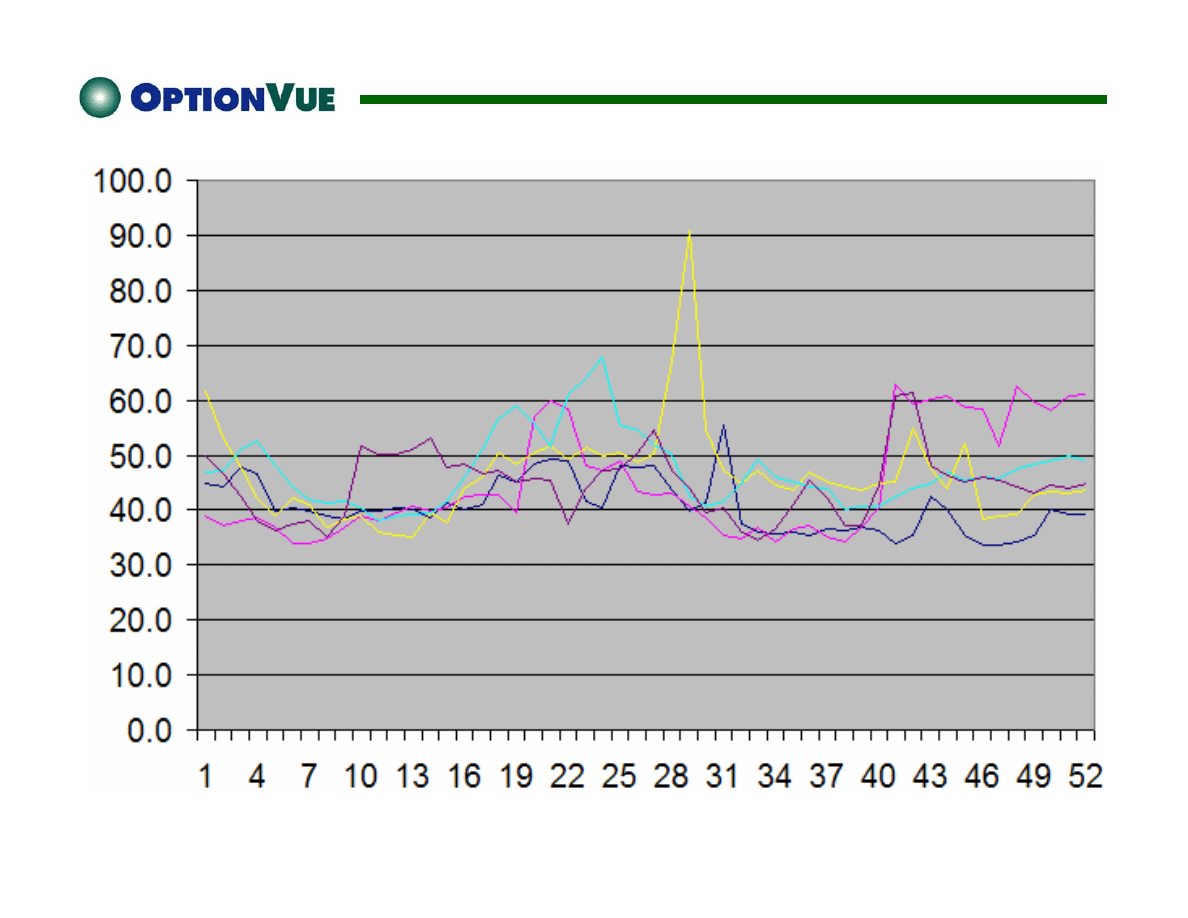
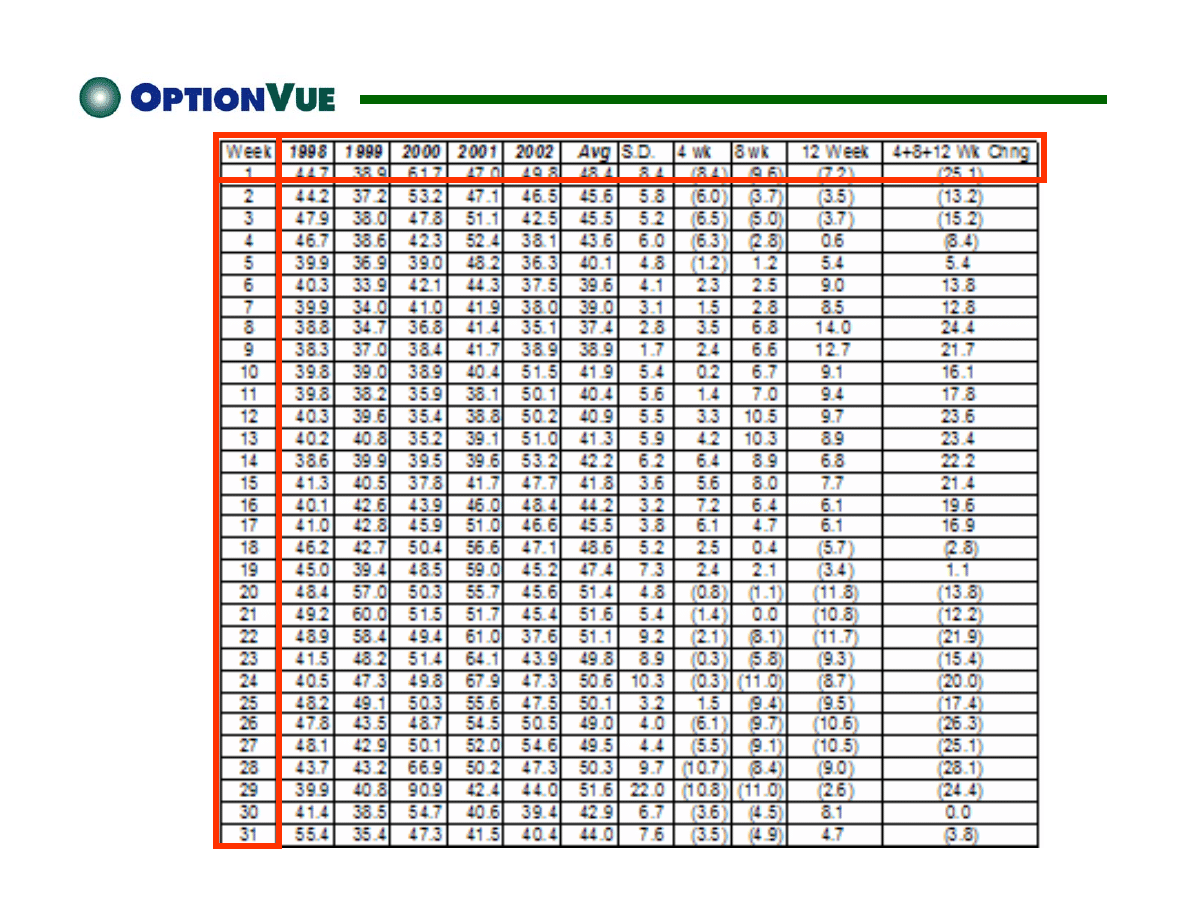
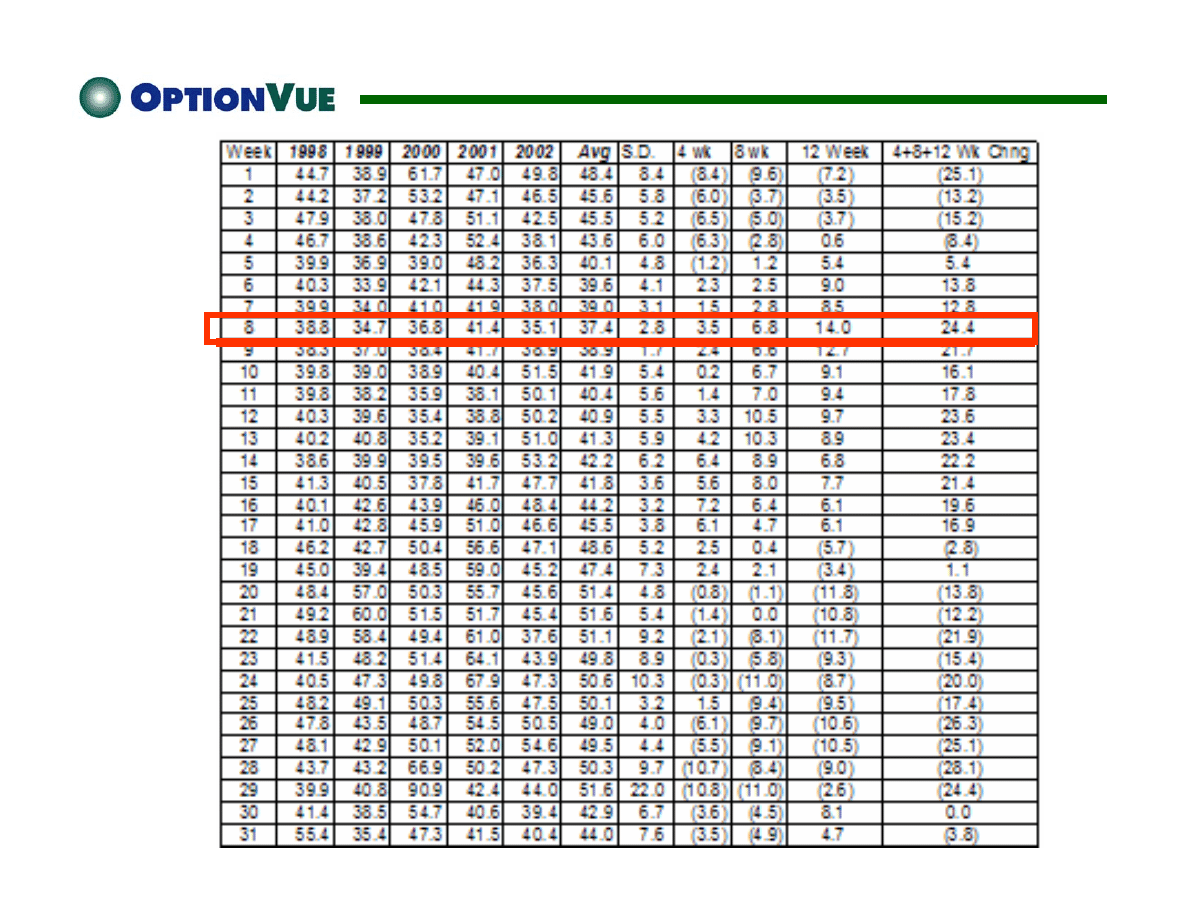
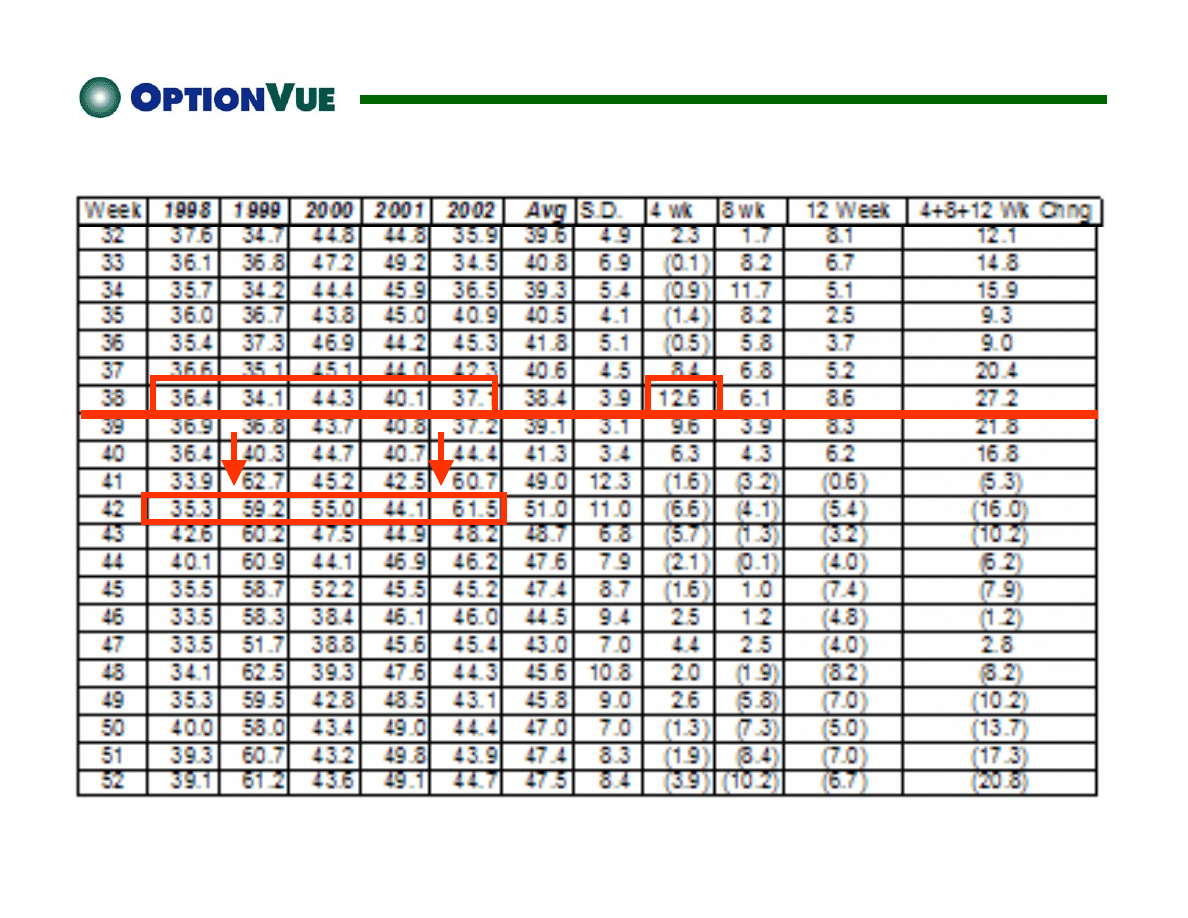
Coffee IVs by Year
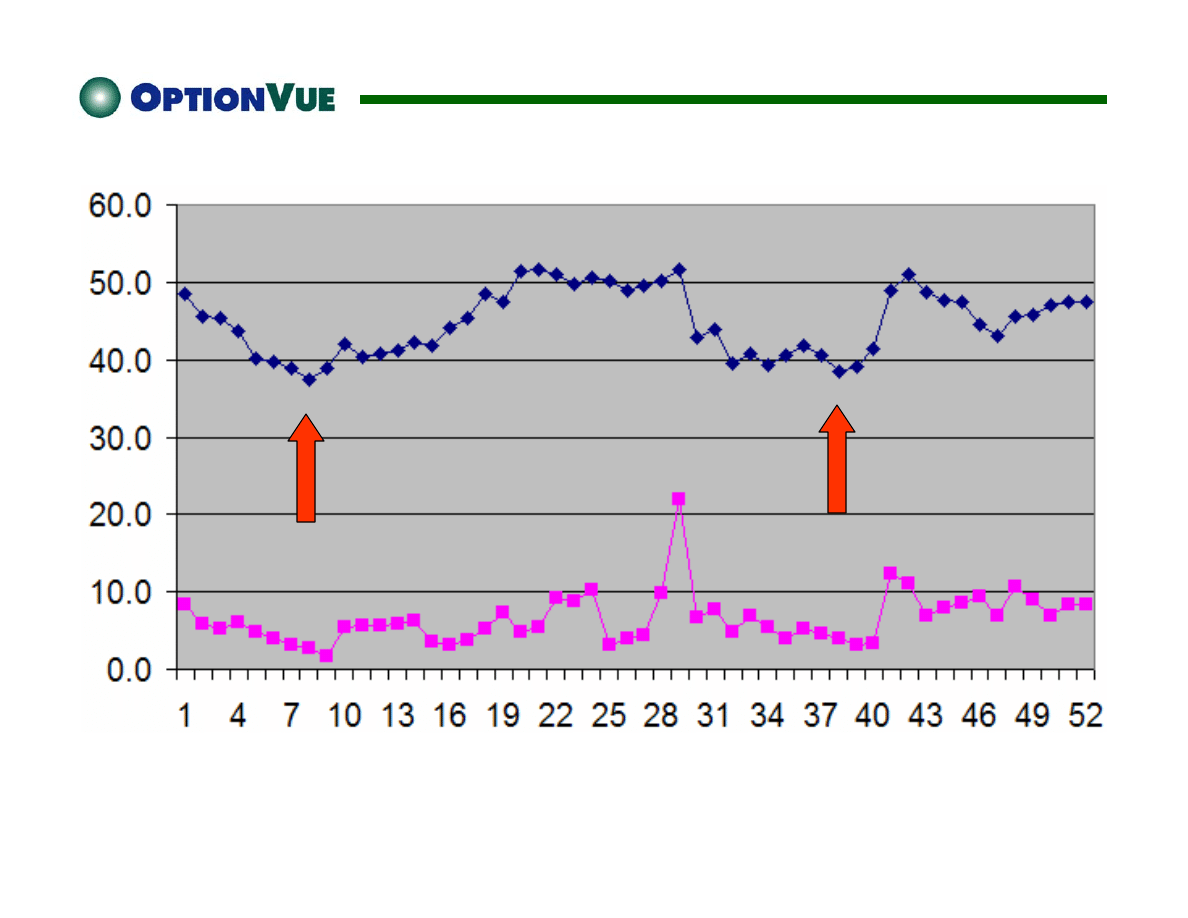
Coffee Average IVs
Coffee
Coffee
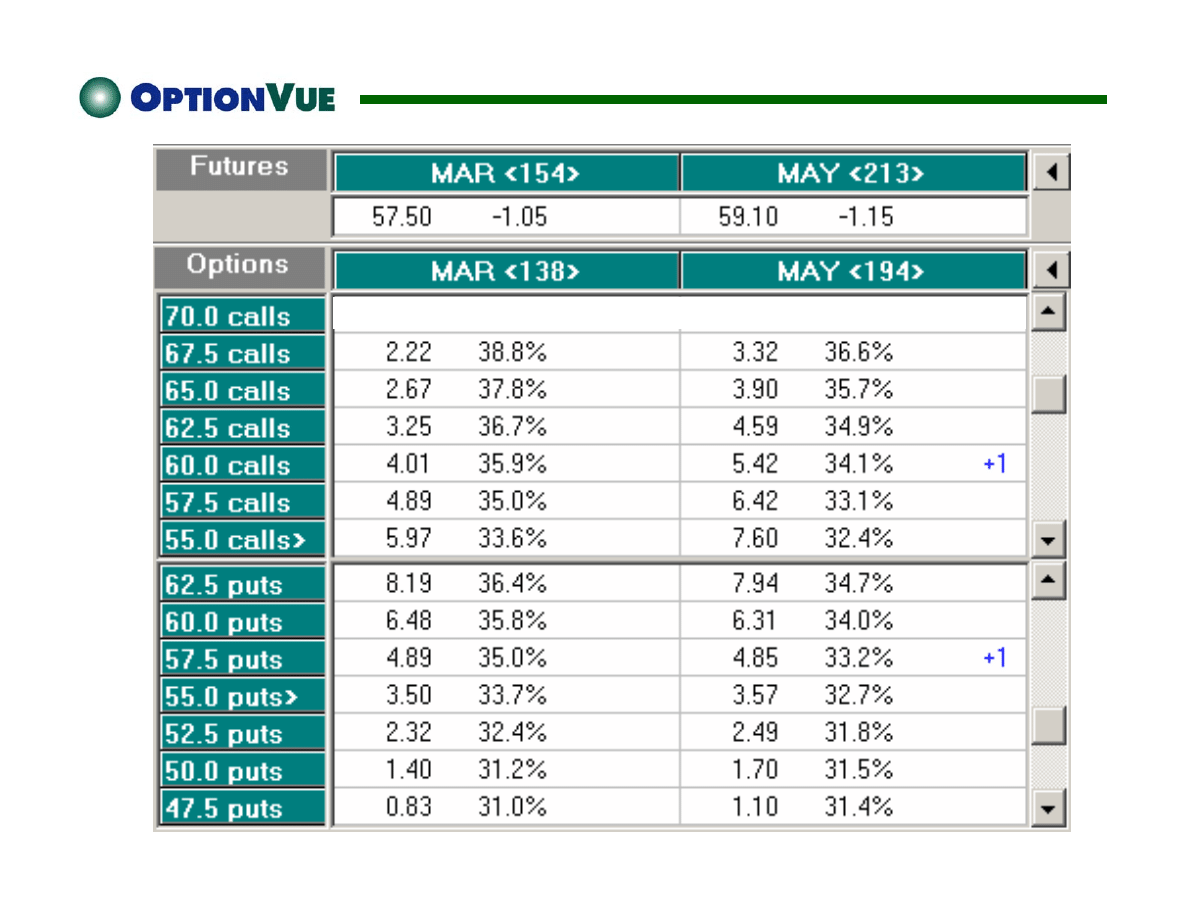
9/30/02
Last MIV Trade Last MIV Trade
$3851 Requirement
Coffee Straddle -- 30 Days Out
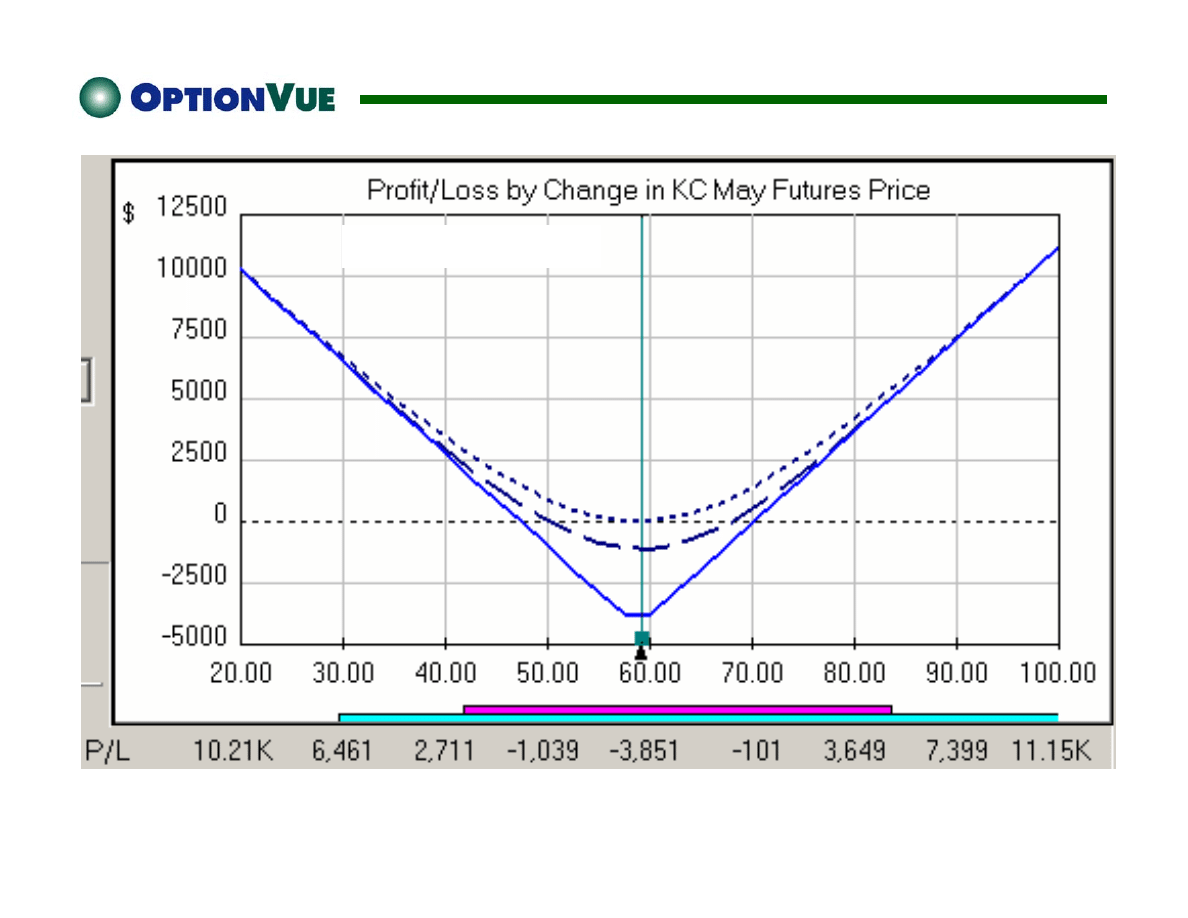
Coffee Straddle -- 30 Days Out
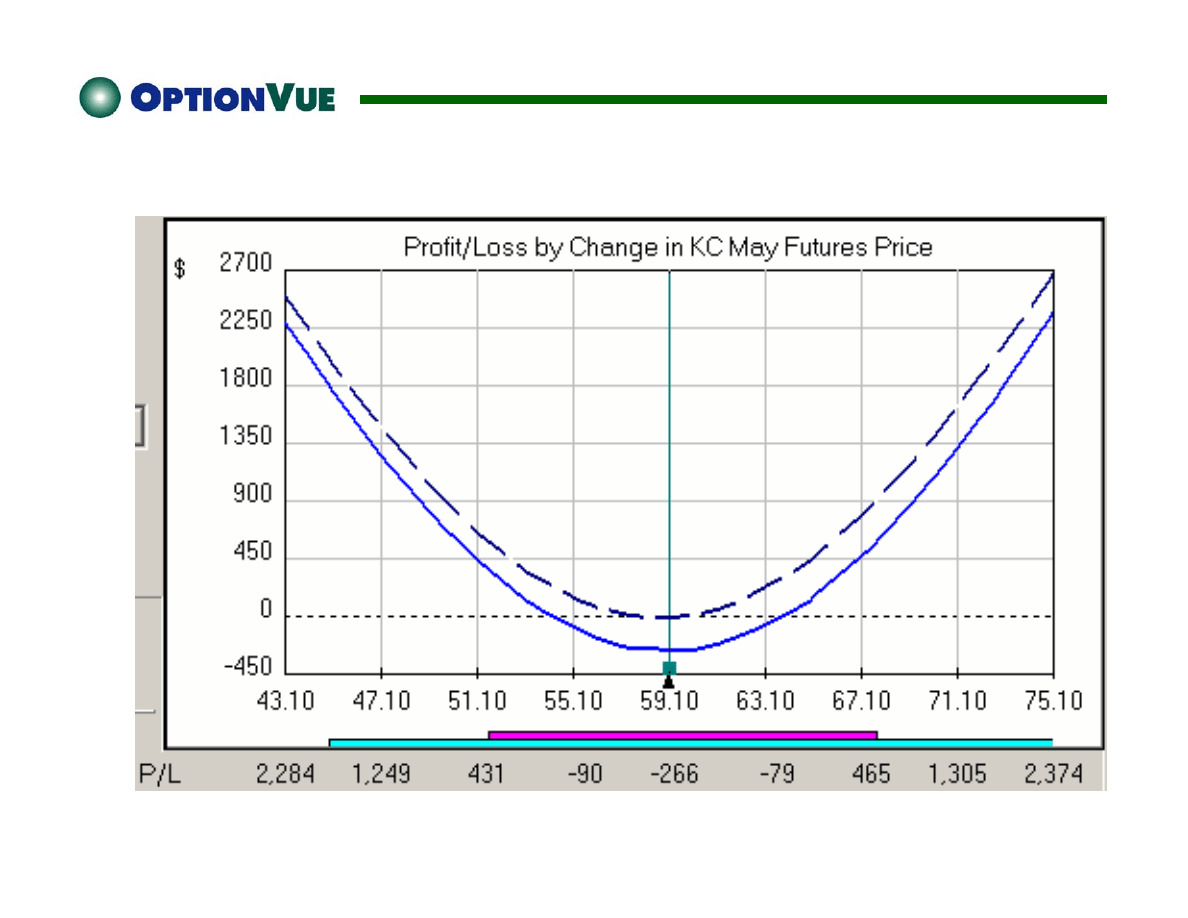
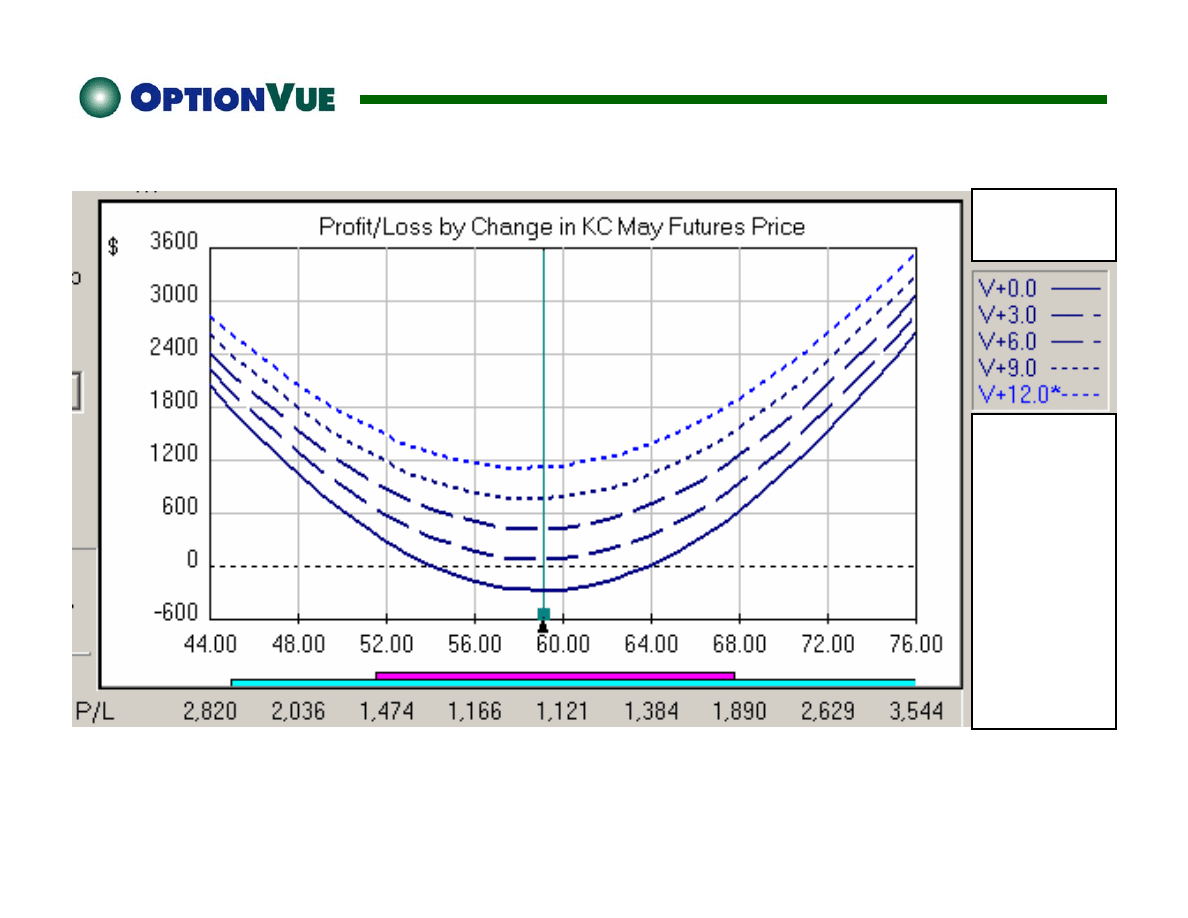
Coffee Straddle -- 30 Days Out – No IV Change

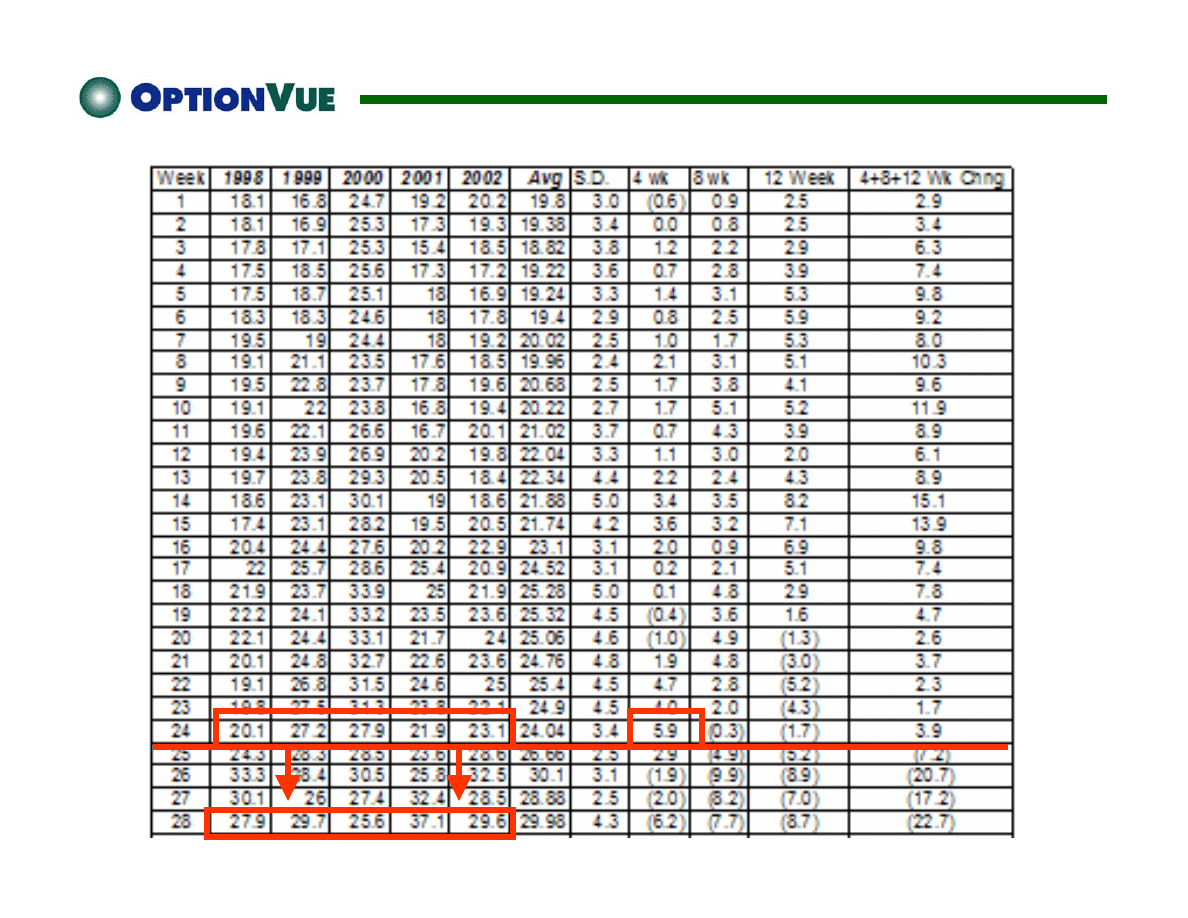
Soybeans
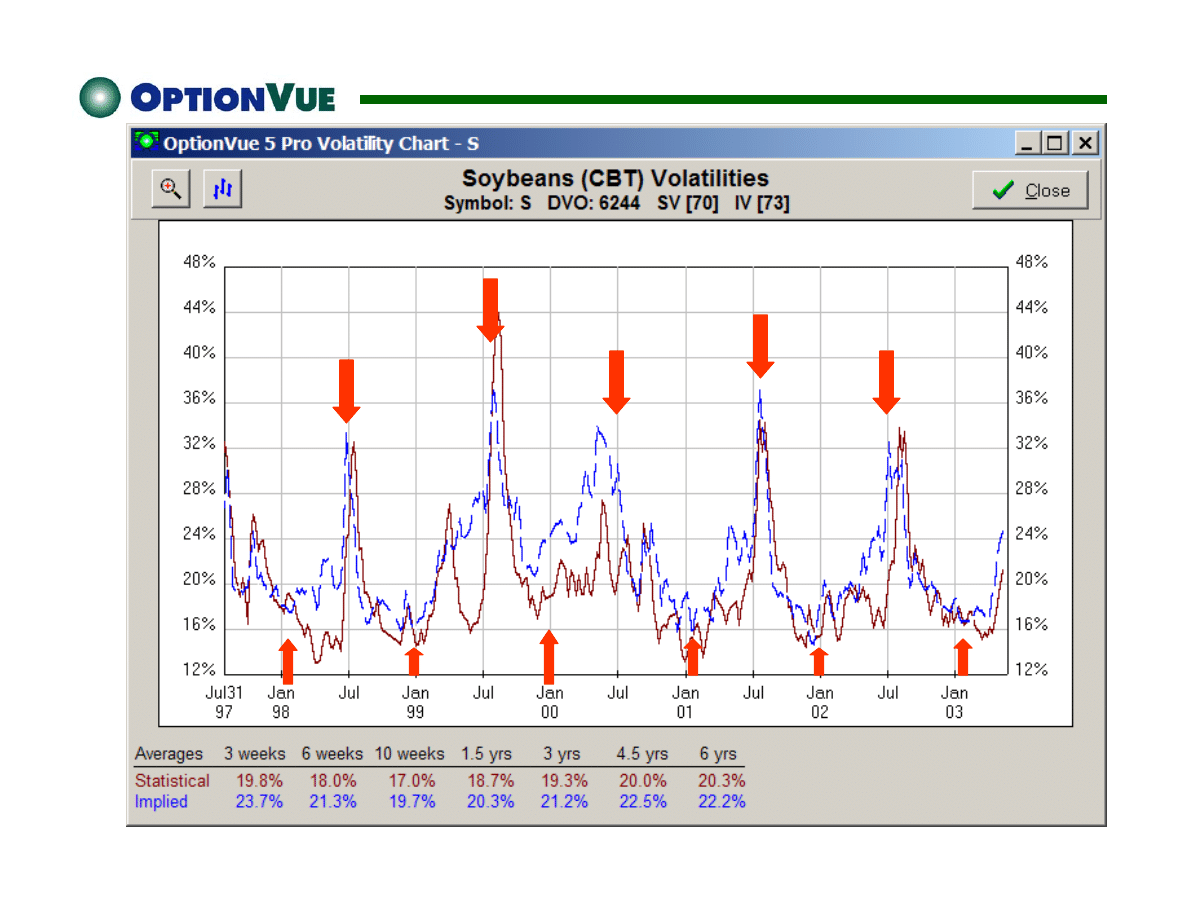
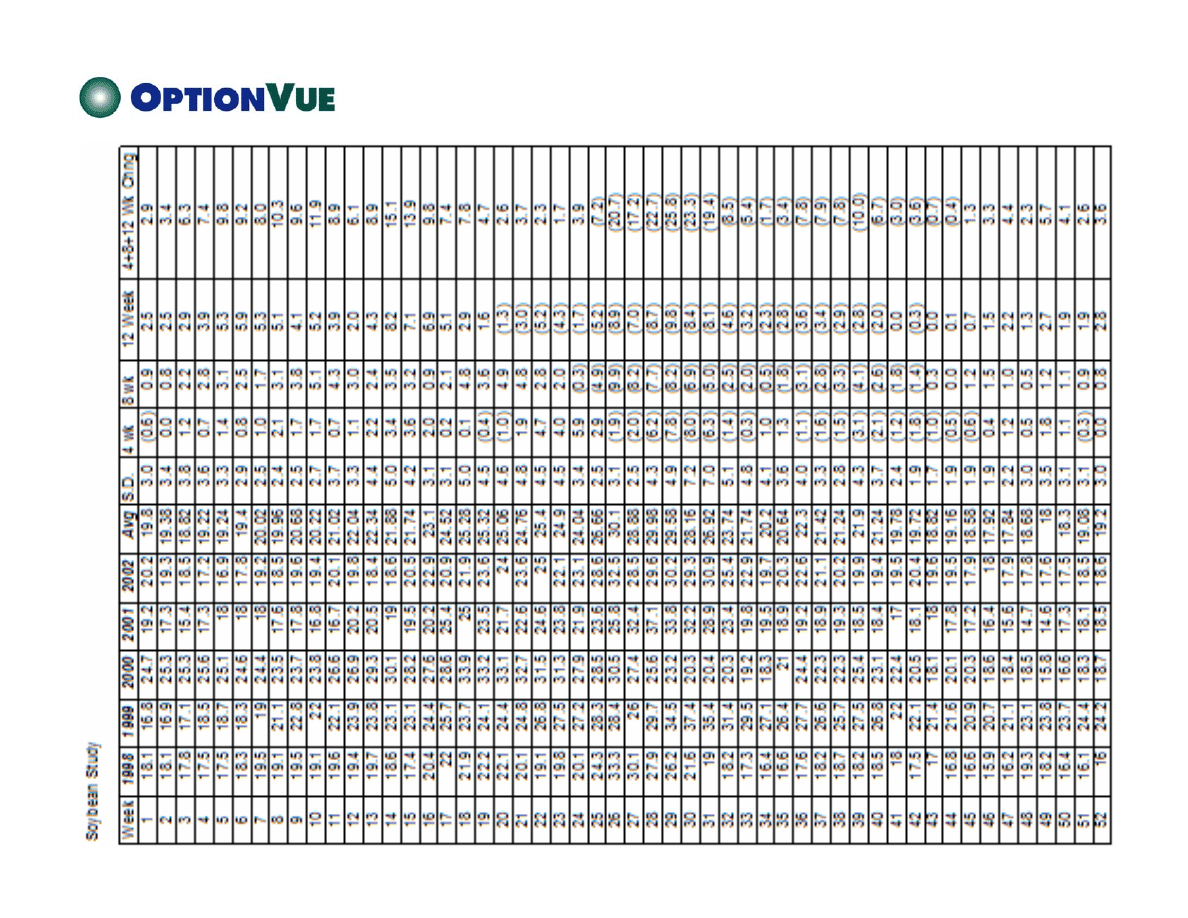
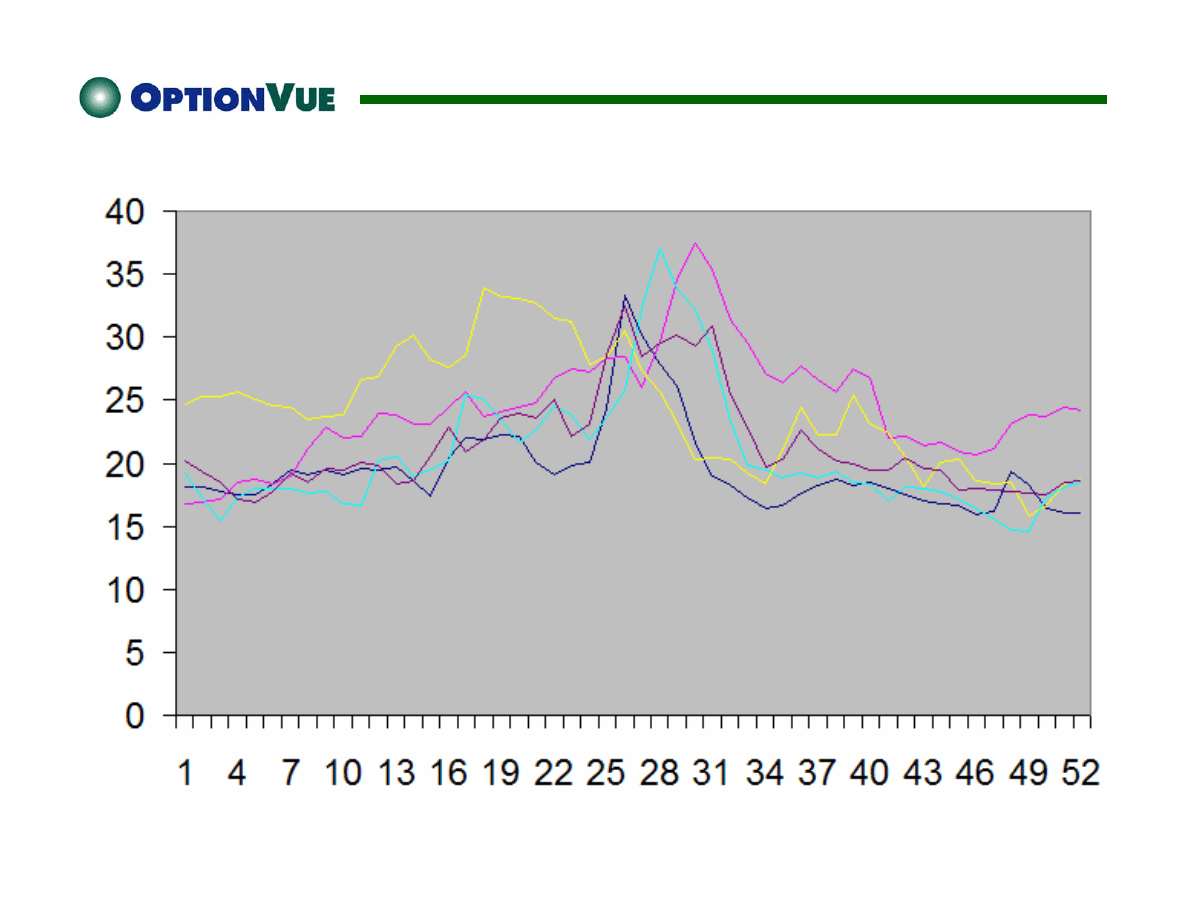
Soybeans IVs by Year
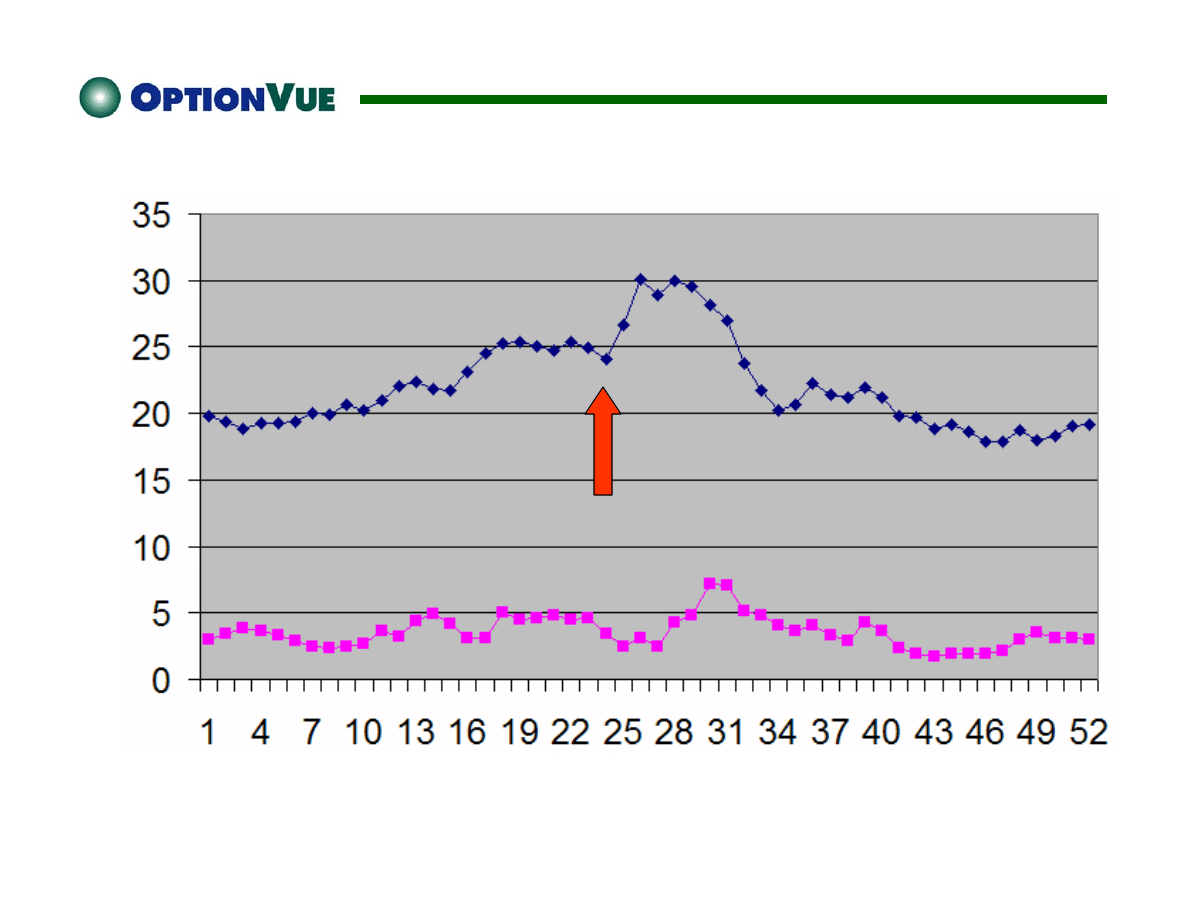
Soybeans Average IVs
Soybeans
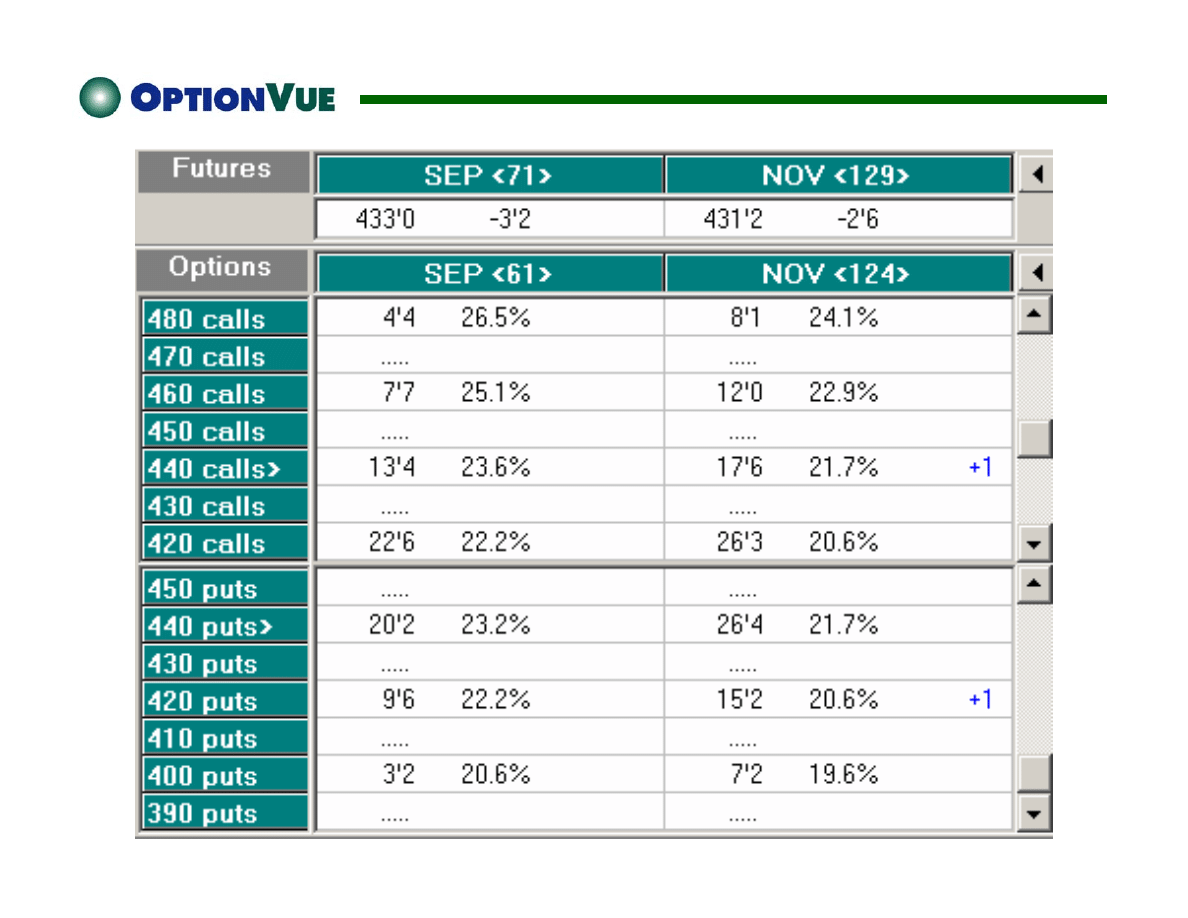
6/25/01
$1650 Requirement
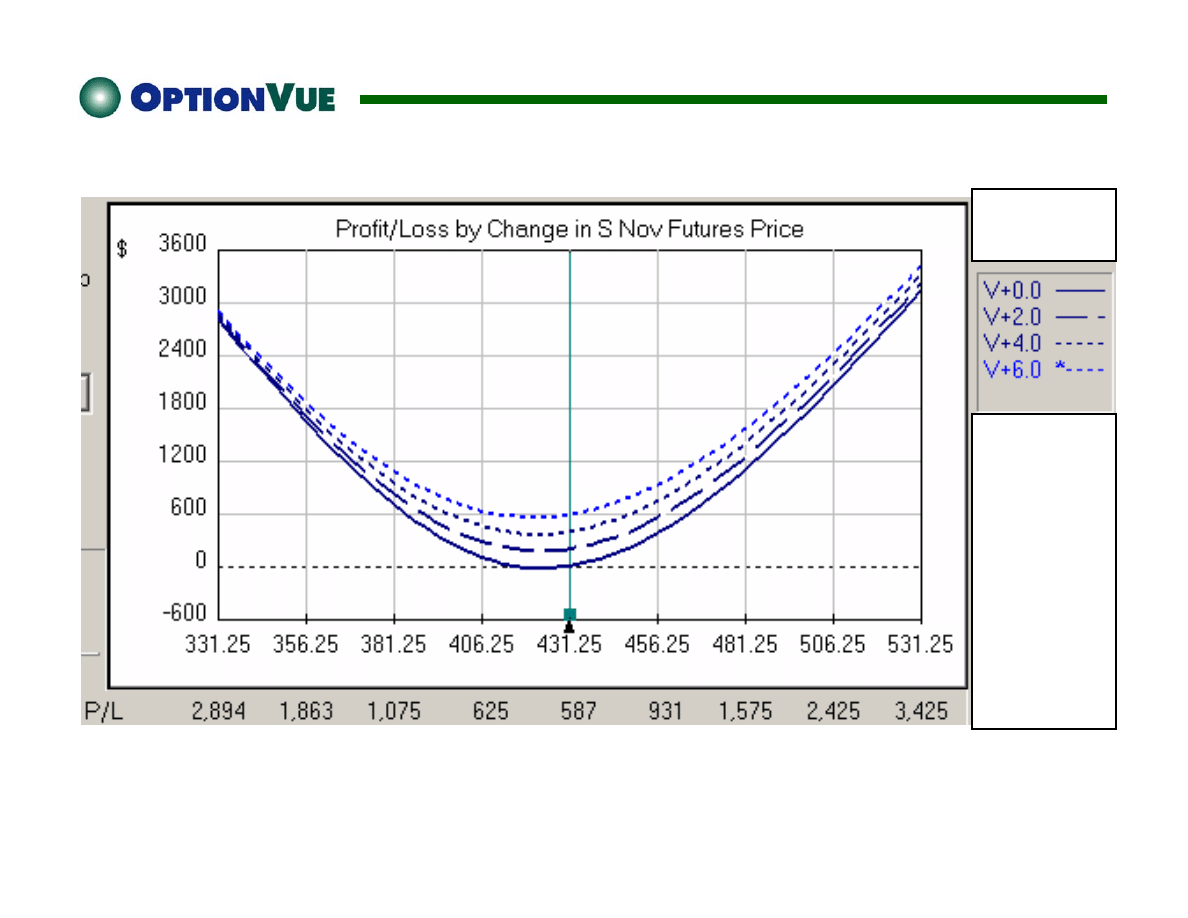
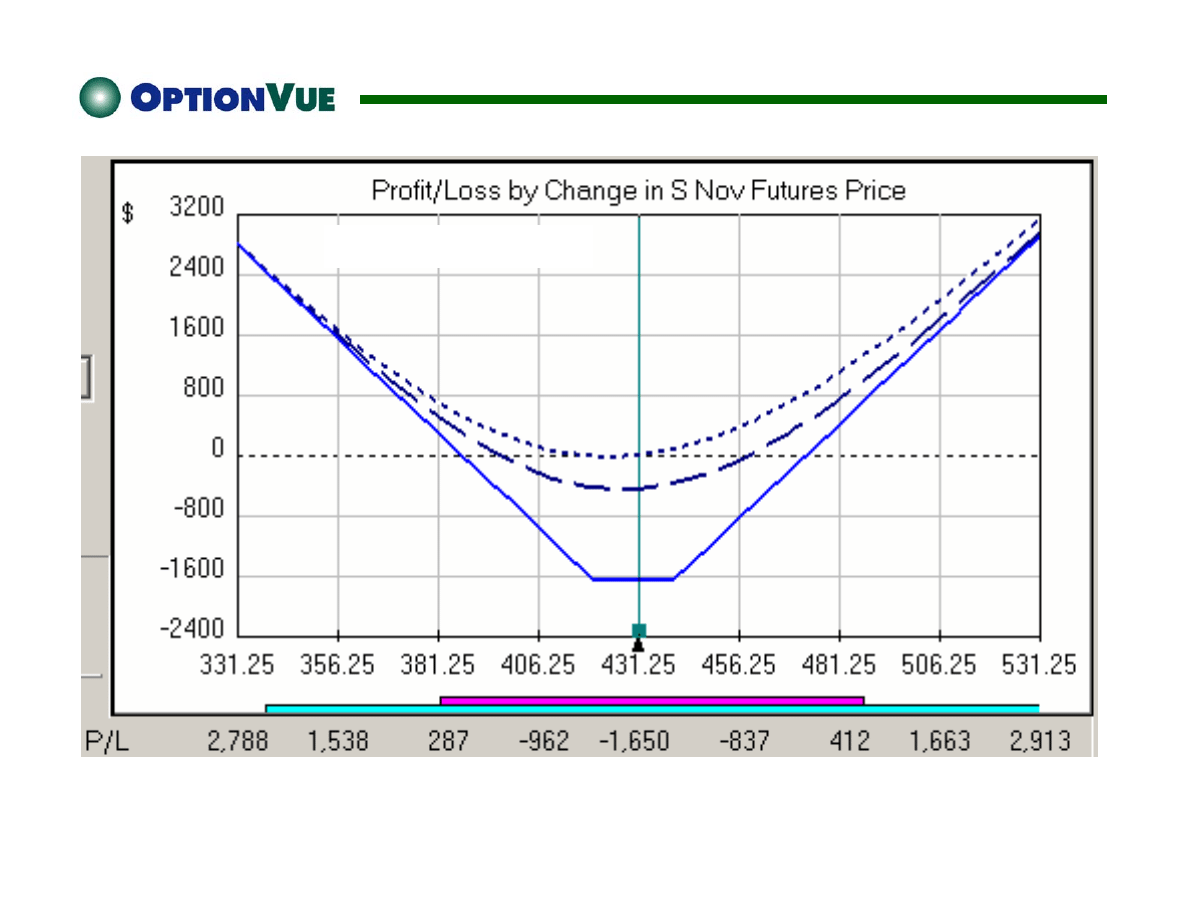
Soybeans Straddle -- 30 Days Out
7/23/01
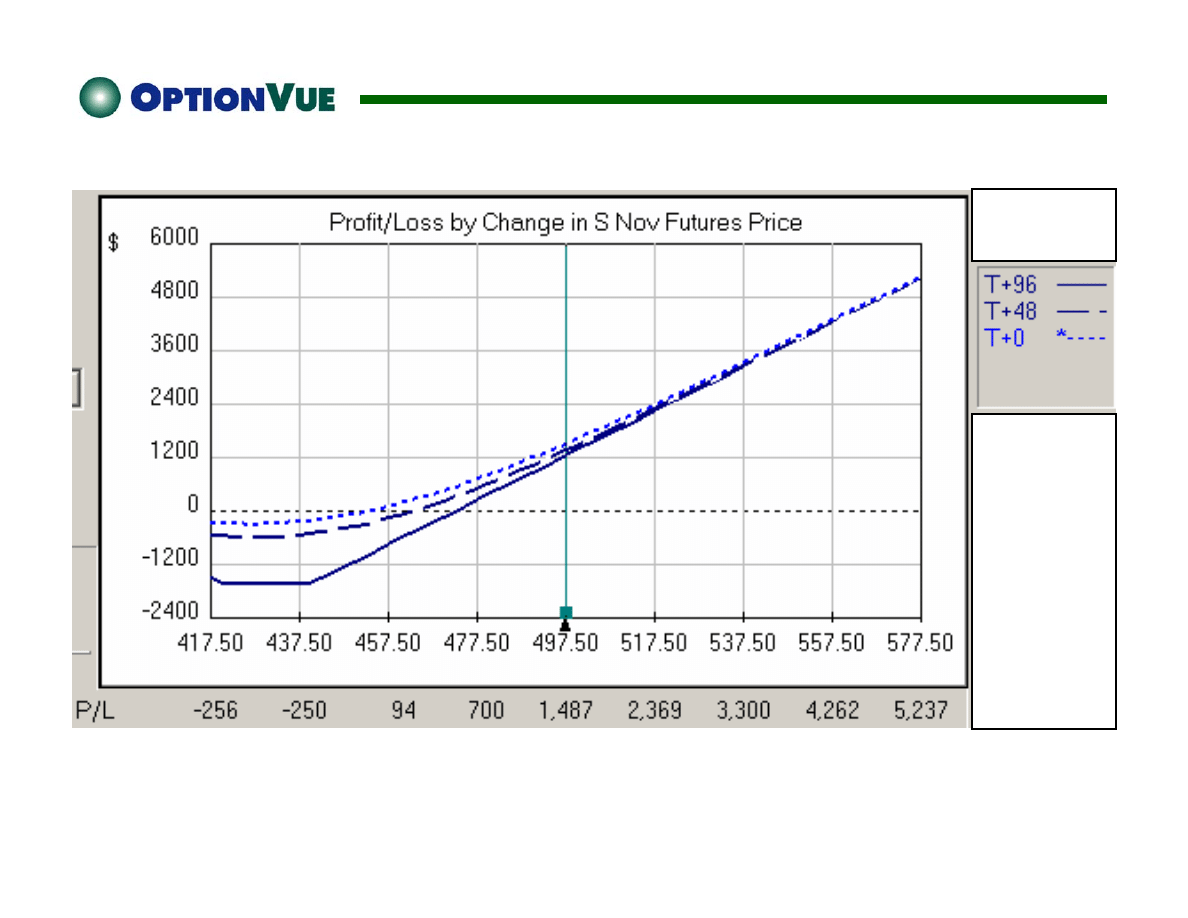
Soybean Straddle -- 30 Days Out
7/23/01
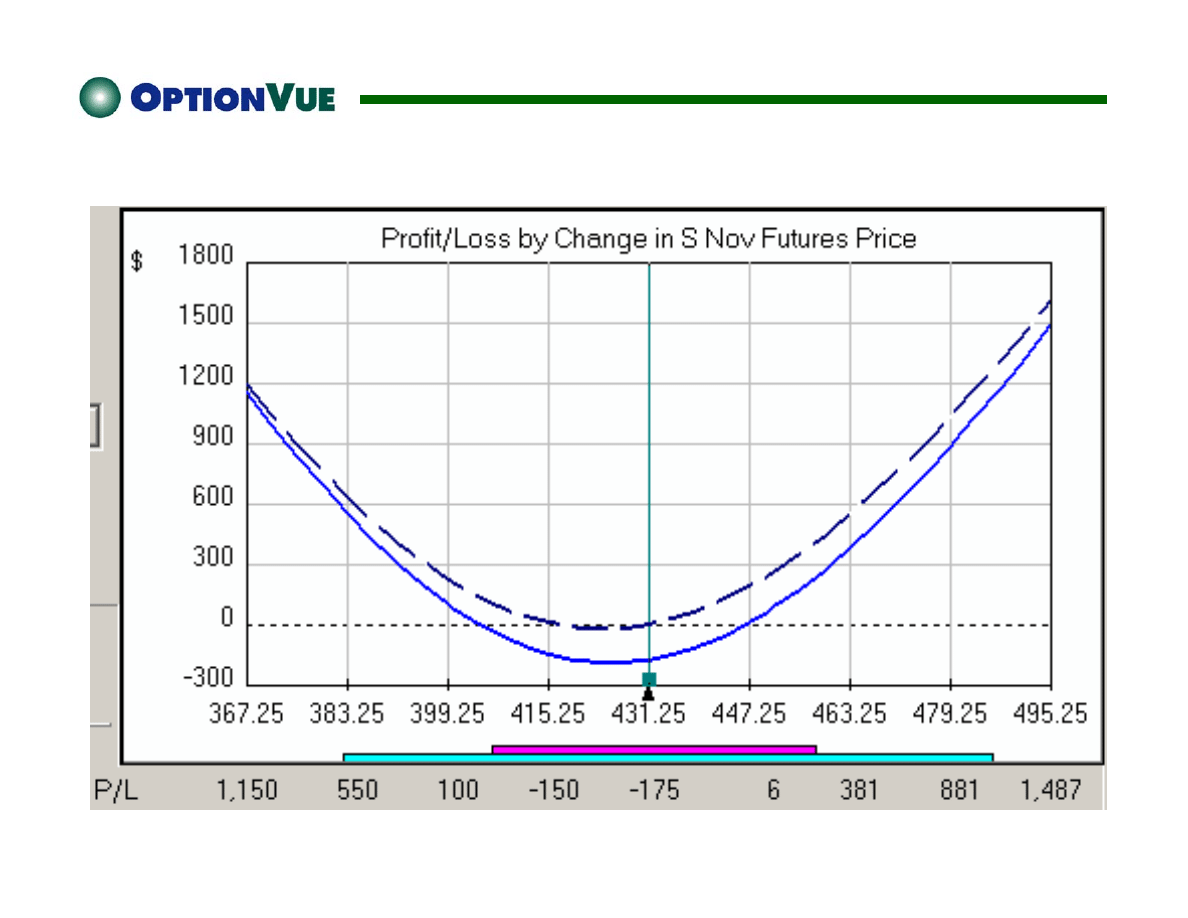
Soybeans Straddle -- 30 Days Out – No IV Change

Natural Gas
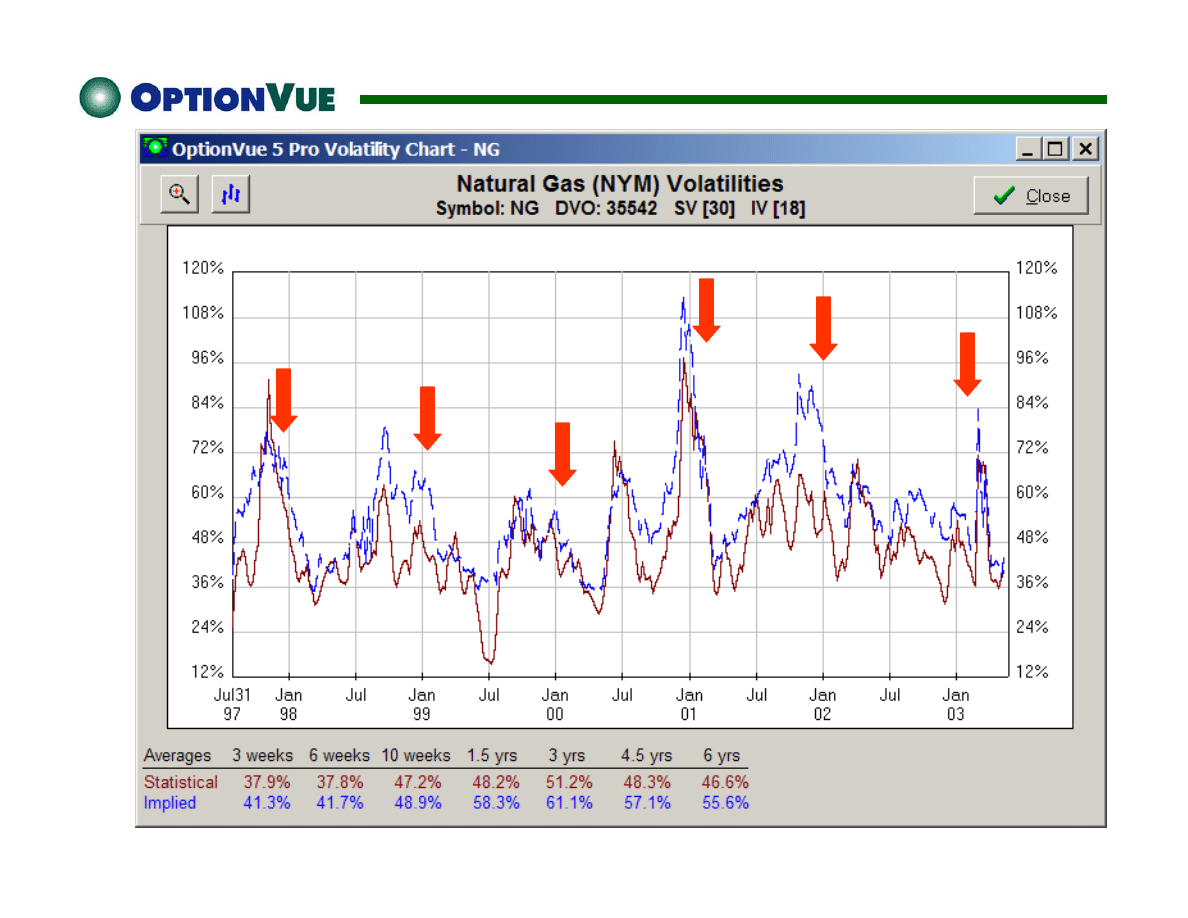
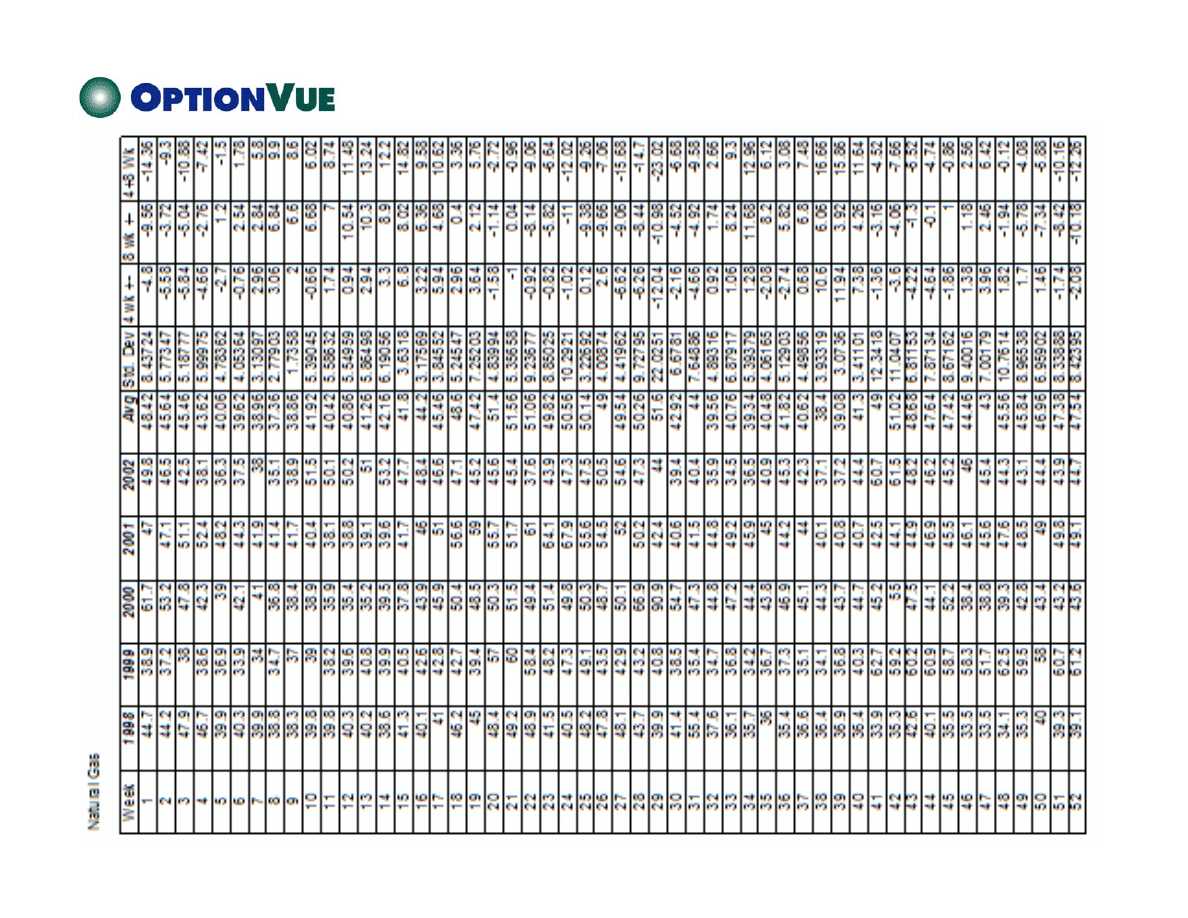
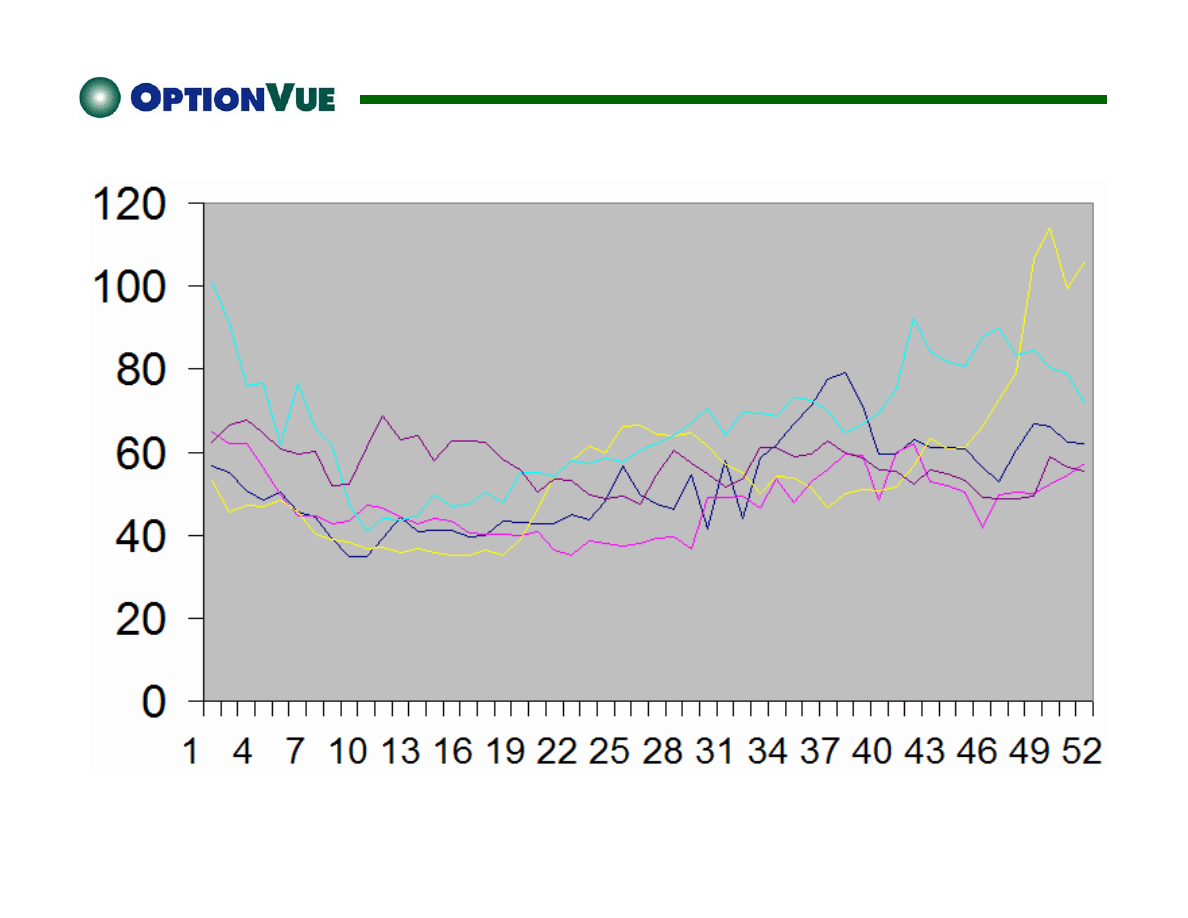
Natural Gas IVs by Year
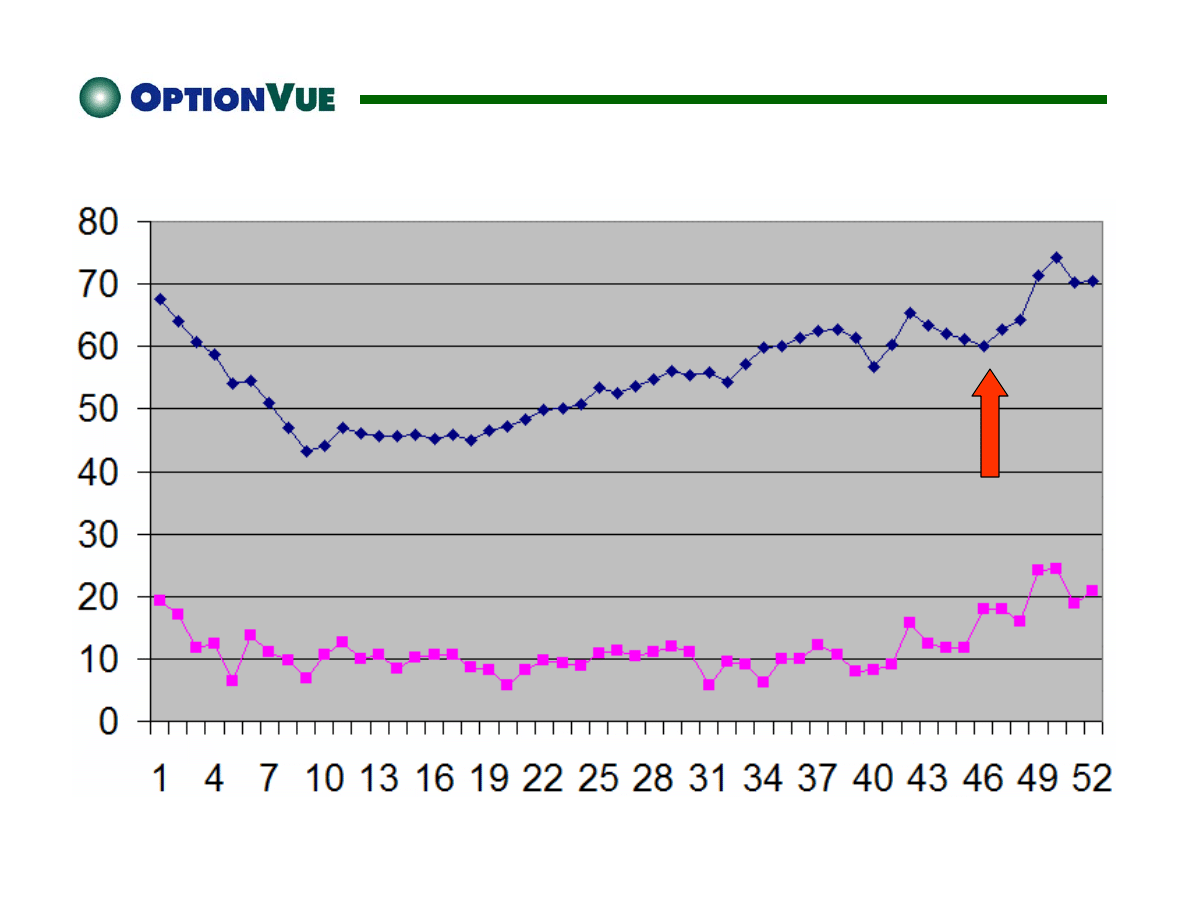
Natural Gas Average IVs
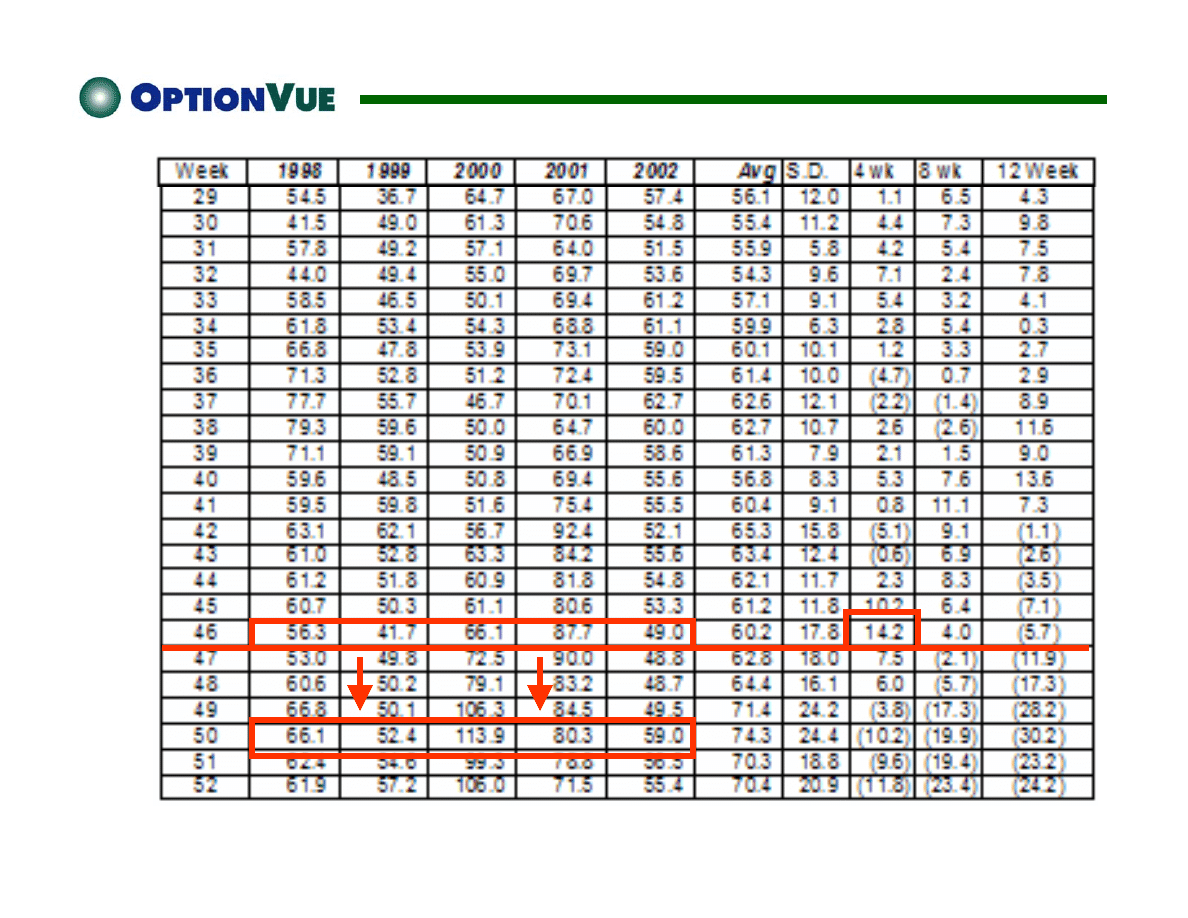
Natural Gas
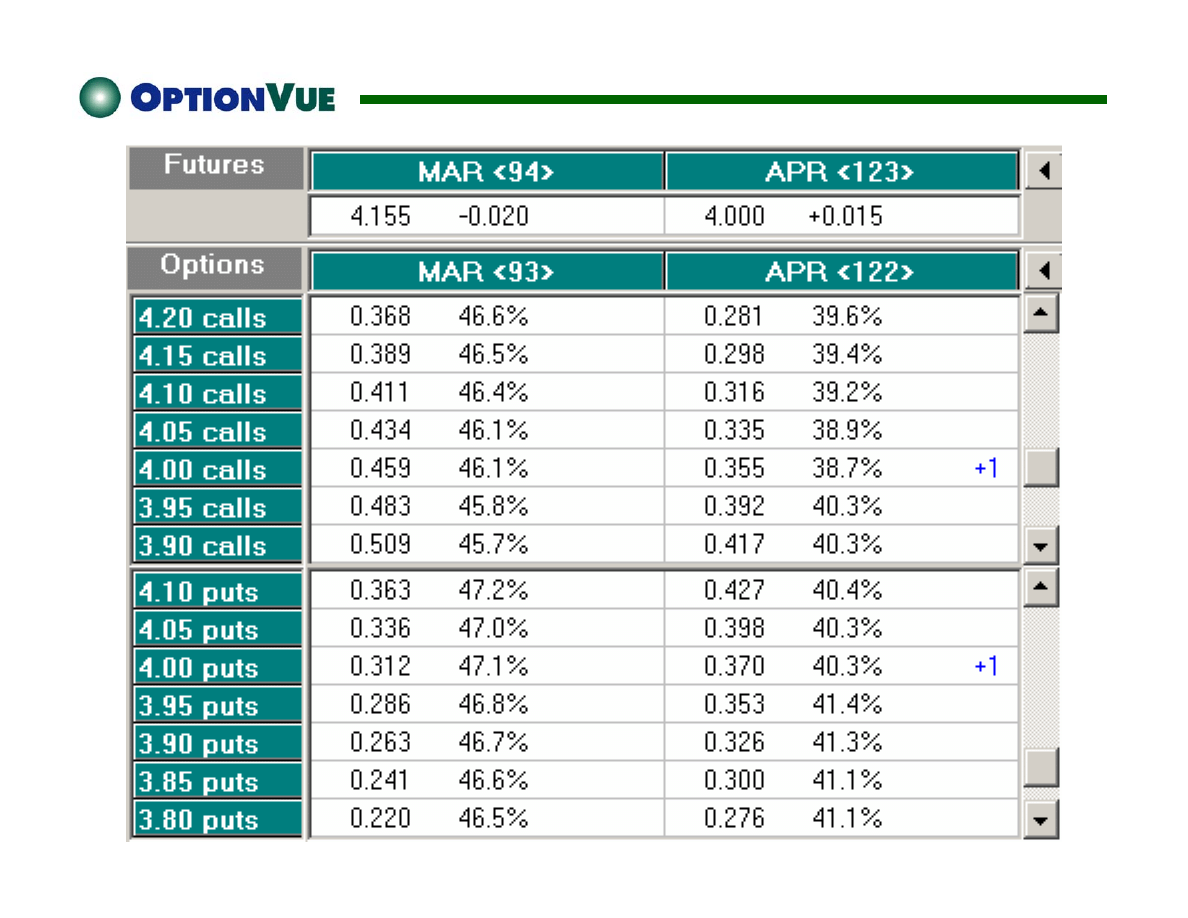
11/25/02
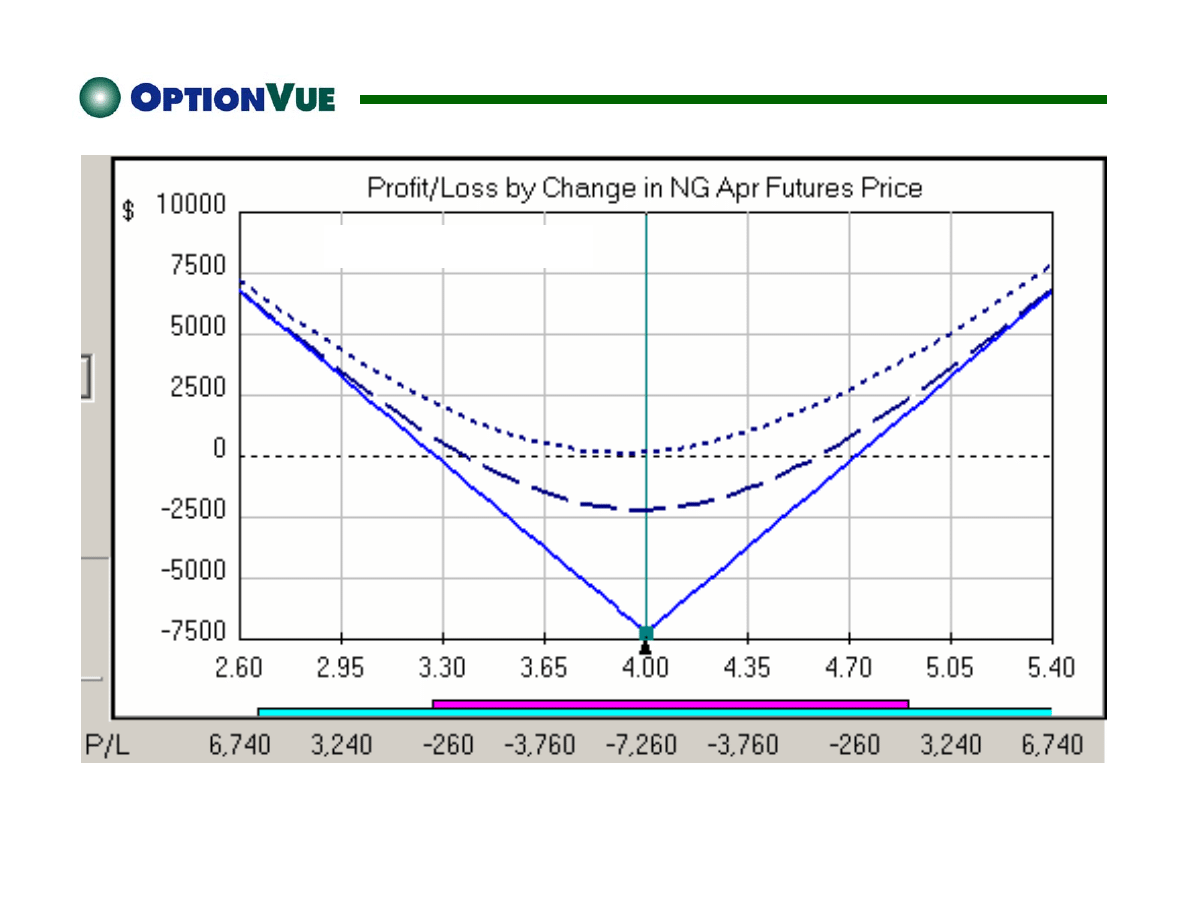
$7260 Requirement
Natural Gas Straddle -- 30 Days Out
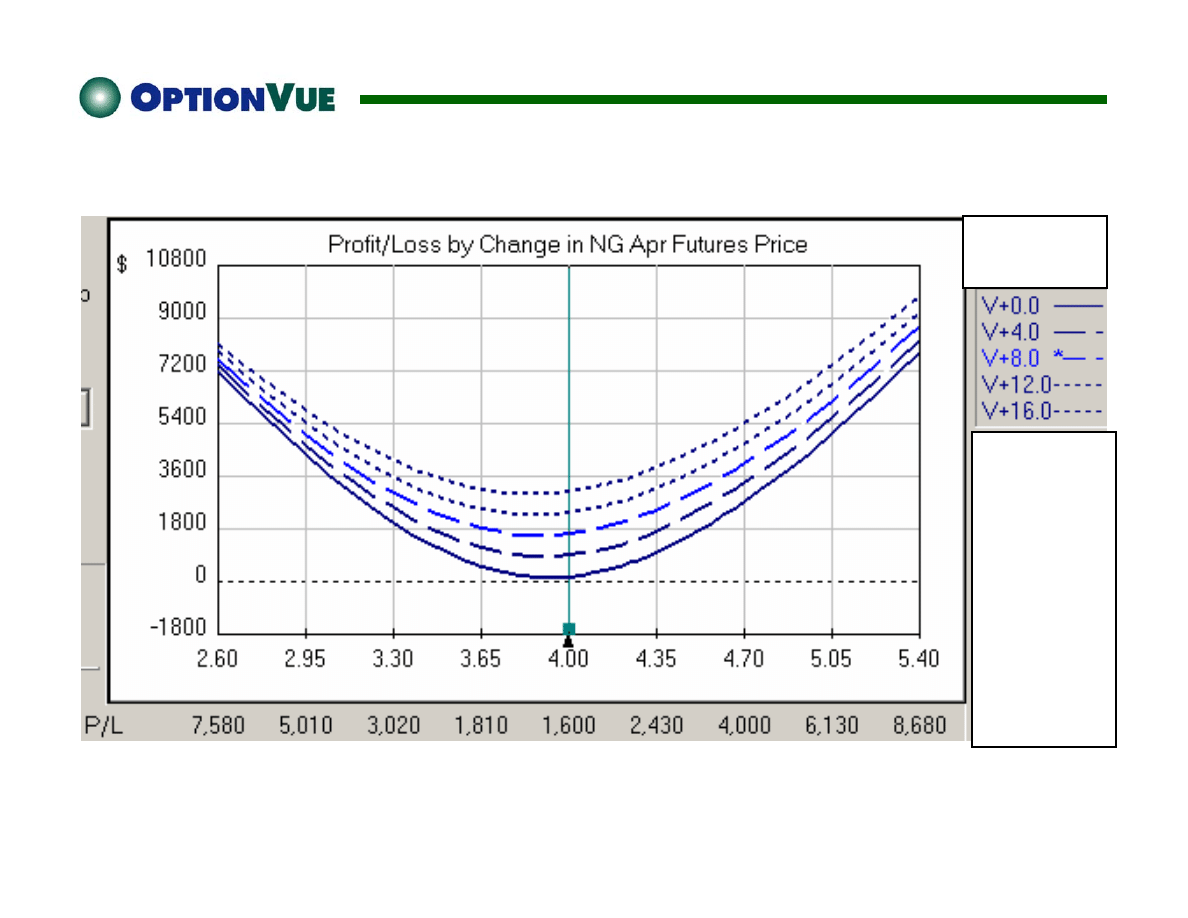
12/23/02
Natural Gas Straddle -- 30 Days Out
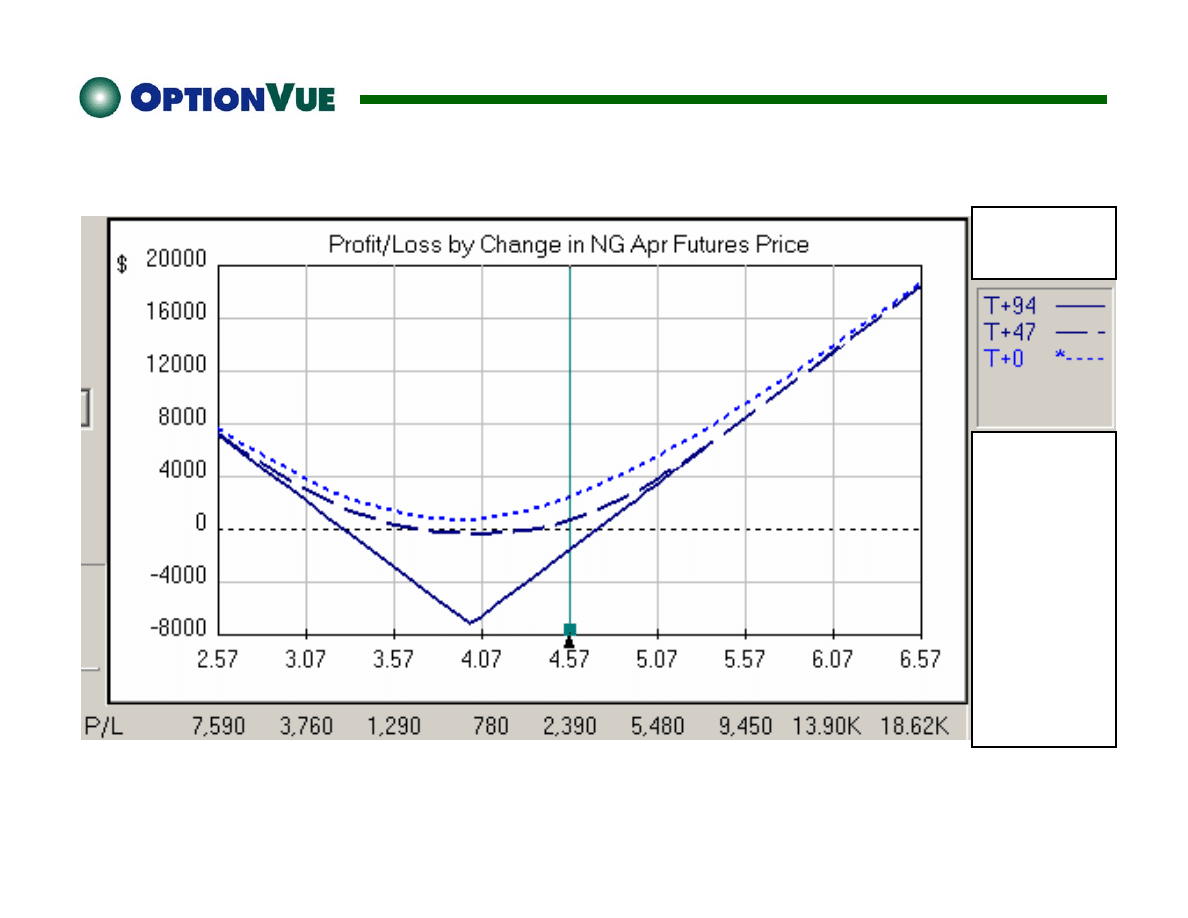
12/23/02
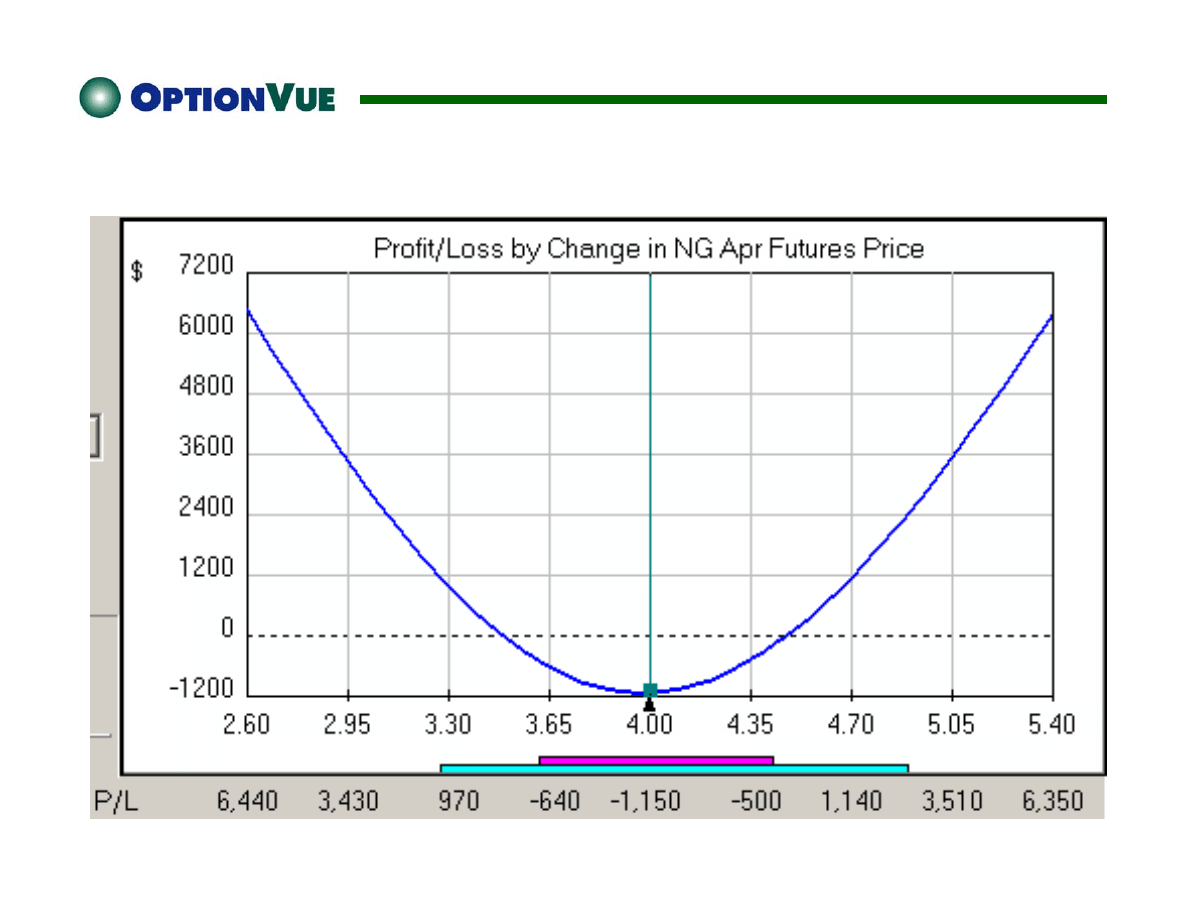
Natural Gas Straddle -- 30 Days Out – IV Drops 7%
High Probability Futures Options
Trading with Seasonal Straddles
Steve Lentz
Director of Education and Research
OptionVue Research, Inc.
Wyszukiwarka
Podobne podstrony:
chlamydiofiloza bo i ov
ov calendar m
ov covered
MBSE, mbse ov
chlamydiofiloza bo i ov
chor grucz mlek u Ov i kóz
jak wgrać soft OV Newbase
s og g ov t ac
Janez Jalen Ovčar Marko
więcej podobnych podstron