
WHY IS CHINA SO COMPETITIVE?
95
© 2006 The Authors
Journal compilation © Blackwell Publishing Ltd. 2006
© 2006 The Authors
Journal compilation © 2006 Blackwell Publishing Ltd, 9600 Garsington Road,
Oxford, OX4 2DQ, UK and 350 Main St, Malden, MA, 02148, USA
95
Why is China so Competitive?
Measuring and Explaining China’s
Competitiveness
F. Gerard Adams
1
, Byron Gangnes
2
and Yochanan Shachmurove
3
1
Northeastern University,
2
University of Hawaii at Manoa and
3
City College of City University of New York/University of Pennsylvania
1. INTRODUCTION
I
N the past decade, the export performance of the Chinese economy has been
phenomenal. The issue of Chinese competitiveness has expanded in scope
from a regional question – ‘Why is China so competitive with respect to other
East Asian exporters?’ – to a worldwide question – ‘Why are Chinese goods so
competitive in the world market?’
Some observers have expressed concern about the growing centralisation of
the world’s manufacturing production in East Asia, and particularly in China. At
issue are the implications for manufacturing employment and wages in the United
States, Europe and Japan, where a large fraction of Chinese exports is directed.
There has also been worry about the deflationary implications of cheap Chinese
exports on the advanced countries. For example, a recent Japanese comment:
A situation, largely without precedent in the industrialization of other nations, is thus unfolding
in China where there has been long-term economic growth without rising wages. Judging from
the large surplus [of] labor in the hinterland, this situation could continue for about another
decade. If so, the deflationary pressure on the global economy from China will continue (Kojima,
2002, p. 22).
In the United States, China’s exchange rate and its implications for (unfair?)
competition have become a political issue as the US trade deficit with China has
risen above $100 billion. In East Asia, China’s competitiveness is being seen as
responsible for shifts in production and foreign investment that have impeded
growth in other countries in the region.
The authors wish to thank Ari Van Assche and Jun Zhang for research help and useful comments.

96
F. G. ADAMS, B. GANGNES AND Y. SHACHMUROVE
© 2006 The Authors
Journal compilation © Blackwell Publishing Ltd. 2006
The present debate over Chinese competitiveness is reminiscent of 1980s
worries about the American competitive losses to Japan. Yet, there are some
important differences. In the 1980s, American concerns were of an increasingly
wealthy Japanese economy that appeared poised to overtake the US as a leader in
key technologies and in overall wealth and prestige (Prestowitz, 1988). In the
current situation, it is instead the multinational corporations of the United States,
Japan and other economies who are shifting their own production into China
either through foreign direct investment or outsourcing. The issues are less about
technological supremacy than they are about the implications for developed-
country economies of a continuing outflow of investment and labour market
displacements from the associated shifts in production and trade.
Our primary concern will be about whether the phenomenon of Chinese com-
petitiveness is primarily one of exchange rate undervaluation – that can presum-
ably be remedied by appreciation of the Chinese exchange rate. Or, alternatively,
does Chinese competitiveness reflect more fundamental changes in the produc-
tion possibilities of a ‘new’ Chinese economy?
This paper considers China’s competitiveness, its definition and measurement.
In the next section we look at China’s success in capturing world export markets.
We then turn to a conceptual discussion of competitiveness and the practical
challenges involved in its measurement. Following sections look at empirical
indicators of Chinese competitiveness. An evaluation section summarises findings
and draws some tentative conclusions.
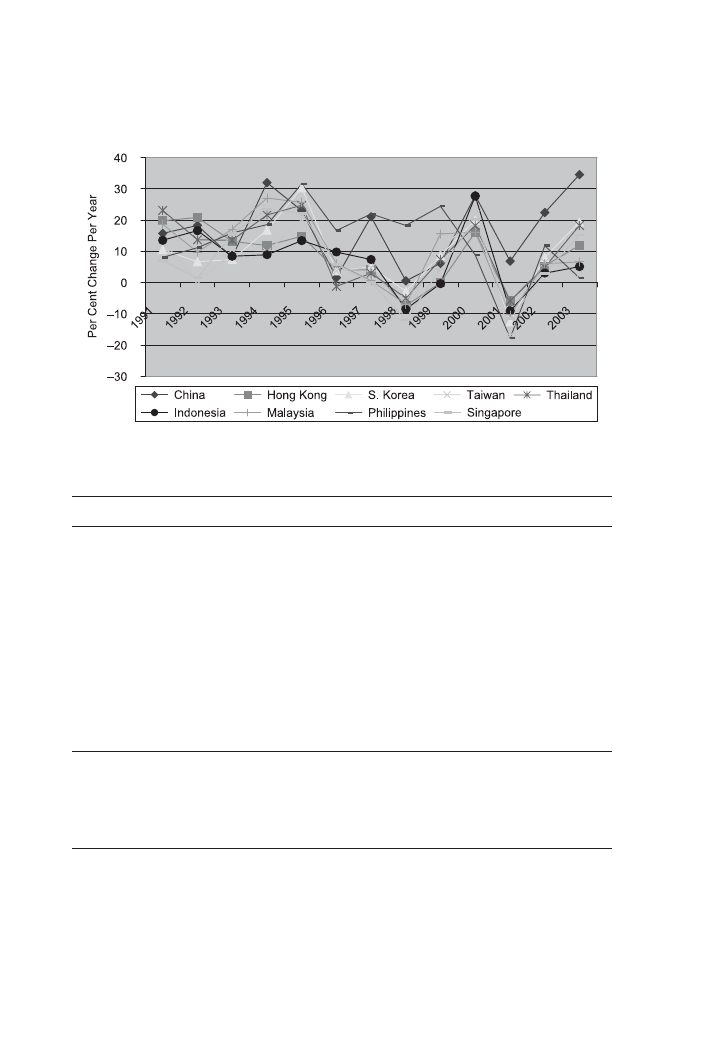
2. CHINESE EXPORT PERFORMANCE
We begin by asking whether China has indeed been successful in its pursuit of
international markets. In recent years, the record of Chinese exports has been
spectacular, though cyclical. Chinese exports have expanded very rapidly, since
1990 at more than twice the rate of growth of world trade (see Figure 1, Tables 1
and 2). Other East Asian countries have also shown rapid export growth but,
despite substantial devaluations, in recent years many have lagged behind China.
As is clearly apparent in Figure 1, in recent years Chinese exports have grown
much more rapidly than other East Asian countries’ exports, by 34.5 per cent in
2003 and, apparently, at a similar rate in the first half of 2004.
An alternative way to evaluate the development of exports is to see them as a
share of world trade (Table 3). The results are striking. China (including Hong
Kong) has shown a steadily increasing share of world exports to 8.9 per cent in
2003.
1
Other East Asian countries show steady increases in their shares of world
1
There is an extensive literature on Chinese trade data (Fernald et al., 1998; and Lardy,
1994). Obviously, as a result of transshipments through Hong Kong some Chinese exports are
WHY IS CHINA SO COMPETITIVE?
97
© 2006 The Authors
Journal compilation © Blackwell Publishing Ltd. 2006
FIGURE 1
Export Growth
double-counted, though Fernald et al. point out that considerable value is added in Hong Kong.
Moreover, the extent of transshipment through Hong Kong has clearly been slipping. Fernald et al.
suggest that taking Chinese and Hong Kong exports together produces numbers that are not far
from those obtained by measuring these exports from the side of imports of the corresponding
importing countries.
TABLE 1
Exports 1970–2002
(Billions of US$)
1970
1980
1990
1995
2000
2003
World
298
1,922
3,378
5,079
6,387
7,453
China
2
18
62
149
249
438
Hong Kong
2
20
82
174
202
224
Memo: China
+ HK
5
38
144
322
451
662
S. Korea
1
17
65
125
172
194
Malaysia
2
11
29
74
98
99
Philippines
1
6
8
17
40
37
Thailand
1
6
23
56
69
81
Singapore
2
19
53
118
138
144
Indonesia
1
25
26
45
62
61
Taiwan
1
20
76
111
147
134
Japan
19
130
288
443
479
472
US
43
226
394
585
781
724
Source: IMF, International Financial Statistics.
trade until 1995 and stable or slightly declining shares thereafter. Japan shows a
growing market share until 1990, but loses share thereafter, presumably to East

98
F. G. ADAMS, B. GANGNES AND Y. SHACHMUROVE
© 2006 The Authors
Journal compilation © Blackwell Publishing Ltd. 2006
TABLE 2
Export Growth 1970–2003
(Per cent change p.a.)
1970–1980
1980–1990
1990–1995
1995–2000
2000–2003
World
18.6
11.3
8.2
4.6
5.1
China
20.6
12.3
17.5
10.1
18.8
Hong Kong
20.7
14.2
15.0
3.0
3.5
Memo: China
+ HK
41.3
26.7
16.1
6.7
12.8
S. Korea
30.8
13.1
13.1
6.4
4.0
Malaysia
18.8
9.7
18.5
5.6
0.4
Philippines
17.4
3.5
15.4
16.4
−2.4
Thailand
22.3
12.7
17.9
4.0
5.3
Singapore
24.9
10.0
16.1
3.0
1.5
Indonesia
31.3
0.2
11.4
6.2
−0.6
Taiwan
26.5
13.5
7.7
5.6
−3.5
Japan
19.1
7.9
8.6
1.6
−0.5
US
16.6
5.6
7.9
5.8
−2.9
Source: IMF, International Financial Statistics.
Asian competition. The United States shows substantial declines in market share
(except in 1995–2000), and, in relative terms, now plays a considerably smaller
role in world export markets than in 1970.
The composition of the exports of China and other East Asian countries (Table 4)
provides some insight into the changing role of China in the world economy. Export
composition reflects the traditional development ladder (Adams and Ichimura, 1998;
and Vernon, 1966) approach, starting with raw materials and foodstuffs in the lowest
income countries, then increasing strongly in the manufactured mass production
TABLE 3
Shares of World Exports
(Per cent)
1970
1980
1990
1995
2000
2003
China
0.8
0.9
1.8
2.9
3.9
5.9
Hong Kong
0.8
1.0
2.4
3.4
3.2
3.0
Memo: China
+ HK
1.6
1.9
4.2
6.3
7.1
8.9
S. Korea
0.3
0.9
1.9
2.5
2.7
2.6
Malaysia
0.6
0.6
0.9
1.5
1.5
1.3
Philippines
0.3
0.3
0.2
0.3
0.6
0.5
Thailand
0.2
0.3
0.7
1.1
1.1
1.1
Singapore
0.5
1.0
1.6
2.3
2.2
1.9
Indonesia
0.4
1.3
0.8
0.9
1.0
0.8
Taiwan
0.5
1.0
2.2
2.2
2.3
1.9
Japan
6.5
6.8
8.5
8.7
7.5
6.3
US
14.3
11.7
11.6
11.5
12.2
9.7
Source: Computed from IMF, International Financial Statistics.

WHY IS CHINA SO COMPETITIVE?
99
© 2006 The Authors
Journal compilation © Blackwell Publishing Ltd. 2006
TABLE 4
Growth of Exports 1995–2001 by Merchandise Class
China
Hong Kong
Indonesia
Korea
Million
Per Cent p.a.
Million
Per Cent p.a.
Million
Per Cent p.a.
Million
Per Cent p.a.
US$
1995–2001
US$
1995–2001
US$
1995–2001
US$
1995–2001
1
Raw food
12,777
4.2
2,304
−2.9
3,252
−1.6
2,204
−3.0
2
Proc. agric. products
5,156
−3.0
3,098
−9.5
4,595
−6.1
1,896
−0.5
3
Fuels
8,405
7.6
495
−20.4
14,274
3.6
8,038
19.6
4
Industrial materials
29,421
5.6
15,724
−2.7
4,630
7.1
22,801
2.9
5
Manufactures, mass production
85,857
6.9
56,566
−0.2
17,164
1.8
22,003
−2.0
6
High-tech & capital goods
122,080
15.0
112,944
4.1
11,070
12.4
93,492
3.9
Total
263,696
9.5
191,131
1.6
54,986
3.2
148,316
3.2
Malaysia
Philippines
Singapore
Thailand
Million
Per Cent p.a.
Million
Per Cent p.a.
Million
Per Cent p.a.
Million
Per Cent p.a.
US$
1995–2001
US$
1995–2001
US$
1995–2001
US$
1995–2001
1
Raw food
1,734
−0.6
1,302
−0.4
1,547
−49.3
9,712
−0.7
2
Processed agric. products
5,571
−9.6
889
−7.8
2,093
−10.0
2,670
−4.0
3
Fuels
8,557
8.4
272
−0.2
9,243
2.2
1,814
24.8
4
Industrial materials
6,124
6.1
852
−0.9
12,296
1.8
5,757
8.2
5
Manufactures, mass production
7,663
−0.6
3,839
9.2
4,082
−4.6
11,555
−3.0
6
High-tech & capital goods
58,355
4.5
24,995
13.2
91,919
0.9
33,606
5.3
Total
88,004
2.9
32,150
10.2
121,179
−3.0
62,204
2.8
Source: United Nations Comtrade.

100
F. G. ADAMS, B. GANGNES AND Y. SHACHMUROVE
© 2006 The Authors
Journal compilation © Blackwell Publishing Ltd. 2006
2
Comparable statistics were not available for Taiwan.
3
For example, the three-digit category 776 (Transistors and valves) accounts for only $4.9 billion,
though it too is growing rapidly at 22.3 per cent per year.
4
Among recent articles that have documented China’s export gains in capital-intensive and high-
tech export markets are Wong and Chan (2002), Chen (2001) and Voon and Yue (2003).
products and finally turning to high-tech and capital goods as the economy’s
productive power matures. Among the East Asian countries, China is the region’s
dominant exporter. (China alone accounts for one-third of the region’s exports,
over half if China and Hong Kong are combined.) China’s exports of manufac-
tured mass production products continue to increase rapidly: 6.9 per cent per year
in line with world market growth, more than in other East Asian countries.
High-technology exports were increasing at a rate of 15 per cent per year and
already represented a 43 per cent (China and Hong Kong) share of 2001
East Asian high-tech exports even though China was not yet as technologically
advanced as Korea or Singapore.
2
Since 2001 these patterns have continued.
A more detailed look is obtained by selecting sectors that can be called high-
tech and low-tech at the ‘two-digit’ SITC level (Table 5). High-tech exports from
China like office machines, telecom, electrical machinery and parts have been
growing much more rapidly than traditional Chinese export products like cloth-
ing and footwear, though the latter remain quantitatively important. Hong Kong
and Korea also show very rapid growth for telecom and Malaysia and Singapore
for ADP. The growing high-tech categories in China include a disproportionate
share of assembly and of relatively simple products, such as PCs and cell phones
as well as parts, rather than highly sophisticated complex capital goods and
chips.
3
Some of these exports represent a shift of production from neighbouring
countries, especially Taiwan and South Korea where costs have been rising.
Growth in the traditional sectors is generally more modest, though China shows
rapid growth in the clothing category.
It is not possible statistically to measure the qualitative improvements that have
increased the competitiveness of Chinese products. But, changes in the range of
products being produced are suggestive of the developments that are taking place.
4
To summarise, in comparison with other East Asian countries, China has become
the dominant exporter and is increasingly shifting into higher-tech sectors. It is
important to note, however, that the high-tech categories contain not only advanced
technology but also simpler assembly activities required to build high-tech products
like telephones and PCs, an important part of Chinese export production.
3. COMPARATIVE ADVANTAGE AND INTERNATIONAL COMPETITIVENESS
The explanation of international competitiveness by economists goes back
many years to the theory of comparative advantage and factor pricing (Ricardo

WHY IS CHINA SO COMPETITIVE?
101
© 2006 The Authors
Journal compilation © Blackwell Publishing Ltd. 2006
TABLE 5
Growth of Exports 1995–2001, Selected Sectors
China
Hong Kong
Indonesia
Korea
Million
Per Cent p.a.
Million
Per Cent p.a.
Million
Per Cent p.a.
Million
Per Cent p.a.
US$
1995–2001
US$
1995–2001
US$
1995–2001
US$
1995–2001
High-tech Sectors
SITC 75 Office machines, ADP
23,572
26.5
17,747
10.0
2,063
23.6
28,534
−4.5
SITC 76 Telecom
16,770
14.1
7,041
46.1
27,230
−1.0
13,499
16.7
SITC 77 Elec. machinery, parts
23,759
17.3
18,697
1.8
3,354
12.0
24,187
−2.6
Low-tech Sectors
SITC 83 Travel goods, handbags
12,170
−0.2
1,140
5.8
7,260
−9.7
15,944
9.8
SITC 84 Clothing and accessories
25,998
16.7
30,655
7.5
2,280
17.3
60,430
−3.4
SITC 85 Footwear
20,937
4.2
14,385
30.5
34,717
5.1
21,406
−4.8
SITC 89 Misc. manufactures
4,378
−0.9
187
12.0
34
−2.1
19
−13.4
Malaysia
Philippines
Singapore
Thailand
Million
Per Cent p.a.
Million
Per Cent p.a.
Million
Per Cent p.a.
Million
Per Cent p.a.
US$
1995–2001
US$
1995–2001
US$
1995–2001
US$
1995–2001
High-tech Sectors
SITC 75 Office machines, ADP
270
14.9
38
−8.0
233
−17.9
441
−0.4
SITC 76 Telecom
36,743
7.0
23,551
1.6
4,599
4.8
484
−2.1
SITC 77 Elec. machinery, parts
2,071
−1.5
2,423
13.3
1,632
1.8
4,320
−2.4
Low-tech Sectors
SITC 83 Travel goods, handbags
9,676
7.2
5,575
−4.7
1,474
−5.1
29
−16.7
SITC 84 Clothing and accessories
84
−4.1
72
−12.6
112
−1.7
352
−21.1
SITC 85 Footwear
22,085
7.9
22,350
1.0
1,181
0.7
9,724
−0.8
SITC 89 Misc. manufactures
2,014
1.1
514
−0.8
4,552
4.4
4,034
−0.3

102
F. G. ADAMS, B. GANGNES AND Y. SHACHMUROVE
© 2006 The Authors
Journal compilation © Blackwell Publishing Ltd. 2006
and Heckscher-Ohlin). While Ricardo focused on one production factor and
differences in technology (climate), Heckscher and Ohlin dealt with labour and
capital inputs and justified comparative advantage on the basis of underlying
differences in factor endowments and relative factor prices. This approach has
been extended to many products and many factors (Dornbusch, Fisher and
Samuelson, 1977). In the modern theory of trade under imperfect competition,
factor-based comparative advantage continues to play a central role in explaining
trade patterns, although scale economies and strategic motives are also important
(Helpman and Krugman, 1985). Ronald Jones (2000) has also noted that absolute
advantages may influence patterns of specialisation if some inputs to production
are mobile across borders, as are capital, management and technology in today’s
globalised economy.
Comparative advantage with factor pricing may lie at the heart of the theory
of specialisation and trade, but it is not always closely related to real-world
discussions of competitiveness. Comparative advantage is a microeconomic
concept, focusing on industry-specific trade, explaining why one country might
export labour-intensive products while another country might specialise in
capital-intensive ones. By definition, each country has a comparative advantage
in the production of some products – those for which it has a lower relative
(opportunity) cost than its competitors. Comparative advantage has little signific-
ance from a macroeconomic perspective. It is not meaningful to say that at any
time country A in the aggregate has a comparative advantage over country B.
Factor-based comparative advantage is an equilibrium concept, predicting a
pattern of trade when prices, trade flows and exchange rates are in equilibrium.
Business decisions, in contrast, often must explicitly consider short-term situa-
tions as well as long-term equilibrium outcomes. These will include current
economic conditions, exchange rates and other factors that may represent
deviations from long-run equilibrium, sometimes for fairly long periods of
time.
Finally, factor-based comparative advantage does not take explicitly into
account the technological options available to the producers. At the microeconomic
level, when dealing with specific products, it is not always clear from theory
alone which country has the most favourable mix of resources and factor prices
for various types of production. Depending on technology and infrastructure, a
shortage of labour relative to capital which implies relatively high wage rates
may be offset by differences in technology. High wages may or may not translate
into competitive disadvantage for labour-intensive products if alternative tech-
nologies using less labour and more capital are available. For example, many
products that are produced by hand in China are also produced, by machine, in
the United States.
Competitiveness is a term used widely in the business administration literature
(Porter, 1990), for example:

WHY IS CHINA SO COMPETITIVE?
103
© 2006 The Authors
Journal compilation © Blackwell Publishing Ltd. 2006
. . . upgrading an economy is the result of broadening and upgrading the competitive advantages
of a nation’s firms: the attainment of wider . . . patterns of competitive advantage challenge any
simple notions of comparative advantage (Porter, 1996, p. 278).
By competitiveness is meant the ability, under present conditions, of a country’s
producers to command world markets.
In contrast to the comparative advantage approach, it is appropriate to talk
meaningfully about international competitiveness both on the macro and micro
levels. International competitiveness is a matter first of costs: which country is
able to deliver the product to the market most cheaply. Contributing to costs are
factors that directly affect prices, such as exchange rates, domestic wages and
material costs, and productivity. Capabilities to produce goods of appropriate
quality and meeting world market specifications are particularly important. Trans-
portation and communication costs, and trade barriers and trade strategy may
all play a role. Competitiveness is not an equilibrium concept. It represents a
position at a point in time or its change over time. Since adjustment on the
product supply side is likely to be very slow – it takes many years to acquire
technical competence, to establish production facilities and to develop export
markets – competitiveness typically refers to a time of disequilibrium when a
country can increase its share of export markets. In other words, competitiveness
often refers to dynamic rather than static perspectives.
Common usage of the term, competitiveness, is usually broader than would
be implied by a formal definition. In particular, advocates for competitiveness
often stress the role of sustained productivity growth in producing products that
meet the test of international markets
5
(Porter, 1990; and Competitiveness Policy
Council, 1992). Policy may also play an important role in promoting inter-
national competitiveness, both from a static and dynamic perspective. It is in this
context that the term has been embraced by politicians to represent the failures or
successes of Western economies.
In contrast to comparative advantage, it is appropriate to talk meaningfully
about international competitiveness both on the macro and micro levels. At the
macro level, a country’s exports may be highly competitive in the destination
countries or in comparison with products originating in other countries. That
may reflect underlying factor cost and productivity considerations. It may also
reflect the current exchange rate, undervaluation or overvaluation, in addition to
5
Paul Krugman (1994) criticises the tendency to characterise competitiveness by imagining a
nation ‘like a big corporation, competing in the world market place’, a saying attributed to Presid-
ent Clinton. He argues that competitiveness is ‘a dangerous obsession’ since it may lead to policy
choices that are not clearly in the national interest – for example, protectionism when foreign goods
‘threaten’ local producers. He prefers an approach that looks only at productivity growth as a
measure of national performance, but this ignores the key role that international trade (and com-
petition) may play in driving productivity differences (see Cohen, 1994).

104
F. G. ADAMS, B. GANGNES AND Y. SHACHMUROVE
© 2006 The Authors
Journal compilation © Blackwell Publishing Ltd. 2006
tariffs, transportation costs and trade restrictions as well as product quality and
specifications. It does make sense to think of a country’s aggregate competitive-
ness and about policies intended to advance its competitiveness. Competitiveness
has dynamic attributes in the sense that, given resource environment, countries
may become more competitive as a result of learning-by-doing, assimilation
of technology, capital accumulation, increasing scale of production, and policy
intervention.
From a micro perspective as well, it is possible to ask whether certain indus-
tries are competitive in world markets. This calls for a comparison of costs in
the competing countries, at a prevailing exchange rate, involving such factors as
wages and capital costs, scale of production and, of course, technology. As we
have noted in the discussion of comparative advantage, some industries will
be more suited to an economy’s endowment of factors and skills than others.
But whether an industry’s products compete successfully in world markets also
depends on considerations related to management ability and strategy. Dynamic
improvement in competitiveness meaning that the competitiveness of currently
exporting industries improves or that new products, perhaps technologically more
advanced ones, become competitive is possible even when the underlying
resources and comparative advantage in production show little change.
The issue of Chinese trade is today much more an issue of competitiveness
than of comparative advantage. Of course, China’s abundant labour supply repre-
sents an example of comparative advantage relative to the old industrial coun-
tries, par excellence. But China has had such a labour resource endowment for
generations and we must seek another explanation for China’s current export
competitiveness.
4. MEASUREMENT OF COMPETITIVENESS
The measurement of international competitiveness may be approached from a
‘results’ or from a ‘causes’ perspective. Results are basically export performance
and the trade balance. These are ex post concepts and do not ask ‘why’, though
there is often an implied explanation. Growth of exports, particularly growth that
is more rapid than in other countries, implies competitiveness. A positive trade
balance is also frequently cited as a positive measure of competitiveness.
Presumably, competitiveness reflects relative costs, but it may also be affected
by product attributes and trade restrictions. This may lead to confusion. The
ability to command world markets does not necessarily imply higher living
standards.
A classical results measure, focused on particular industries, was Balassa’s
‘revealed comparative advantage’ (RCA) (Balassa, 1965), the share of a country’s
exports of a specific product category (X
ij
) to its total exports (
Σ
i
X
ij
) as compared

WHY IS CHINA SO COMPETITIVE?
105
© 2006 The Authors
Journal compilation © Blackwell Publishing Ltd. 2006
to the share of total world exports of the specific category (
Σ
j
X
ij
) in world exports
of all goods (
Σ
i
Σ
j
X
ij
),
RCA
ij
= X
ij
/(
Σ
i
X
ij
)/(
Σ
j
X
ij
)/(
Σ
i
Σ
j
X
ij
).
(1)
Balassa relates RCA measures to such underlying factors as capital intensity
and human resource development (Balassa, 1979). The RCAs are sector specific
and static. It is possible to make them dynamic by focusing on comparisons over
time and in terms of rates of change. For example, growth of a specific export
more rapidly than worldwide growth of the specific product exports suggests
competitiveness in the specific product.
6
Such a dynamic comparison is shown in
Table 6.
One may want to measure international competitiveness directly, seeking
the causes of a country’s or an industry’s international trade success. The
exchange rate is, of course, the most immediate measure of the terms of trade.
However, the nominal exchange rate, though relevant to trade transactions,
fails to take into account differences in domestic currency production costs.
Comparisons of the temporal movement of real exchange rates can be computed
by adjusting changes in nominal exchange rates for the underlying domestic price
movements.
It is more difficult to establish comparisons of real competitiveness at a point
in time in absolute terms, since they depend on the absolute levels of domestic
input costs (or prices) and on productivity. Can the product be produced more
cheaply in one country than in another? The basic ingredients for such a com-
parison need to be the exchange rate and the underlying costs in the trading
countries. There are several possibilities:
• comparison of wage rates or capital costs,
• comparison of unit labour or unit capital costs, and
• comparison of unit total costs.
In each case, comparisons must be made in terms of currencies adjusted at
nominal exchange rates since these rates apply to goods sold in international
trade. Comparisons of wage rates or capital costs alone fail to allow for differ-
ences in productivity. And the differences due to production technology and its
adaptation to local conditions are critical. Thus, factor cost computations call for
unit cost comparisons. One may compare relative wages and relative productivities
to ascertain competitiveness, for example:
6
Other approaches to measure competitiveness, the Michaely index, a measure of relative net
exports, or the X
2
measure focus on somewhat different questions like trade balance and specialisa-
tion (Laursen, 1998).

106
F. G. ADAMS, B. GANGNES AND Y. SHACHMUROVE
© 2006 The Authors
Journal compilation © Blackwell Publishing Ltd. 2006
(l/q) * w (l
f
/q
f
) * w
f
/XR,
(2)
where (l/q) represents unit labor input, w represents the wage rate, the subscript
f stands for the outside world and XR is the exchange rate (units of domestic
currency per dollar). Given the exchange rate, one may determine labour com-
petitiveness for individual industries on the basis of unit labour output statistics
for separate industries.
Multi-factor cost comparisons pose additional problems since the weights
attached to the factor inputs are likely to differ between countries because of
differences in relative factor cost. Production at different sites is likely to use
different combinations of labour and capital: lots of labour where labour is cheap
and capital expensive and capital-intensive methods where capital is relatively
cheap. That is, after all, what comparative advantage is all about. In that case, the
total unit cost comparison should use the factor weights appropriate for each of
the economies, i.e.:
((l/q) * w) * W + ((k/q) * r) * (1 − W) (((l
f
/q
f
) * w
f
) * W
f
+ (k
f
/q
f
) * r
f
) * (1 − W
f
)/ XR,
(3)
where k represents capital, r is the interest rate, and W stands for the capital share
of inputs.
7
An added complication lies in the need to allow for intermediate
inputs, sometimes coming from foreign sources.
The comparisons based on a single input, labour or capital, are feasible so long
as appropriate data on wages or interest rates and data on output or on labour
or capital productivity can be developed. Multi-factor comparisons are more
difficult because of the need for appropriate weights.
It is possible to approximate a multi-factor comparison by making use of data
from international comparison programmes like the International Comparison
Project (ICP) at the University of Pennsylvania and the International Compar-
isons of Output and Productivity (ICOP) of the Groningen Growth and Develop-
ment Centre. The ICP work takes a final expenditure approach to purchasing
power parity. It has a long and distinguished history going back to Gilbert and
Kravis (1954), Summers and Heston (1991) at the University of Pennsylvania,
and more recently at the World Bank in association with other international
organisations. Survey-based prices for fully described comparable items in final
demand, so-called specification pricing, are used to translate final demand com-
ponents in the comparison country to US dollar values. The computation yields
estimates for per capita GDP in PPP$:
7
Note that even though the weights (W) are country specific, there is no index number problem
here. The comparison is between the cost of producing in one country and in another using the
locally appropriate mix of labour and capital.

WHY IS CHINA SO COMPETITIVE?
107
© 2006 The Authors
Journal compilation © Blackwell Publishing Ltd. 2006
GDP
PPP
j
$
= ∑
i
(Q
io
* P
ijPPP$
)/Pop
j
.
(4)
These can be compared with GDP on an exchange rate basis, sometimes called
the Atlas method:
GDP
XR
j
= ∑
i
(Q
io
* P
ij
)/Pop
j
/ XR
j
.
(5)
The comparison between per capita GDP in PPP$ and on the basis of the
exchange rate yields a measure of exchange rate over- or undervaluation (U):
U
j
= 1 −
GDP
XR
j
/
GDP
PPP
j
$
= 1 − (∑
i
(Q
io
* P
ij
)/ XR
j
/Pop
j
/
∑
i
(Q
io
* P
ij
/XR
iPPP$
)/Pop
j
= 1 − XR
jPPP$
/XR
j
),
(6)
where
GDP
PPP
j
$
and
GDP
XR
j
are GDP per capita in purchasing power terms (prices
are in PPP$) and in exchange rate terms (prices are in local currency but the total
has been divided by the exchange rate), respectively. Pop
j
represents population.
The Q
io
’s are quantities. The quantity weights in this calculation differ greatly
between the countries. It has been customary to use a Fisher average between
estimates based on comparison country quantity weights and base country (usu-
ally the US) weights.
This approach provides a comprehensive measure of undervaluation based on
a detailed appraisal of prices and of all inputs into the production process. How-
ever, for purposes of evaluating costs, a problem with this approach lies in the
price measures. These are expenditure prices, since the purpose of the PPP com-
parison is to compare final output per capita.
8
If PPP is to be used for productiv-
ity comparisons or production costs, the comparison should rather use input
prices. Further difficulties are that the weights applied to the price measures may
not be appropriate for production of traded commodities, and the quantity weights
are not likely to be appropriate either for the base country or the comparison
country. Indeed, one would like to use weights based on production inputs rather
than on consumption.
9
Finally, detailed surveys have not been available for some
countries, including China! In this case, regression methods are used to estimate
a statistic for China on the basis of related countries. This represents a serious
shortcoming.
Nevertheless, in the absence of data on production structure and input prices,
there is much to be said for such a measure. It represents a quick way to measure
8
An important fraction of the prices used in this calculation apply to non-traded goods and
services. These are often cheap compared to goods that are traded internationally. But this may not
represent a problem when the purpose of the calculation is to use per capita real incomes as a proxy
for wages.
9
For a discussion, see Kravis, Heston and Summers (1978) and Summers and Heston (1991), and
also the many papers of the Penn International Comparison Project <http://www.pwt.econ.upenn.edu>.

108
F. G. ADAMS, B. GANGNES AND Y. SHACHMUROVE
© 2006 The Authors
Journal compilation © Blackwell Publishing Ltd. 2006
the undervaluation of a country’s currency with respect to the nominal exchange
rate, and it provides a rough benchmark for intertemporal studies on the move-
ment of real exchange rates. Assuming that wages and GDP per capita are
proportional, the measure may be thought of as a single factor indicator of com-
petitiveness. Alternatively, since it deals with a broad mix of products whose
production calls for labour and capital and the resulting per capita income, it may
also be seen as a multi-factor comparison.
The sectoral value-added approach also has a long history going back to Paige
and Bombach (1959). The recent work under the auspices of ICOP has simplified
the procedures and extended them to many country comparisons including some
for China (van Ark and Timmer, 2001; and Bai et al., 2001). This strategy is
based on comparisons of producing sectors on the basis of industrial census data.
Relative unit value indices (UVR) by sector, computed by dividing sectoral value
added by measures of quantity, are used to deflate sectoral output and to produce
aggregate GDP in PPP terms for each sector, i.e.:
GDP
PPP
j
$
= ∑
i
(w
i
VA
ij
/(UV
ij
/ UV
io
)),
(7)
where the VA
ij
are sectoral value addeds in the comparison country j, UV
ij
and
UV
io
are the sectoral unit value indices in country j and in the base country o
respectively. The weights (w
i
) are sectoral weights either for the comparison
country or for the base country. These may be looked at separately or they are
frequently combined as a Fisher index. As in the expenditure-based procedure,
undervaluation can be computed by comparing the PPP-based measure with the
exchange rate-based measure.
There are things to be said in favour and against the sectoral value-added
approach. The chief objections are that it makes use of unit values rather than
prices for explicitly defined products and that, in simplified procedures, it uses
sectoral ouputs rather than subtracting intermediate inputs, a likely source of
errors. On the other hand, the sectoral approach has the advantage that it allows
comparisons at the industry level. Moreover, these comparisons can be made
directly between unit values in local currency and in US dollars, producing a
sector-specific implied exchange rate. This is a considerable advantage for evalu-
ating competitiveness.
It is important also to note that there are important aspects of competitiveness
that are not captured by either approach. These include costs of delivering prod-
ucts to world markets, including transportation, communication and coordination
costs, as well as policy-related barriers or incentives to trade. In many countries
government policy has favoured export-oriented development, which may give a
competitive edge to export enterprises. At the same time, market opening, for
example, the increasing presence of foreign firms in China that is set to take
place now that China has been admitted to the WTO, gives extra incentives for

WHY IS CHINA SO COMPETITIVE?
109
© 2006 The Authors
Journal compilation © Blackwell Publishing Ltd. 2006
foreign firms to set up production facilities in anticipation of greater market
access in the future. The phasing-out of apparel trade quotas at the end of 2004
is another regulatory change that is likely to have substantial impacts.
Foreign direct investment is likely to be the most important contribution
to competitiveness through the introduction of new production methods, world
market product specifications, and advanced management procedures. These are
measured only indirectly in the comparative price or unit value relatives data.
5. DETERMINANTS OF CHINESE COMPETITIVENESS
We apply the discussion above to measure the determinants of Chinese
competitiveness. It is necessary to look at a variety of measures and to infer how
they explain the competitiveness of Chinese products. As we have noted, at
issue is the role of the exchange rate versus other factors in explaining Chinese
competitiveness.
a. Revealed Comparative Advantage
A picture of rapidly increasing Chinese competitiveness is apparent if we
compute a dynamic form of revealed comparative advantage (RCA), comparing
the growth rate of world trade of a specific country to the growth rate of world
exports (Table 6). Note that an RCA in excess of 1 suggests that a country
is competitive in world markets, i.e. that its share of world exports has been
increasing. China is above 2, in the 1980 to 2000 period. China’s exports grew at
TABLE 6
Dynamic RCAs 1970–2002
(Annual per cent change in country exports/annual per cent change in world exports)
1970–1980
1980–1990
1990–1995
1995–2000
2000–2003
China
1.11
2.19
2.14
2.24
3.66
Hong Kong
1.11
2.57
1.84
0.65
0.67
Memo: China
+ HK
2.22
2.36
1.96
1.46
2.49
S. Korea
1.66
2.33
1.60
1.40
0.78
Malaysia
1.01
1.73
2.27
1.23
0.07
Philippines
0.93
0.62
1.89
3.58
−0.51
Thailand
1.20
2.25
2.19
0.88
1.04
Singapore
1.34
1.78
1.98
0.67
0.28
Indonesia
1.68
0.03
1.40
1.36
−0.11
Taiwan
1.42
2.39
0.94
1.23
−0.60
Japan
1.03
1.40
1.06
0.34
−0.10
US
0.89
0.99
0.97
1.26
−0.49
Source: Computed from IMF, International Financial Statistics.

110
F. G. ADAMS, B. GANGNES AND Y. SHACHMUROVE
© 2006 The Authors
Journal compilation © Blackwell Publishing Ltd. 2006
a rate 3.7 times the global average growth during 2000–2003. Significantly, we
can see a systematic decline in the RCAs of most East Asian countries; beginning
in 1995, with low or negative numbers for almost all during 2000–2003, except
of course, for China. It is important to note, however, that revealed comparative
advantage is an ex post measure, demonstrating but not explaining the underlying
trends.
b. The Exchange Rate
The nominal exchange rate is typically the rate relied on for evaluating trade
transactions and is often the target for exchange rate pegging between different
currencies, the RMB yuan to the dollar for example. But longer term decisions
about importing and exporting, or about foreign sourcing of production, must be
based on a real exchange rate that takes into account changes in domestic prices
as well. Figure 2 shows real exchange rates adjusted for inflation differentials
between East Asian countries and the United States.
10
The graph shows the paths
of real exchange rates from their initial levels normalised to 100 in l992.
The 1994 devaluation of the Chinese currency from 5.8 to 8.3 RMB yuan per
US dollar is often cited as a critical factor responsible for the extraordinary
growth of Chinese exports (Naughton, 1996). Note how the decline of the Chinese
exchange rate preceded the devaluations of other East Asian exchange rates in
1997–1998. Some have argued that the Chinese devaluation reduced the com-
petitiveness of other East Asian countries and precipitated the 1997 crisis. On the
other hand, the 1994 devaluation was principally an alignment of official rates to
market rates at which most exports were already being priced.
11
The mid-1990s,
when Chinese exports grew so greatly, also marks the time when factories in
Shenzhen and Guangdong were being equipped to produce quality products for
the world market. It is likely that China’s export record during this period repres-
ents the result of capital investments or management by foreign (often Hong
Kong or Taiwanese) entrepreneurs, though there was also important assimilation
of technology and learning-by-doing.
10
For reasons of consistent coverage, deflation was done on the basis of the CPI. Alternative
measures of prices, more appropriate in this case, gave approximately the same results. Comparison
against the Japanese yen and the euro would show even greater depreciation for the Chinese and
East Asian currencies since the US dollar has depreciated relative to the yen and the euro. These
data show the same patterns as the nominal rates, though perhaps a little more strongly since the US
inflation rate was higher on average than in most of the East Asian countries.
11
The magnitude and impact of Chinese exchange rate unification in 1994 is subject to some debate.
‘Although it is inherently difficult to say what share of transactions already were taking place at the
market rate, some estimates put the share as high as 80% in which case the devaluation was only
10%.’ (Federal Reserve Bank of San Francisco, 1998. Also see the careful analysis in Fernald et al.,
1998.) It may also be noted that the Chinese market exchange rate had depreciated 40 per cent in
the preceding two years, largely but not wholly offset by China’s inflation rate of 26 per cent.
WHY IS CHINA SO COMPETITIVE?
111
© 2006 The Authors
Journal compilation © Blackwell Publishing Ltd. 2006
FIGURE 2
East Asian Exchange Rates Adjusted for Inflation
12
Comparison against the Japanese yen and the euro would show less depreciation until 2002
because the US dollar appreciated. But more recently, the US dollar depreciation relative to the yen
and the euro means the RMB and other East Asian currencies have depreciated more against other
world currencies.
In July 2005, the Chinese government announced that it would follow a floating
exchange rate policy, adjusting the quoted exchange rate on the basis of a trade-
weighted market basket of foreign currencies. The immediate effect on the RMB
yuan/US dollar rate was approximately a two percent appreciation. Since then,
the exchange rate against the US dollar has been kept remarkably stable. It is not
clear that the change from an exchange rate related to the US dollar to a rate
related to an unspecified market basket of currencies will make an important
difference, not that change from a ‘fixed’ rate to a supposedly ‘floating’ rate will
soon be allowed to lead to significant appreciation of the RMB yuan.
After the 1997 crisis other exchange rates in East Asia adjusted downward, and
exchange rates throughout the region are now generally aligned with that of China
as they were in 1992 before China’s devaluation. The exceptions are Hong Kong
and Singapore, whose currencies have risen relative to 1992 parities, and Indonesia,
which depreciated by a much greater extent than other regional currencies. For
the region as a whole, the figures suggest a decline in the exchange rate of some
40 to 50 per cent. The result is striking in that for China and most other East
Asian countries the real exchange rate in 2003 was about half its level of ten
years earlier. In other words, Chinese and other East Asian exports have been
supported by a substantial real depreciation of their currency exchange rates.
12
The discussion above deals with the changes in competitiveness over time. An
important question is the level at a given point in time. In this sense, there is little
disagreement that the RMB yuan is undervalued, the question is by how much.
International comparisons of purchasing power have long indicated that for many
112
F. G. ADAMS, B. GANGNES AND Y. SHACHMUROVE
© 2006 The Authors
Journal compilation © Blackwell Publishing Ltd. 2006
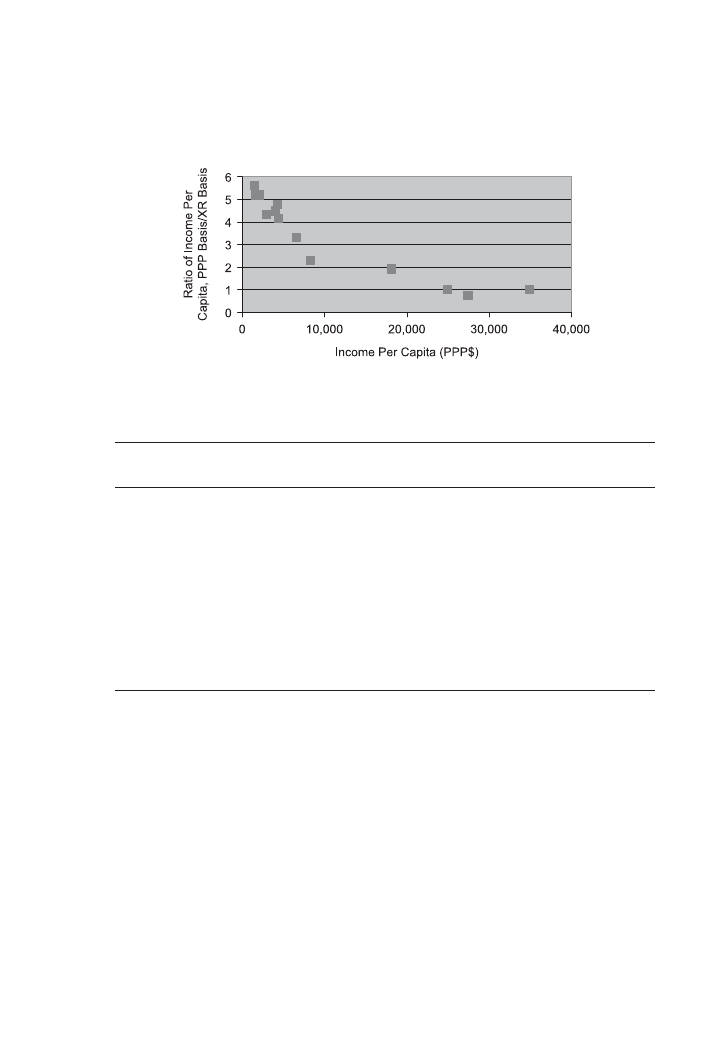
FIGURE 3
Relationship Between GDI Per Capita and PPP Income/XR Income, 2001
(Data from Table 5)
TABLE 7
Income Per Capita 2002
(Exchange rate and PPP basis and undervaluation)
$XRbasis
$PPPbasis
Undervaluation
Per Cent
China
960
5,792
83
S. Korea
9,930
16,960
41
Malaysia
3,540
8,500
58
Philippines
1,030
4,450
77
Thailand
2,000
6,890
71
Singapore
20,690
23,730
13
Indonesia
710
3,070
77
Vietnam
430
23,000
81
Cambodia
300
1,970
85
Laos
310
1,660
81
Japan
34,010
27,380
−25
US
35,400
36,110
2
Source: World Bank data.
developing countries per capita GDP on a purchasing power parity (PPP) basis
yields much higher figures than the corresponding comparison based on nominal
exchange rates (Summers and Heston, 1991). (Ratios between per capita income
in PPP$ and on the basis of the exchange rate are shown in Figure 3.)
Though developing countries have very low incomes in comparison to the
United States and other advanced countries when translated into dollars at market
exchange rates, the disparity is not as large when adjusted for differences in local
purchasing power (Table 7). For China, the discrepancy between market- and
PPP-adjusted income is extreme – exchange rate-based GNI per capita is $960,
compared with PPP-adjusted GNI per person of $5,792 – a factor of 6 to 1. This

WHY IS CHINA SO COMPETITIVE?
113
© 2006 The Authors
Journal compilation © Blackwell Publishing Ltd. 2006
TABLE 8
Unit Value Ratios by Manufacturing Branch, China/US 1995*
At Chinese
At US
Average
Undervaluation
Weights
Weights
(Per cent)
(Assuming
8.35y
= US$)
Food and kindred products
5.8
5.8
5.8
69.9
Textile mill products
3.9
5.3
4.6
54.6
Wearing apparel
3.4
5.7
4.4
52.7
Leather products and footwear
2.2
2.2
2.2
26.7
Wood products
2.3
3.7
2.9
34.5
Paper products, printing & publishing
5.5
5.2
5.4
64.1
Chemicals and allied products
7.1
7.8
7.4
89.2
Petroleum and coal products
7.9
8.1
8
95.5
Rubber and plastic products
6.8
7
6.9
82.5
Non-metallic mineral products
2.4
1.7
2
23.9
Basic metal products
5.3
7.3
6.2
74.6
Fabricated metal products
2
6.4
3.6
43.3
Machinery and equipment
1.5
2.5
1.9
23.0
Transport equipment
1
1
1
11.8
Office, acct. computing machinery
2.5
6.6
4.1
48.5
Electrical machinery and equipment
3
3.3
3.2
37.8
Other manufacturing equipment
4.2
4.8
4.5
53.9
Total manufacturing
4.2
4.8
4.5
53.9
Note:
* It is unfortunate that the calculation is not more up to date. The authors indicate that they have not yet updated
the information but relative values are not likely to be greatly changed.
Source: Bai et al. (2001, p. 49).
represents an undervaluation of 83 per cent (World Bank, 2003). This implies an
equilibrium rate of exchange of perhaps 1.4 RMB yuan per dollar rather than 8.3
RMB yuan per dollar, its recent pegged value. In other words, each RMB yuan
is worth 70 cents rather than its pegged exchange rate of 12 cents. By this
measure, China’s undervaluation is greater than in many other East Asian countries,
although the poorest economies (Vietnam, Laos and Cambodia) and those at the
heart of the 1997 Asian financial crisis show similar degrees of undervaluatuion.
Turning to the alternate unit value approach, sectoral unit value ratios (Table 8)
compare the unit value of output in the total manufacturing and in major production
sectors between China and the United States. The unit value ratios are simply the
value per unit of sectoral real output in RMB yuan in China divided by the corre-
sponding unit value per unit of real output in the US measured in US dollars.
That means, for example, that the unit value (approximately one could say
price) of a unit of food and kindred products is 5.8 RMB yuan in China for every
dollar in the United States. That figure can be compared to an exchange rate of
8.3 RMB yuan to the dollar to measure undervaluation, as in the last column of

114
F. G. ADAMS, B. GANGNES AND Y. SHACHMUROVE
© 2006 The Authors
Journal compilation © Blackwell Publishing Ltd. 2006
the table. As in the PPP comparison, substantial undervaluation of the yuan is
apparent, though not as large in most industries as the PPP figures suggest.
However, note that the results differ greatly by sector. The degree of under-
valuation is greatest precisely in products that have heavy weights in Chinese
export trade: leather goods, wood products, machinery and equipment. Textiles
and wearing apparel show a unit value ratio indicating undervaluation near 50 per
cent. Not surprisingly, products where China is a net importer, petroleum and
chemicals, for example, are almost fully valued according to the exchange rate.
13
Unfortunately, sectoral comparisons of unit value ratios with competing East
Asian exporters are not available.
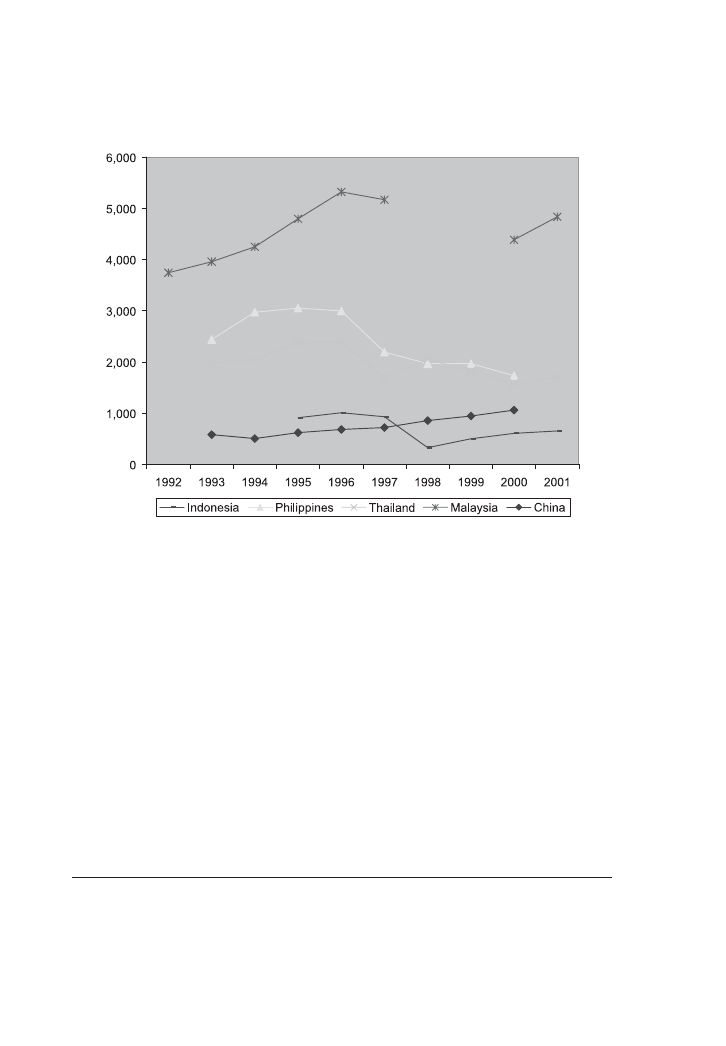
c. Labour Costs
As we suggested above, an advantage of the PPP exchange rate or unit value
comparisons is that it provides a ready though approximate ‘multi-factor’ measure
of currency under- or overvaluation. But since PPP or unit value comparisons
are based on surveys of domestic prices, they are imperfect measures of costs
of Chinese products actually delivered to world markets, where market prices
in a world currency such as the US dollar are relevant. While comparative
information on production structures and input costs is not available, clearly
wages represent a key cost ingredient. Chinese wages are extremely low by
world standards and in comparison with most, but not all, East Asian countries.
Annual manufacturing earnings for China and several other developing Asian
economies are shown in US dollars on an exchange rate basis in Figure 4.
China’s annual wages averaged in 8,750 RMB in 2000, just over US$1,000.
Chinese wages in dollars have been increasing rapidly (15 per cent per year in
2001 and 2002), and in some parts of China where exports originate – such as
Shanghai, Fujian and Guangdong provinces – they are higher than the national
average, by a factor of 2. Still, overall manufacturing wages remain well
below those in the Philippines and Thailand. Only post-crisis Indonesia and
Vietnam have lower wages. Considering that the United States’ manufacturing
wages average over $25,000 on an annual basis, it is not surprising that many
products can be produced in China at much lower cost than in the US.
14
13
According to the author, the statistic recorded for transport equipment is based on only one
observation.
14
Differences in productivity likely offset some, but not all, of these cost advantages. While aggregate
labour productivity has been estimated at 3–7 per cent of US levels, it is purportedly much higher
in foreign-financed and joint venture enterprises that are important exporters. (See UNCTAD, 2002;
Szirmai and Ruoen, 2000; and Wu, 2001.) Sectoral-level data is sketchy, but productivity also
appears to be higher in key export industries, such as footwear, apparel and electrical machinery.
Bai, Ren and Szirmai (2001) report 1995 estimates for these industries ranging from 6–13 per cent
of US levels.
WHY IS CHINA SO COMPETITIVE?
115
© 2006 The Authors
Journal compilation © Blackwell Publishing Ltd. 2006
There are, of course, also differences in benefits associated with employment.
Traditionally, these have been very important in China, but as China has turned
away from state-owned enterprises, benefits, like housing, have been diminishing
rapidly.
The wage differentials that favour production in East Asia, and specifically in
China, have persisted for many years and, consequently, do not provide a single
factor explanation for the recent upsurge of Chinese exports. In recent years there
has been rapid increase in wages, particularly of skilled workers and in the
export-intensive provinces like Guangdong. However, China’s enormous rural
population and increasing numbers of ‘floating’ urban workers suggest that it will
be many years before the supply of low-cost unskilled labour runs out.
Other cost considerations are more difficult to measure than wages. It is well
known that transportation costs have been coming down for many years – air
freight, for example – and trade barriers are set to be reduced with China’s entry
to the WTO.
15
FIGURE 4
Average Annual Earnings in Manufacturing (US$)
Source: ILO and Chinese Statistical Yearbooks.
15
Hummels (1999) provides evidence that transportation costs overall have not declined in the
post-war period, casting doubt on their role in explaining global trade growth. However, he does
find sharp declines in air transport costs which helped to propel the strong growth in that sector.

116
F. G. ADAMS, B. GANGNES AND Y. SHACHMUROVE
© 2006 The Authors
Journal compilation © Blackwell Publishing Ltd. 2006
6. FOREIGN DIRECT INVESTMENT AS A DETERMINANT OF COMPETITIVENESS
A critical consideration for competitiveness is supplying products that meet
world market specifications with respect to design, quality and technological
content. This represented an important step in the growing competitiveness
of Chinese industry. Prior to the 1990s, China was selling simple goods of
relatively low quality. Since then, in part as a result of the intervention of foreign
investors from Hong Kong and Taiwan and more recently from Europe, North
America and Japan, China has become a focus for foreign direct investment.
China offers a special advantage over other East Asian countries in that many
foreign producers view their entry as export producers in China only as a first
step, hoping ultimately also to sell in the huge and growing Chinese domestic
market (Park and Lee, 2003). Others, like the automobile industry, are producing
for the domestic market, with the ultimate objective of also using China as an
export platform.
16
Foreign firms begin by setting up subsidiaries or joint ventures in China to
produce products for their home markets.
17
These have to meet world specifica-
tions and quality requirements. Increasingly, they are also raising the level of
technology. As a result, Chinese goods have become highly competitive in
Western markets and account for a growing market share. Frequently, the rela-
tionships within a geographic industrial cluster enable Chinese domestic firms to
develop products comparable to those being sold in the world market, to apply
internationally-used technologies, and to draw on experienced workers and sup-
pliers. Important knowledge externalities result from foreign investment in China
(Liu, 2002; Liu and Wang, 2003; and Thompson, 2003). Learning to produce
and economies of scale enable Chinese producers to improve their production
efficiency.
Foreign direct investment has been a critical consideration in improving China’s
ability to produce goods for the world market. China has been the dominant
recipient of foreign direct investment in East Asia, receiving almost $50 billion
of FDI annually; an important factor not only for capital flows but also for flows
of technology and management skills (see Table 9).
18
It is possible to link statistically the relationship between foreign direct invest-
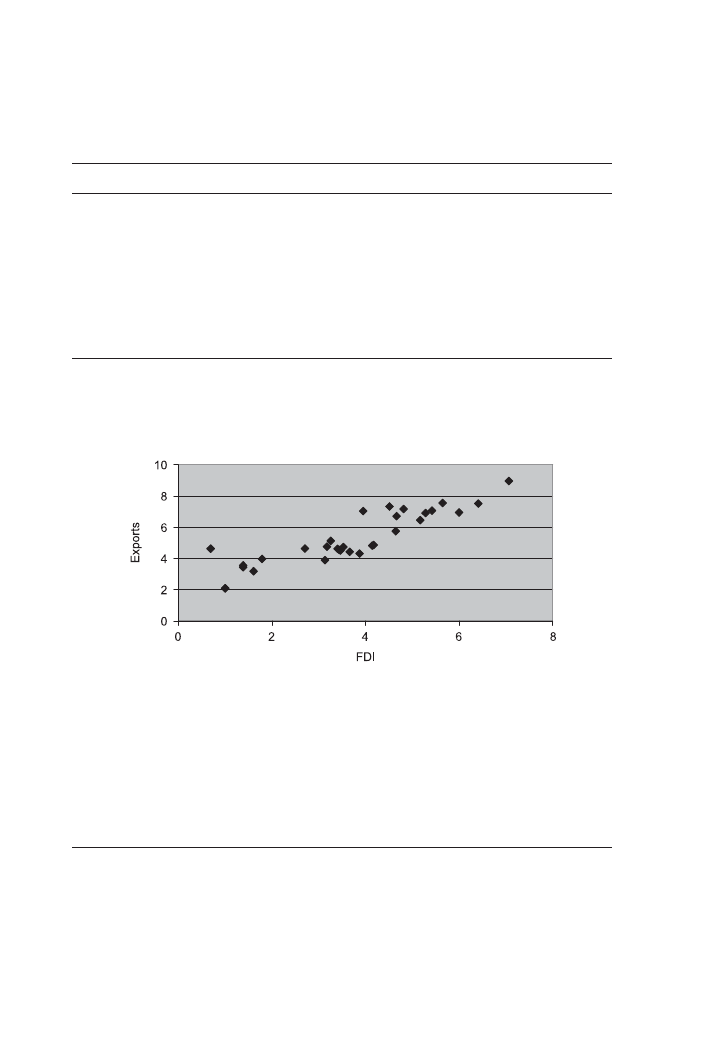
ment and China’s export prowess. In Figure 5, cross-section data on FDI and
16
There are differences based on the nationality of the investor. Korean firms see China as an
export-processing base, whereas US firms tend to target local markets (Park and Lee, 2003). Also
see Huang (2004).
17
For a contrary view of Chinese success in attracting FDI see Huang (2003), who argues that
the surge in FDI reflects the barriers facing China’s domestic private firms which make them
uncompetitive compared with foreign multinationals.
18
Next to the United States, China has become the world’s largest FDI recipient.
WHY IS CHINA SO COMPETITIVE?
117
© 2006 The Authors
Journal compilation © Blackwell Publishing Ltd. 2006
TABLE 9
Foreign Direct Investment in East Asia 1994–2003
(Net inflows, millions of US$)
1994
1998
2000
2001
2002
2003
China
33,787
43,751
38,399
44,241
49,308
Hong Kong
–
−2,220
2,572
12,432
−7,781
9,791
Memo: China
+ HK
41,531
40,971
56,673
41,527
South Korea
−1,652
673
4,285
1,108
−224
−207
Taiwan
−1,265
−3,614
−1,773
−1,371
−3,441
−5,226
Indonesia
2,109
−356
−4,550
−3,278
−1,513
–
Malaysia
4,342
2,163
3,788
554
3,203
–
Philippines
1,591
2,287
1,345
982
1,111
–
Singapore
–
–
11,919
−2,025
2,030
5,873
Thailand
1,366
7,315
3,366
3,820
900
Source: ADB.
FIGURE 5
Exports and FDI
(Chinese provinces in 1999 log data)
exports by province of China (1999) show a remarkable relationship.
19
The role
of Gaungdong province is dominant with 30 per cent of China’s FDI imports and
40 per cent of Chinese exports.
The geographic linkage between the level of foreign direct investment into the
eastern provinces of China and these regions as a source of China’s exports is
unmistakable. Foreign investors not only provide capital; in most cases, they are
responsible for technical and managerial skills and often they provide foreign
19
The estimated equation is
ln(ex)
= 1.917 + 0.908 ln(FDI) R
2
= 0.802.
(0.08)
Similar results can be obtained from a cross-country regression for East Asia.

118
F. G. ADAMS, B. GANGNES AND Y. SHACHMUROVE
© 2006 The Authors
Journal compilation © Blackwell Publishing Ltd. 2006
TABLE 10
Electronics-related Foreign Direct Investment Inflows to China
(Per cent of total FDI)
Taiwan’s Hong Kong
US Net
Japan Net
Indirect Mainland
FDI Outflows
FDI Outflows
Investment
to China
to China
Year
Electronics &
Electronics and
Electrical
Electrical Appliances
Electronic Components
Equipment
(Per cent share)
(Per cent share)
(Per cent share)
1989–1997
18.2*
31.1**
19.4*
1998
38.6
42.6
11.8
1999
42.9
33.2
9.7
2000
56.2
58.5
32.2
2001
45.1
82.9
35.3
2002
39.0
17.7
Notes:
In millions of US dollars. *1989–1997 total, **1991–1997 total.
Source: Computed: China inward FDI from UNCTAD.
Hong Kong indirect mainland investment from HK report, ‘Statistics on Approved Indirect Mainland Invest-
ment by Year and Area’.
US net FDI outflows from US BEA.
Japan outward FDI from Ministry of Finance.
20
Correspondence with a Chinese business consultant. He points out that using world technology
the Bird brand of telephone handsets has gained the number one position in China. The Chery
automobile, supposedly based on GM designs, is another example.
markets as well. These firms integrate their Chinese operations into a value chain
that extends into the world economy (Ng and Yeats, 2003). Many of the foreign
investment projects take the form of joint ventures with Chinese partners. The
partner firms inform themselves of foreign technology and frequently take advant-
age of it to promote their own projects.
20
Chinese products today meet world specifications and quality requirements.
Increasingly, they are also raising their level of technology. The changing nature
of inward foreign direct investment points to China’s evolving role as a high-tech
producer. Table 10 shows the share of electronics-related FDI inflows of total
FDI from three countries for which industrially-detailed data are available, the
US, Japan and Taiwan’s approved FDI flows via Hong Kong. (Hong Kong itself
is the single largest provider of FDI to mainland China, but detailed data are not
available for these flows.) The data show a growing share of inward FDI in
electronics and related components. For both Taiwan and the US, in particular,
this share more than doubled in recent years.
As a result, Chinese goods have become more technically sophisticated and
have increasingly been accepted in Western markets. Many of these products are

WHY IS CHINA SO COMPETITIVE?
119
© 2006 The Authors
Journal compilation © Blackwell Publishing Ltd. 2006
made to specifications of developed-country importers. Some goods are produced
by subsidiaries of large multinational trademark firms. Some Chinese firms have
also begun to establish trademarks that are known and accepted in international
markets (e.g. Haier, Konka, Huawei and Lenovo).
It is not possible statistically to measure the qualitative improvements that
have increased the competitiveness of Chinese products. But, changes in the
range of products being produced are suggestive of the developments that are
taking place.
21
7. OTHER FACTORS INFLUENCING COMPETITIVENESS
Some authors have put heavy emphasis on cultural factors as promoters
of East Asian growth and competitiveness (Harrison and Huntington, 2000).
This type of explanation that might be termed the ‘Asian values, Asian success’
paradigm lacks explicit linkages to the practices of Asian entrepreneurs (Adams
and Vernon, 2005). In the Chinese case, the cultural argument for relating Asian
success to Asian values is complicated by the fact that China is a transitional
economy in which national and provincial governments still maintain a sub-
stantial stake in industry. On the other hand, it may be argued that the turn
toward the market economy has helped. Moreover, the entrepreneurs from Hong
Kong, Taiwan and elsewhere ‘overseas’, who have motivated and directed many
of the new Chinese export ventures, share language and culture with the Chinese
mainland.
Finally, there is a question of export-promoting policies. The shift from a
self-sufficiency to trade expansion was a central element of China’s modernisa-
tion policy in the late 1970s and early 1980s, as has been the encouragement
of FDI and private participation since then (Chow, 2002). There are numerous
advantages and incentives for exporting firms, including foreign trade zones
(now extended from the east coast to all of China), retention of earned foreign
exchange, special tax concessions, etc. Moreover, foreign firms are encouraged
to establish joint ventures with Chinese firms in order to receive approval for
producing for the Chinese market. These policies have undoubtedly encouraged
FDI and have facilitated the development of export business. On the other hand,
such policies are typical of the East Asian region, as has been the opening of
world trading potentials through reductions in tariffs and quantitative restrictions.
These policy-related developments are likely a factor but not a complete explana-
tion for China’s recent export competitiveness.
21
Among recent articles that have documented China’s export gains in capital-intensive
and high-tech export markets are Wong and Chan (2002), Chen (2001) and Voon and Yue
(2003).

120
F. G. ADAMS, B. GANGNES AND Y. SHACHMUROVE
© 2006 The Authors
Journal compilation © Blackwell Publishing Ltd. 2006
8. EVALUATION
What do these informational elements suggest about the causes of China’s
competitiveness and export growth? The explanation clearly cannot be mono-
causal. China’s export competitiveness hinges on the coincidence of several factors:
the favourable exchange rate, low wages and available supplies of unskilled
labour, the reduced cost of communication and transportation, the flow of foreign
direct investment and foreign management and its implications for China’s
productive abilities, the large scale of the potential Chinese domestic market, the
opening of world markets, and the encouragement of Chinese foreign trade policy.
On the other hand, certain considerations have special importance. For example,
Chinese export growth is more than a matter of low wages and an undervalued
exchange rate. Appreciating the exchange rate, even by substantial amounts, is
not likely to greatly diminish Chinese competitiveness. China’s huge pool of
cheap and increasingly mobile labour means that even with exchange rate re-
adjustment, competitiveness based on low labour costs will be maintained for
quite some time. Chinese competition may also further displace some low-cost
export production in other parts of the world, East Asia or Mexico, for example,
although in East Asia most regional exchange rates have adjusted back in line
with that of China prevailing in the early 1990s.
Secondly, Chinese producers have become greatly more proficient at meeting
world requirements for quality and product design. The large inflow of foreign
direct investment and entrepreneurship, which is responsible for much of the
export flow, has facilitated this process, and, in turn, reflects the favourable
economics of export production in China. The shift of Chinese production toward
more advanced products with technological content is also notable. On the one
hand, this represents competition with other East Asian countries. On the other, it
reflects a collaborative symbiotic relationship with South Korea, Singapore and
Taiwan, whose cost structure has outgrown the simpler high-technology goods
that supported earlier phases of their industrialisation.
China’s competitive ace in the hole continues to be its large and potentially
mammoth domestic market. Foreign firms seek entry to China not only to take
advantage of low-cost export platforms, but also as a way to position themselves
for future local sales. Aside perhaps for India, there is simply no other develop-
ing economy with such promise as a market.
What are the implications for the US and China’s competitors of China’s
growing international market prowess?
Even though current China’s strength in export markets is as much a result of
improved production abilities as of the exchange rate, a persistently undervalued
RMB yuan would be a serious matter. The resulting adjustments in production
and trade would not be consistent with long-term comparative advantage. More-
over, undervaluation is likely not in China’s best interest, since it increases the

WHY IS CHINA SO COMPETITIVE?
121
© 2006 The Authors
Journal compilation © Blackwell Publishing Ltd. 2006
cost of imported goods in China and lessens competitive pressures from abroad
that help to raise Chinese productivity. On the other hand, even if the RMB yuan
were significantly appreciated, patterns of trade will continue to change in favour
of China.
For the US, specialisation away from labour-intensive or low-technology
products is inevitable and in the nation’s overall interest. Structural adjustment
among and within industries is painful and the impact on employment and wages
represents an issue, socially and politically.
For other East Asian countries, appreciation of China’s RMB yuan would
help competitively, but these countries, too, make their biggest gains up the
development ladder by upgrading their production into more advanced products.
REFERENCES
Adams, F. G. and S. Ichimura (eds.) (1998), East Asian Development (Westport, CT: Praeger).
Adams, F. G. and H. Vernon (2004), ‘Economic Developments, Business Culture and its Links to
Business Practice: Is there a Thai Style of Management?’, International Jouranl of Business, 9,
2, 179–200.
Adams, F. G. and H. Vernon (2005), ‘Cultural Considerations of Business and Economic Develop-
ment in East Asia’, to be published in H. W. Yeung (ed.), Handbook of Research on Asian
Business (Cheltenham: Edward Elgar).
Bai, R. and A. Szirmai (2001), ‘A New Benchmark Comparison of Manufacturing Pro-
ductivity, China-USA, 1995’ (University of Western Australia mimeo, online http://
www.econs.ecel.uwa.edu.au/economics/Links/papers/aces_ren_r.pdf).
Balassa, B. (1965), ‘Trade Liberalization and Revealed Comparative Advantage’, The Manchester
School of Economic and Social Studies, 33, 99–123.
Balassa, B. (1979), ‘The Changing Pattern of Comparative Advantage in Manufactured Goods’,
Review of Economics and Statistics, 61 (May), 259–66.
Chen, W. (2001), ‘Export Competition between Thailand/Malaysia and China in the US Market:
A Survey on Electrical and Electronic Products’ (Asia Fellow Program mimeo, online http://
www.asianscholarship.org/publications/papers).
Chow, G. C. (2002), China’s Economic Transformation (Malden, MA: Blackwell).
Cohen, S. S. (1994), ‘A Reply to Krugman’, Berkeley Roundtable on the International Economy
Research Notes (June).
Competitiveness Policy Council, US (1992), The First Report to the President and Congress.
Dornbusch, R., S. Fisher and P. Samuelson (1977), ‘Comparative Advantage, Trade, and Payments
in a Ricardian Model with a Continuum of Goods’, American Economic Review, 67, 12, 823–
39.
Federal Reserve Bank of San Francisco (1998), ‘Export Competition and Contagious Currency
Crises’, FRBSF Economic Letter, 98-01.
Fernald, J., H. Edison and P. Loungani (1998), ‘Was China the First Domino? Assessing Links
between China and the Rest of Emerging Asia’, Board of Governors, Federal Reserve System,
International Finance Discussion Paper No. 604 (March).
Gilbert, M. and I. B. Kravis (1954), An International Comparison of National Products and Pur-
chasing Power of Currencies (Paris: OECD).
Harrison, L. E. and S. P. Huntington (eds.) (2000), Culture Matters: How Values Shape Human
Progress (New York; Basic Books).
Helpman, E. and P. Krugman (1985), Market Structure and Foreign Trade (Cambridge, MA: MIT
Press).

122
F. G. ADAMS, B. GANGNES AND Y. SHACHMUROVE
© 2006 The Authors
Journal compilation © Blackwell Publishing Ltd. 2006
Heston, A. and R. Summers (1996), ‘International Price and Quantity Comparisons: Potentials and
Pitfalls’, American Economic Review, 86, 2, 20–24.
Huang, J.-T. (2004), ‘Spillovers from Taiwan, Hong Kong, and Macau Investment and Other
Foreign Investment on Chinese Industries’, Contemporary Economic Policy, 22, 1, 13–25.
Huang, Y. (2003), Selling China: Foreign Direct Investment During the Reform Era (Cambridge:
Cambridge University Press).
Hummels, D. (1999), ‘Have International Transportation Costs Declined?’ (University of Chicago
mimeo, July).
Jones, R. (2000), Globalization and the Theory of Input Trade (Cambridge, MA: MIT Press).
Kojima, A. (2002), Look Japan, 48 (December), 22.
Kravis, I., A. Heston and R. Summers (1978), International Comparisons of Real Gross Product
(Baltimore, MD: Johns Hopkins University Press).
Krugman, P. (1994), ‘Competitiveness: A Dangerous Obsession’, Foreign Affairs (April/March),
23
, 2, 28–44.
Lardy, N. R. (1994), China and the World Economy (Washington, DC: Institute of International
Economics).
Laursen, K. (1998), ‘Revealed Comparative Advantage and the Alternatives as Measures of
International Specialization’ (Copenhagen: Danish Research Unit for Industrial Dynamics).
Liu, X. and C. Wang (2003), ‘Does Foreign Direct Investment Facilitate Technological Progress?
Evidence from China’, Research Policy, 32, 6, 945–53.
Liu, Z. (2002), ‘Foreign Direct Investment and Technology Spillover: Evidence from China’,
Journal of Comparative Economics, 30, 3, 579–602.
Naughton, B. (1996), ‘China’s Emergence and Prospects as a Trading Nation’, Brookings Papers in
Economic Activity, 2, 273–344.
Ng, F. and A. Yeats (2003), ‘Major Trade Trends in East Asia’, World Bank Policy Research Paper
No. 3084 (Washington, DC: World Bank, available at http://econ.worldbank.org).
Paige, D. and G. Bombach (1959), A Comparison of National Output and Productivity in the
United Kingdom and the United States (Paris: OECD).
Park, B. and K. Lee (2003), ‘Comparative Analysis of Foreign Direct Investment in China: Firms
from South Korea, Hong Kong, and the United States in Shandong Province’, Journal of the
Asia Pacific Economy, 8, 1, 57–84.
Porter, M. (1990), The Competitive Advantage of Nations (New York: Macmillan).
Prestowitz, C. V. (1988), Trading Places: How America Allowed Japan to Take the Lead (Boston,
MA: Tuttle).
Summers, R. and A. Heston (1991), ‘The Penn World Table (Mark 5): An Expanded Set of Inter-
national Comparisons, 1950–1988’, Quarterly Journal of Economics, 106, 2, 327–68.
Szirmai, A. and R. Ruoen (2000), ‘Comparative Performance in Chinese Manufacturing, 1980–
1992’, China Economic Review, 11, 16–53.
Thompson, E. R. (2003), ‘Technology Transfer to China by Hong Kong’s Cross-border Garment
Firms’, Developing Economies, 41, 1, 88–111.
UNCTAD (2002), Trade and Development Report (New York: United Nations).
van Ark, B. and M. Timmer (2001), ‘The ICOP Manufacturing Database: International Compari-
sons of Productivity Levels’, International Productivity Monitor, 3, 44–51.
Vernon, R. (1966), ‘International Investment and International Trade in the Product Cycle’, Quar-
terly Journal of Economics, 80 (May), 190–207.
Voon, J. P. and R. Yue (2003), ‘China-Asean Export Rivalry in the US Market’, Journal of the
Asia Pacific Economy, 8, 2, 157–79.
Wong, J. and S. Chan (2002), ‘China’s Emergence as a Global Manufacturing Centre: Implications
for ASEAN’, Asia-Pacific Business Review, 9, 1, 79–94.
World Bank (2003), World Development Indicators (Washington, DC: World Bank).
Wu, H. X. (2001), ‘China’s Comparative Labor Productivity Performance in Manufacturing, 1952–
1997. Catching Up or Falling Behind?’, China Economic Review, 12, 162–89.

Wyszukiwarka
Podobne podstrony:
China s Competitiveness (2005)
2006 Jujitsu America Sport Jujitsu Competition Rules
puchar swiata 2006 www prezentacje org
Gospodarka płynami kwiecień 2006
Znaki taktyczne i szkice obrona, natarcie,marsz maj 2006
Prowadzenie kliniczne pacjentów z dobrym widzeniem M Koziak 2006
prezentacja cwiczen 2006
Wyklad 09 2006
Wyk 2 WE Polityka monetarna 2006 2
urazy kl piersiowej 04 2006
Wyk 6 Model klasyczny 2006
ADHD 2006
1 zaburzenia krążenia 1 2006 07 III
więcej podobnych podstron