
Financial Section
How To Prepare a
Restaurant
Business Plan

Table of Contents
Introduction......................................................................................................................... 1
Projected Sources & Uses of Cash...................................................................................... 2
Capital Budget .................................................................................................................... 3
Land & Building ............................................................................................................. 3
Leasehold Improvements ................................................................................................ 3
Bar/Kitchen Equipment .................................................................................................. 3
Bar/Dining Room Furniture............................................................................................ 3
Professional Services ...................................................................................................... 3
Organizational & Development ...................................................................................... 4
Interior Finishes & Equipment........................................................................................ 4
Exterior Finishes & Equipment ...................................................................................... 4
Pre-Opening Expenses .................................................................................................... 4
Working Capital & Contingency .................................................................................... 4
Sales Projection................................................................................................................... 6
Hourly Labor Cost Projection............................................................................................. 9
Assumptions to the Financial Projections......................................................................... 11
Cost of Sales ................................................................................................................. 11
Management Salaries .................................................................................................... 11
Employee Benefits ........................................................................................................ 12
Direct Operating Expenses ........................................................................................... 12
Music & Entertainment................................................................................................. 13
Marketing...................................................................................................................... 13
Utilities.......................................................................................................................... 13
General & Administrative............................................................................................. 14
Repairs & Maintenance................................................................................................. 14
Occupancy Costs........................................................................................................... 15
Depreciation & Amortization ....................................................................................... 15
Annual Operating Projection - Detail ............................................................................... 16
Annual Operating Projection - Summary ......................................................................... 18
5 Year Operating & Investment Projections..................................................................... 19
Investment Assumptions............................................................................................... 19
Projected Investment Returns ....................................................................................... 20
Break-Even ....................................................................................................................... 22
Break-Even Worksheet ................................................................................................. 22
Break-Even P&L Summary ......................................................................................... 24

© 2005 RestaurantOwner.com. All rights reserved.
Page 1
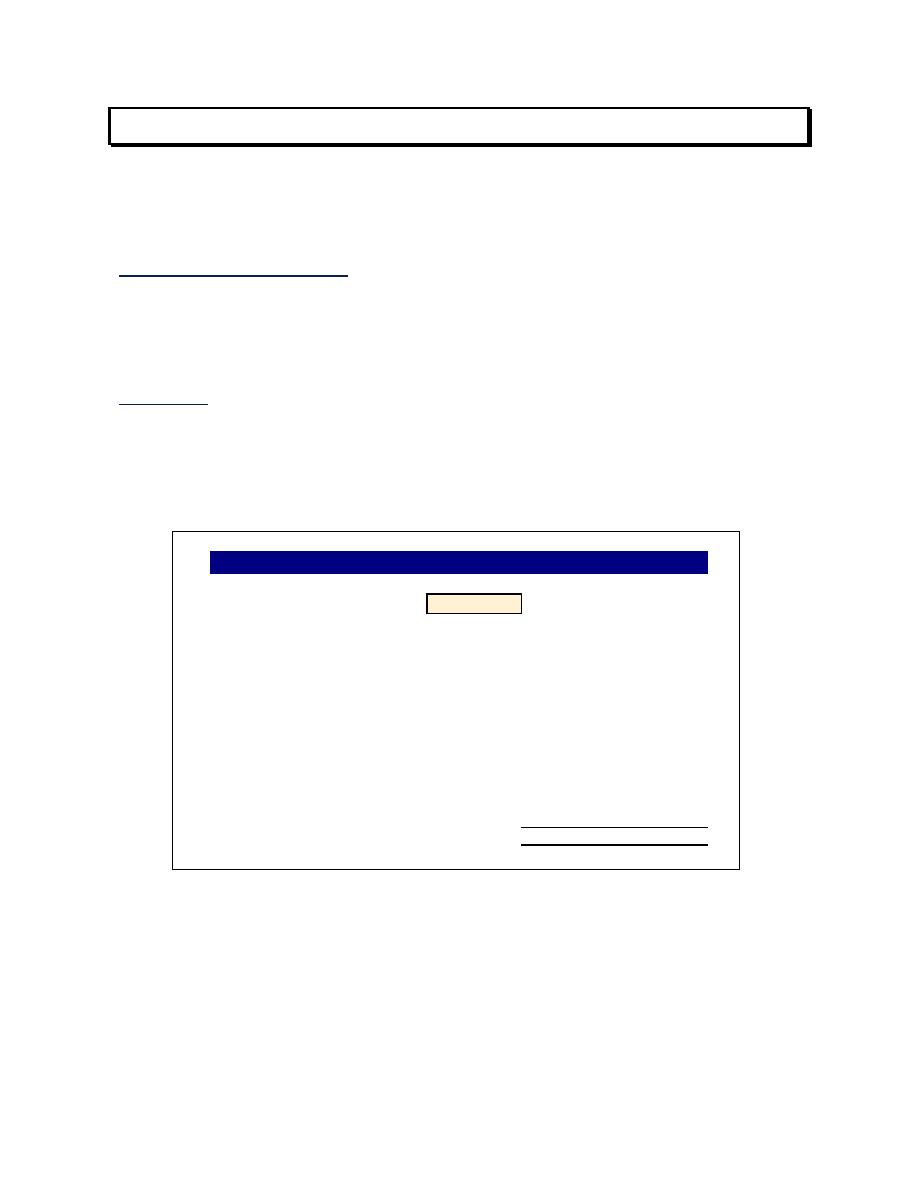
Introduction
For potential investors and lenders, the Financials are often viewed as the heart of the business plan
and this section is likely to receive a lot of attention and even scrutiny from potential lender and
investors. This is where they have the opportunity to evaluate the financial viability of the venture and
– all important – gain a sense of the risk and return on investment potential the venture is likely to
offer.
Some of the main concerns or issues any investor will want to learn from the Financials section
include:
• How much startup capital will the venture require and where it will come from.
• How profitable is the restaurant likely to be.
• What are the minimum sales required to break-even.
• When can the investor(s) expect to get their investment back.
• What kind of ROI is this investment likely to generate.
Even though you may have years of hospitality experience and are an expert at operating a restaurant,
lenders and investors want to know you understand the financial side of the business as well. Showing
a well-conceived, complete and understandable presentation of the financials enhances your credibility
and sends a message to investors and lenders that you are capable of not only running a restaurant but
also possess the knowledge and skills needed to build a successful business organization as well.
Even though you may not have a financial background, you’ll need to understand the numbers on the
various schedules and statements that make up the Financial Projections section and be prepared to
answer questions about the assumptions used to create them. Don’t be concerned or intimidated. As
you’ll soon see, gaining a good grasp of the Financials are basically common sense and we’ve
designed this section to be very straightforward and easy to understand. You, as well as those who
read your business plan, should quickly gain a clear picture of the financial aspects of your venture if
you follow this format.
The schedules and statements included in the financials section are:
• Projected Sources & Uses of Cash
• Capital Budget
• Sales Projection Worksheet
• Hourly Labor Projection Worksheet
• Annual Operating Projection – Detail
• Annual Operating Projection - Summary
• 5 Year Operating Projections
• Break-Even P&L Summary
Download the Financial Model Worksheets:
Download Restaurant Startup & Feasibility Model – Tableservice
Download Restaurant Startup & Feasibility Model – Quick Service
© 2005 RestaurantOwner.com. All rights reserved.
Page 2
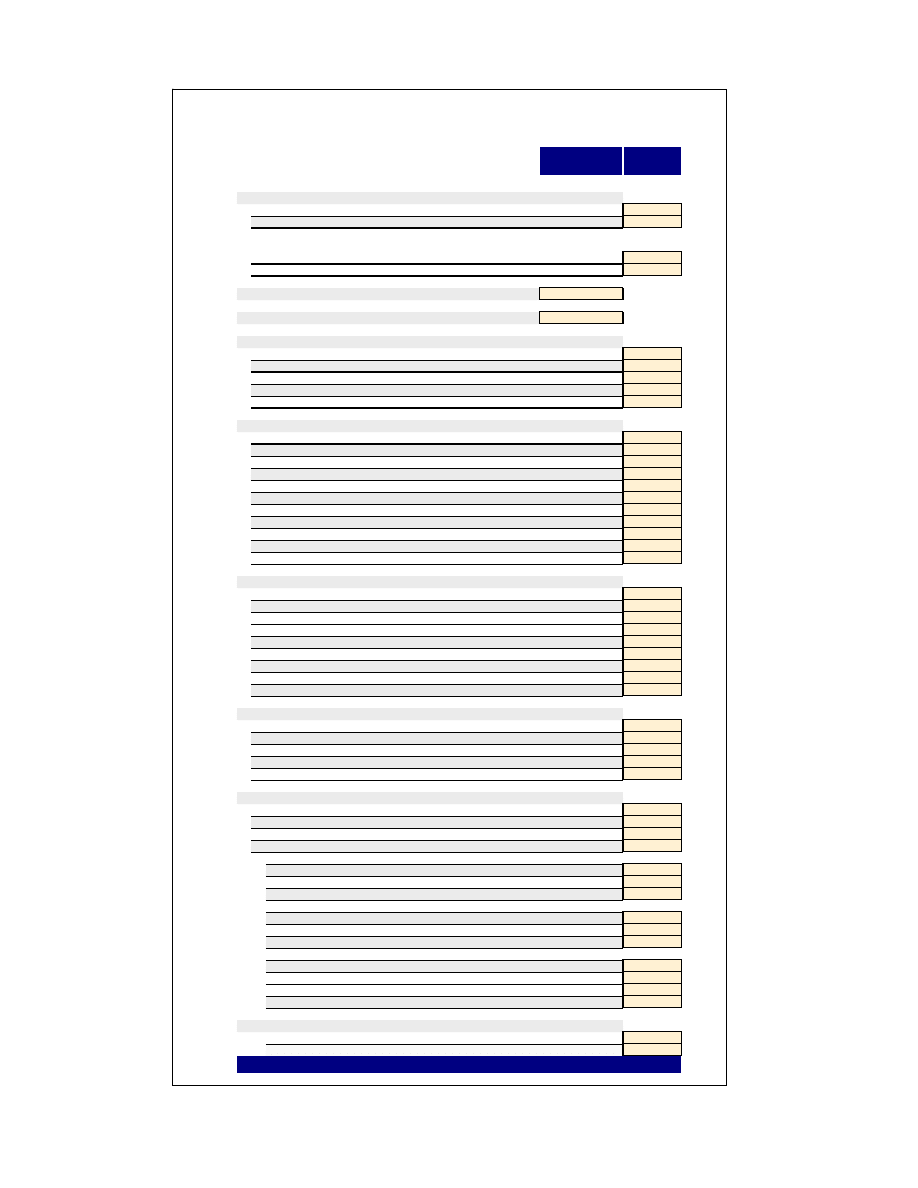
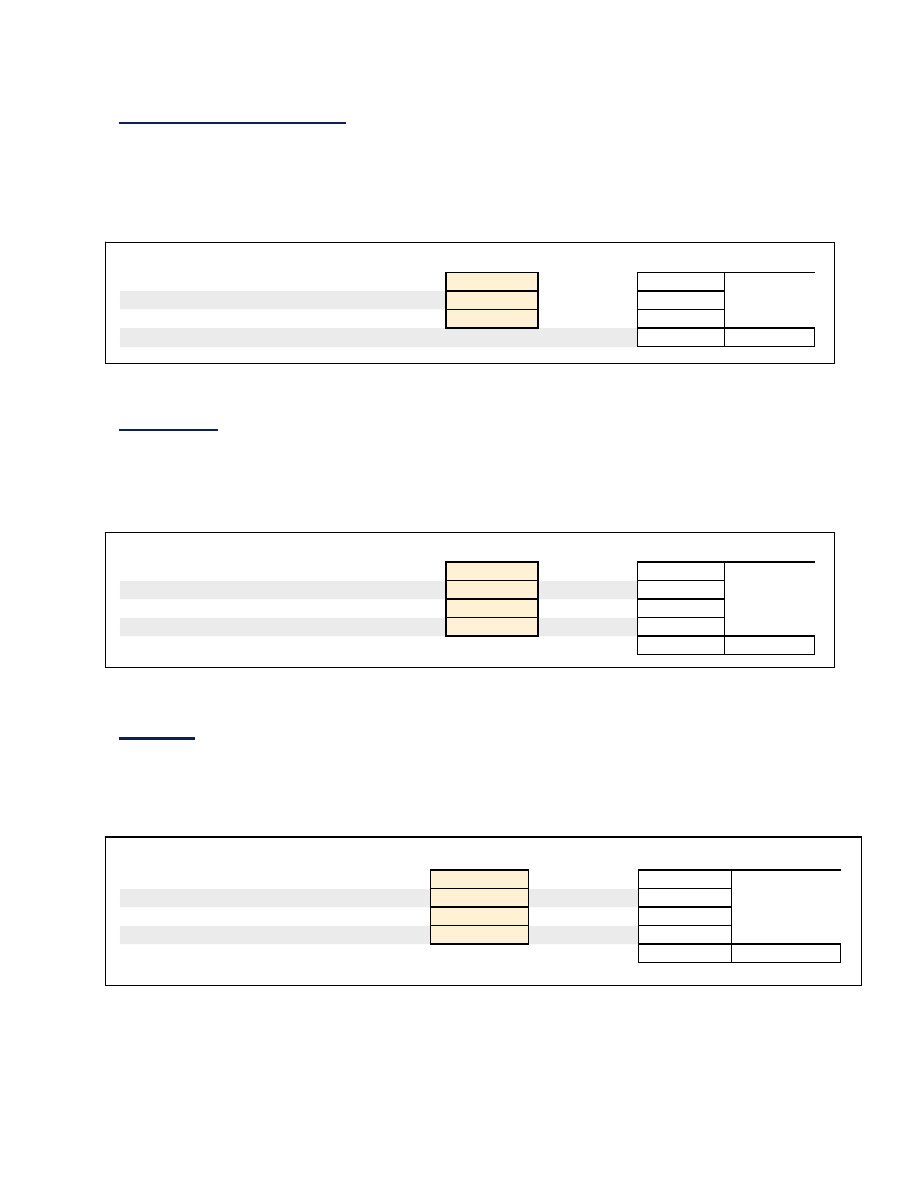
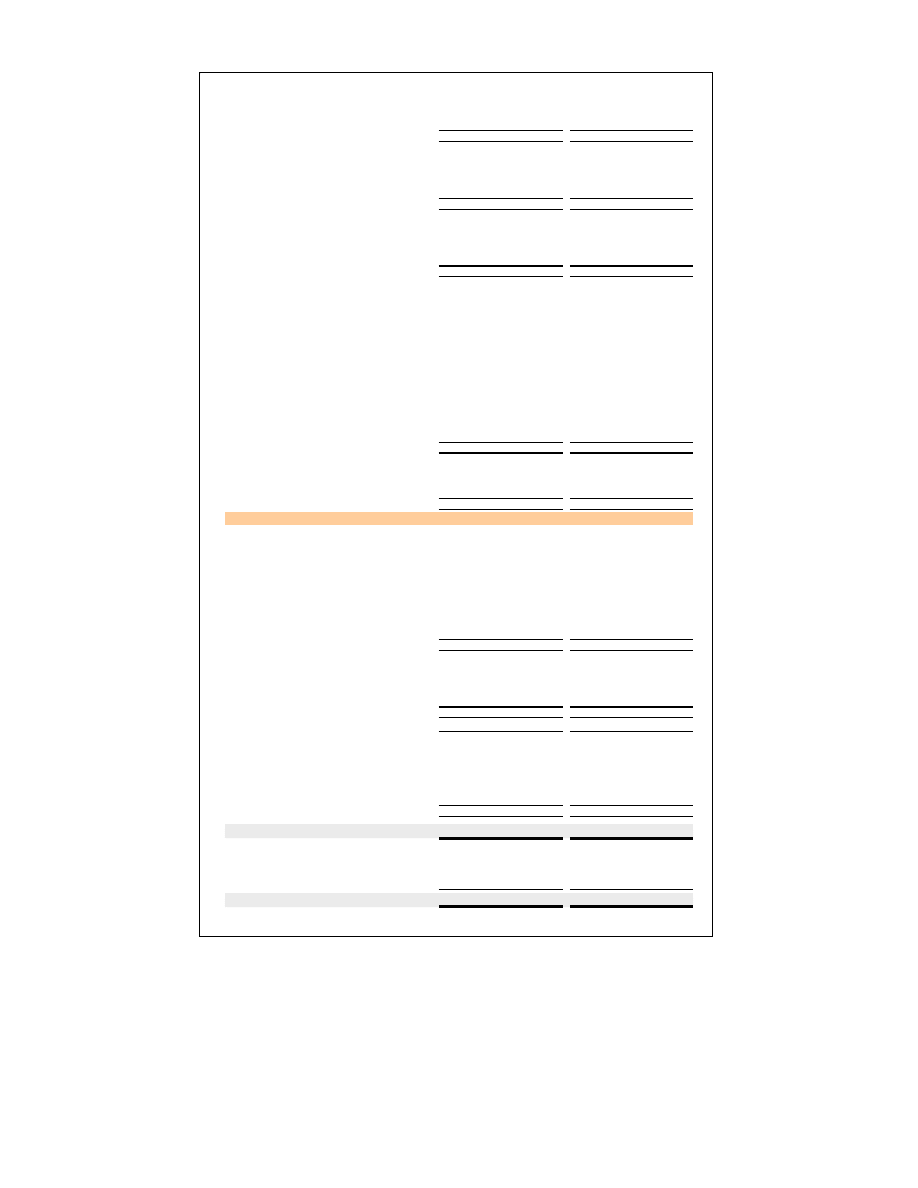
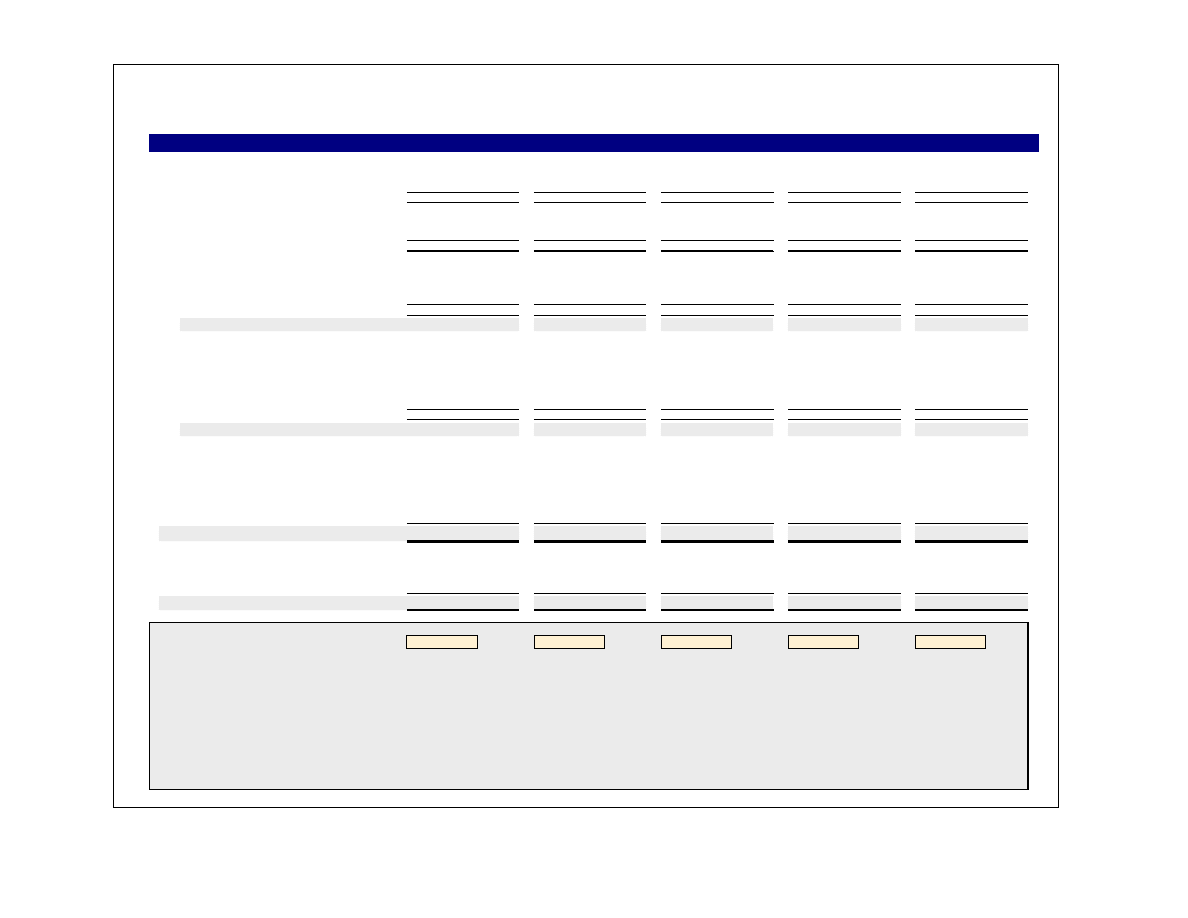
Projected Sources & Uses of Cash
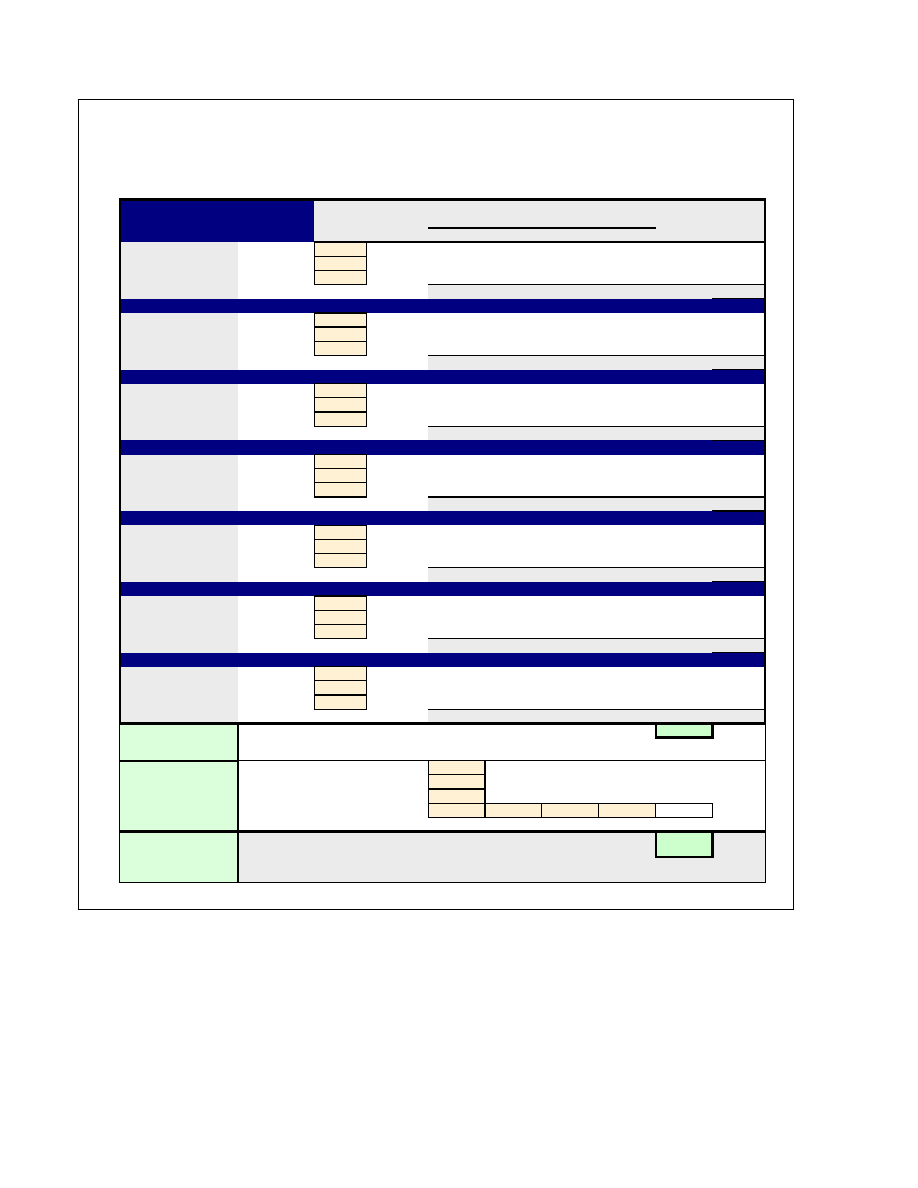
The Projected Sources & Uses of Cash shows the total amount of funding required to finance
the startup and opening of the restaurant, where the funds are expect to come from and how
these funds will be spent.
This numbers on this worksheet are generated automatically from information entered on
other supporting worksheets.
SOURCES OF CASH:
Equity Contributions
$ 400,000
Loan Financing
677,675
TOTAL SOURCES OF CASH
$ 1,077,675
USES OF CASH:
Land & Building
0
Leasehold Improvements
400,000
Bar / Kitchen Equipment
175,000
Bar / Dining Room Furniture
75,000
Professional Services
19,500
Organizational & Development
34,475
Interior Finishes & Equipment
66,500
Exterior Finishes & Equipment
48,500
Pre-Opening Expenses
108,700
Working Capital & Contingency
150,000
TOTAL USES OF CASH
$ 1,077,675
Blue Water LLC
Projected Sources & Uses of Cash
Development & Startup Period

© 2005 RestaurantOwner.com. All rights reserved.
Page 3
Capital Budget
The Capital Budget is a detailed schedule showing all the various expenditures, construction,
startup and pre-opening costs required to get the restaurant open for business. Adequately
identifying and estimating the costs of the project at this stage is absolutely crucial. Many
restaurant experts claim the number one reason for restaurant failure is undercapitalization,
i.e. running out of startup capital before operating activities have a chance to generate an
adequate cash flow to sustain the business. Don’t place your restaurant (and future) in
jeopardy by not having enough capital to complete your project according to plan or start out
in a big financial hole.
Here are the major categories of the Capital Budget (an example of a completed Capital
Budget is included on the page 5).
Land & Building
If the owner/operating entity is planning on owning the land and building (versus leasing a
facility), the actual or estimated cost of the land and building should be included here. Also
include any related acquisition costs such as closing costs, sales commissions, finder’s fees,
inspections, financing costs, etc.
Leasehold Improvements
In a leased facility, enter the estimated cost of constructing the leasehold improvements less
any landlord contributions. Leasehold improvements will include the cost of demolition (if
any), construction of walls, ceilings, electrical, plumbing, HVAC, fixtures, flooring and any
other hard costs associated with the interior and exterior structural and mechanical
components of the building. Also, enter any landlord allowance or contribution for the
construction of the leasehold improvements as this will reduce the eventual cost of the
leasehold improvements.
Bar/Kitchen Equipment
Based on your menu, prepare a detailed list of the bar and kitchen equipment you’ll need.
Obtain actual bids and be sure to consider the cost of delivery, installation and setup. If
possible, reference a detail of the bar and kitchen equipment and place it in the Appendix of
your business plan.
Bar/Dining Room Furniture
If possible, reference a detail of the Bar/Dining Room Furniture and place it in the Appendix.
Obtain actual bids and be sure to consider the cost of delivery, installation and setup.
Professional Services
This section i
ncludes architectural, engineering, design, legal, accounting and other
professionals and consultants whose services will be used. Obtain cost estimates from these
professions based on the scope of services you plan on having them perform.

© 2005 RestaurantOwner.com. All rights reserved.
Page 4
Organizational & Development
A variety of costs are placed in this category including deposits on utilities, sales tax and
lease, permits & licenses, menus and other similar costs. Obtain cost estimates from suppliers
or other authoritative sources.
Interior Finishes & Equipment
This section includes interior items such as kitchen smallwares, artwork, décor, sound system,
POS and other similar items. Obtain cost estimates from suppliers or other authoritative
sources.
Exterior Finishes & Equipment
Items such as landscaping, exterior sign, parking lot and other similar costs are included in
this category. Obtain cost estimates from suppliers or other authoritative sources.
Pre-Opening Expenses
Pre-opening expenses are standard restaurant operating expenses that are incurred prior to
opening. Included are costs such as food, beverage and supplies inventory needed for menu
development, training and opening as well as utilities, interest expense, uniforms, marketing
and payroll costs of management and staff.
It’s common to hire the chef or other management personnel from 1 to 2 months before
opening, depending on the need for their involvement in the development and startup
activities. Hourly staff normally begins training 1 to 2 weeks before opening.
Working Capital & Contingency
Very few restaurants are profitable during the first few months of operation. Some restaurants
that are quite successful today took a year or more to reach profitability. Some provision
should be made in the Capital Budget for working capital to cover possible operating deficits
after opening. Although it happens, don’t count on your restaurant starting out making a profit
in the first month of operation. Be financially prepared if profitability takes several months to
achieve.
It is also important to have a contingency built into the Capital Budget for change orders and
cost overruns. There will always be surprises and unplanned costs when opening a restaurant.
Cover yourself by having a contingency equal to at least 5% to 10% of the total project cost.
(See sample Capital Budget on next page).
© 2005 RestaurantOwner.com. All rights reserved.
Page 5
Detail
0
Land
Building - Construction / Contractor Fees
LEASEHOLD IMPROVEMENTS
200,000
Const ruct ion Cont ract
300,000
Landlord Cont ribut ion
(100,000)
BAR / KITCHEN EQUIPMENT
125,000
BAR / DINING ROOM FURNITURE
32,500
PROFESSIONAL SERVICES
19,500
Architect & Engineering
7,500
Legal (lease & incorporation)
5,000
Project Consultant
2,500
Accounting & Tax
2,000
Name, Logo & Graphic Design
2,500
ORGANIZATIONAL & DEVELOPMENT
34,475
Deposits (utilities, sales tax, etc.)
3,000
Insurance Binder (property, casualty, liability)
4,225
Workers Comp. Binder
1,500
Liquor License
5,500
Building Permits
2,500
Other Licenses & Permits
1,500
Utility Deposits (gas, electric, water)
3,000
Change, Operating Banks & Petty Cash
1,000
Menus / Menu Boards
3,750
Lease Deposit
5,000
Travel, Research, Concept Development
3,500
INTERIOR FINISHES & EQUIPMENT
66,500
Kitchen Smallwares
12,000
Artwork & Specialty Décor
10,000
Security System
3,000
Music/Sound/Audio-Visual Systems
12,500
Cash Register / Point of Sale
20,000
Phone System
4,500
Office Equipment / Computer
2,500
Office Supplies
500
Interior Signs
1,500
EXTERIOR FINISHES & EQUIPMENT
48,500
Landscaping
12,000
Exterior Signs & Decorations
15,000
Resurfacing
15,000
Parking Bumpers
4,000
Parking Lot Striping
2,500
PRE-OPENING EXPENSES
108,700
Construction Period Utilities
4,000
Construction Period Building Lease
7,500
Construction Period Interest
2,500
Uniforms
1,200
Opening Inventories -
Food
10,000
Beer, Liquor & Wine
15,000
Paper & Other Supplies
5,000
Marketing -
Advertising
7,500
Public Relations
10,000
Opening Parties
7,000
Management & Chef
15,000
Hourly Employees
15,000
Payroll Taxes & Employee Beneifts
3,000
Payroll Taxes
6,000
WORKING CAPITAL & CONTINGENCY
130,525
Working Capital
75,000
Contingency
55,525
TOTAL PROJECT COST
$ 765,700
Personnel -
Blue Water LLC
Capital Budget
TOTAL COST
LAND & BUILDING
© 2005 RestaurantOwner.com. All rights reserved.
Page 6
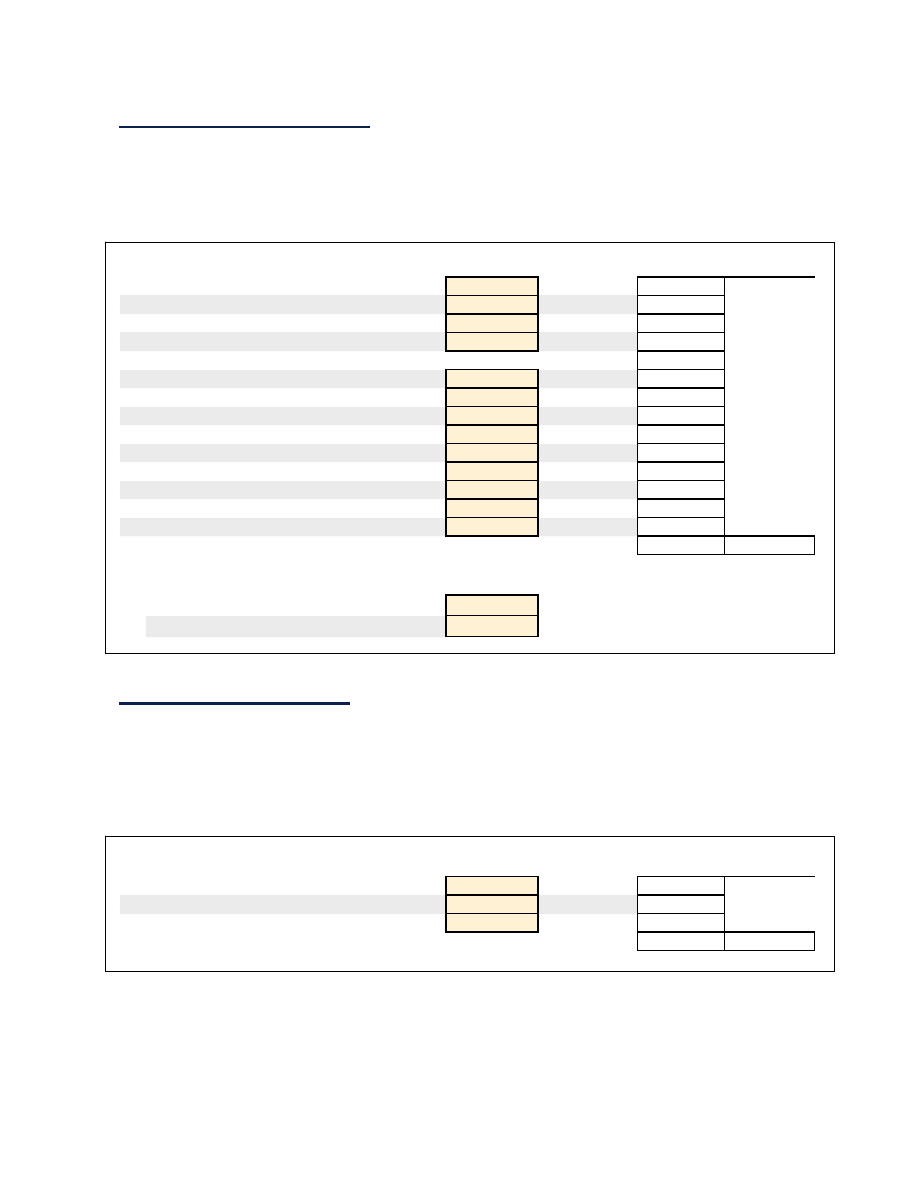
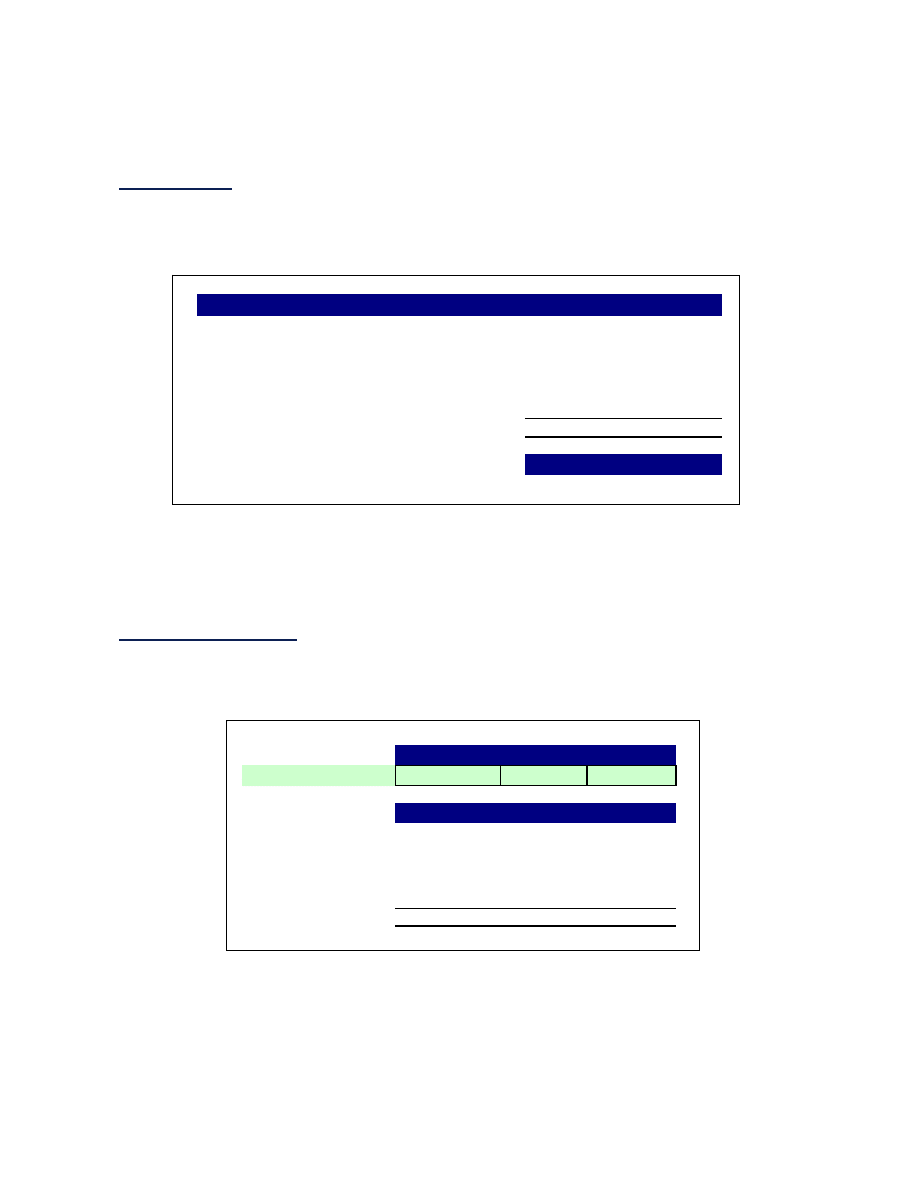
Sales Projection
Projecting a realistic and achievable sales volume is at the heart of every restaurant business
plan. Nearly all of the restaurant’s expenses, as well as the profit, cash flow and return on
investment are driven primarily by sales volume.
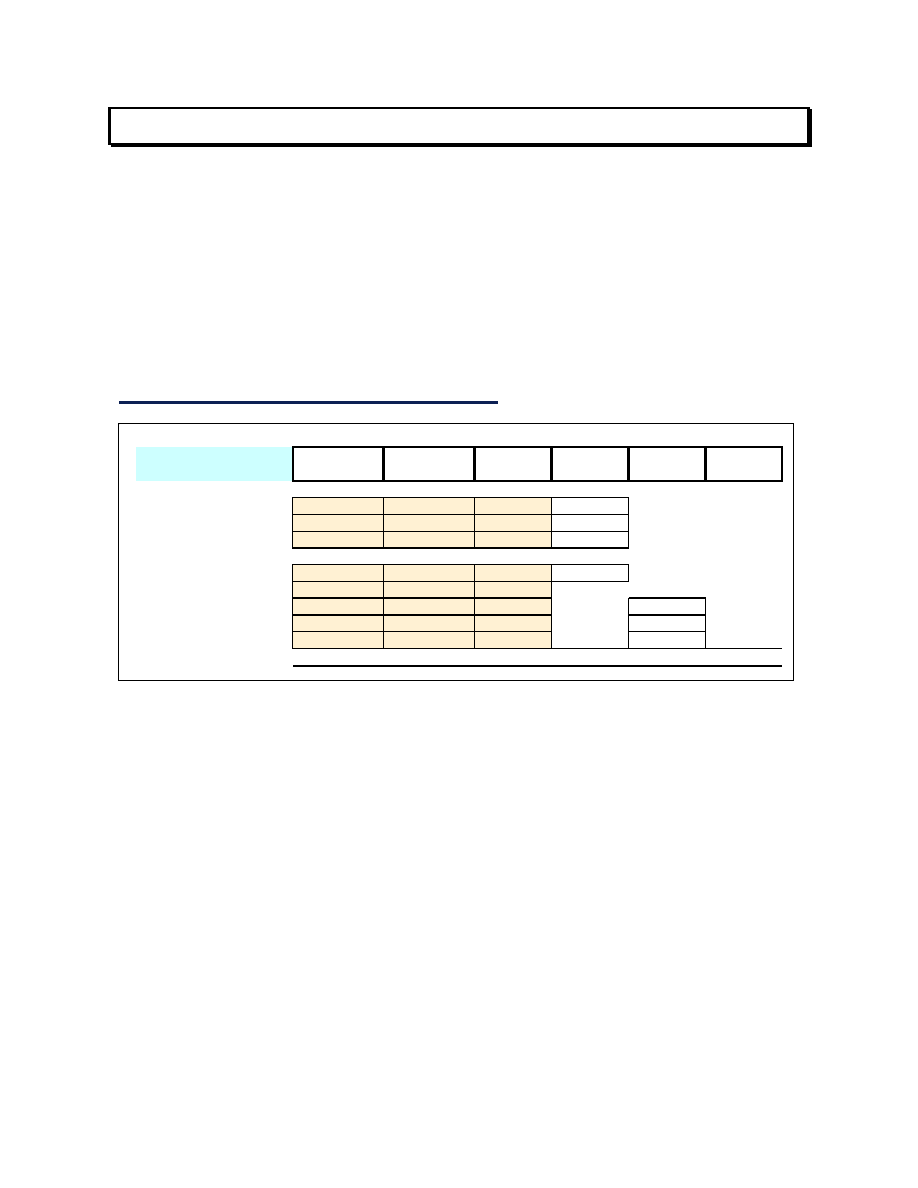
To estimate sales volume in a to-be-developed restaurant, both the average check per guest
and guest counts by meal period should be objectively analyzed and projected. The following
schedule from the “Sales Projection” tab in the Financial Projections may help you come up
with a realistic average check.
Estimating Average Check (per guest)
Food -
Entrée
10.50
100%
1.0
10.50
Appetizer
6.00
20%
1.0
1.20
Dessert
4.00
20%
1.0
0.80
Beverages -
Non-Alcoholic
1.00
20%
1.0
0.20
Tap Water
0.00
20%
1.0
Liquor
4.50
10%
1.5
0.68
Beer
3.25
20%
1.5
0.98
Wine
4.50
30%
2.0
2.70
TOTALS
100%
12.70
4.35
17.05
Ave CK
Ave. CK
Food
Ave CK
Bev
Ave. Price
Point
% Ordered
# of Orders
Dinner
In the above case, for the dinner meal period, the average price of an entrée is assumed to be
$10.50 and every customer (100%) will order one. The average price of an appetizer is $5.00
with 20% of the guests ordering one.
Average beverage sales per guest are arrived at by estimating the average selling price of each
beverage type, assuming what percent of guests will select each type and how many drinks
the average guest will order. For example, the average liquor drink is priced at $4.50, 10% of
the quests will order a liquor drink and the average number ordered will be 1.5.
In the above example, the average check at dinner for this restaurant is estimated to be $17.05,
$12.70 in food and $4.35 in beverages.
© 2005 RestaurantOwner.com. All rights reserved.
Page 7
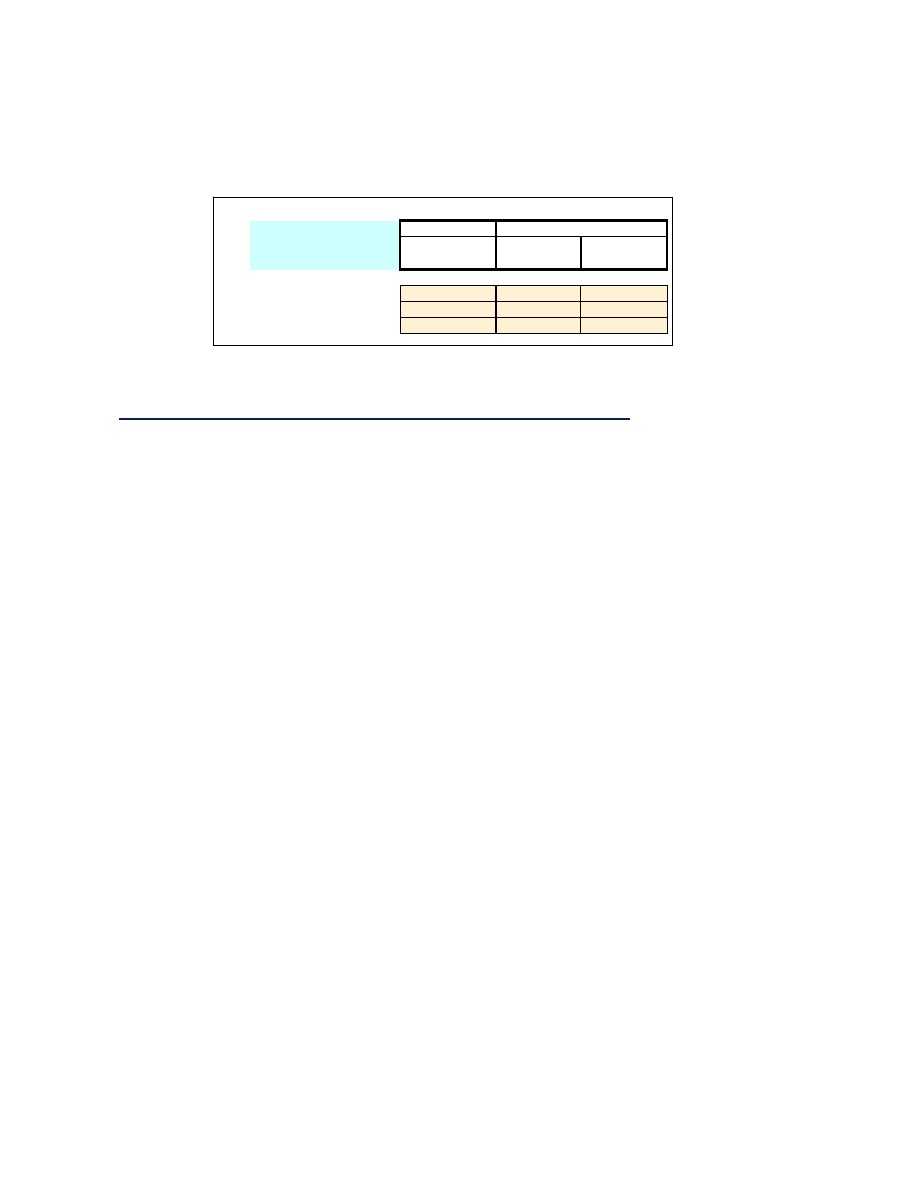
If you are using the
QSR version
enter your estimated check average (per person average -
PPA) for counter sales and drive-thru sales for each meal period. Also, make an assumption
regarding how many people will be served in an average vehicle going through the drive-thru
window.
Counter
PPA
PPA
Ave # of
Occupants
Breakfast
3.00
2.75
1.2
Lunch
5.50
5.25
2.2
Dinner
6.00
5.75
2.5
Meal Period
Drive-Thru
Estimating Guest/Customer Counts By Meal Period
In most restaurants the number of guests served can vary dramatically by meal period and day of the
week. For example, many restaurants do as much as 50% or more of their weekly sales on Friday and
Saturday. This makes it important to consider expected guest activity for every meal period in a
typical week.
To get a sense of the level of business that can be expected it helps to become very familiar with the
level of customer activity existing restaurants are experiencing in the immediate market area. Count
cars in the parking lot and going through the drive-thru. Spend some time in these restaurants and
through observation and casual discussions with employees and even managers, inquire about their
busy and slow times. Ask about how many table turns they do and the number of customers they serve
on different days of the week. Are sales trending higher than last year or are they slower than they
were last year? If you’re tactful and friendly it’s often amazing what information they’ll share.
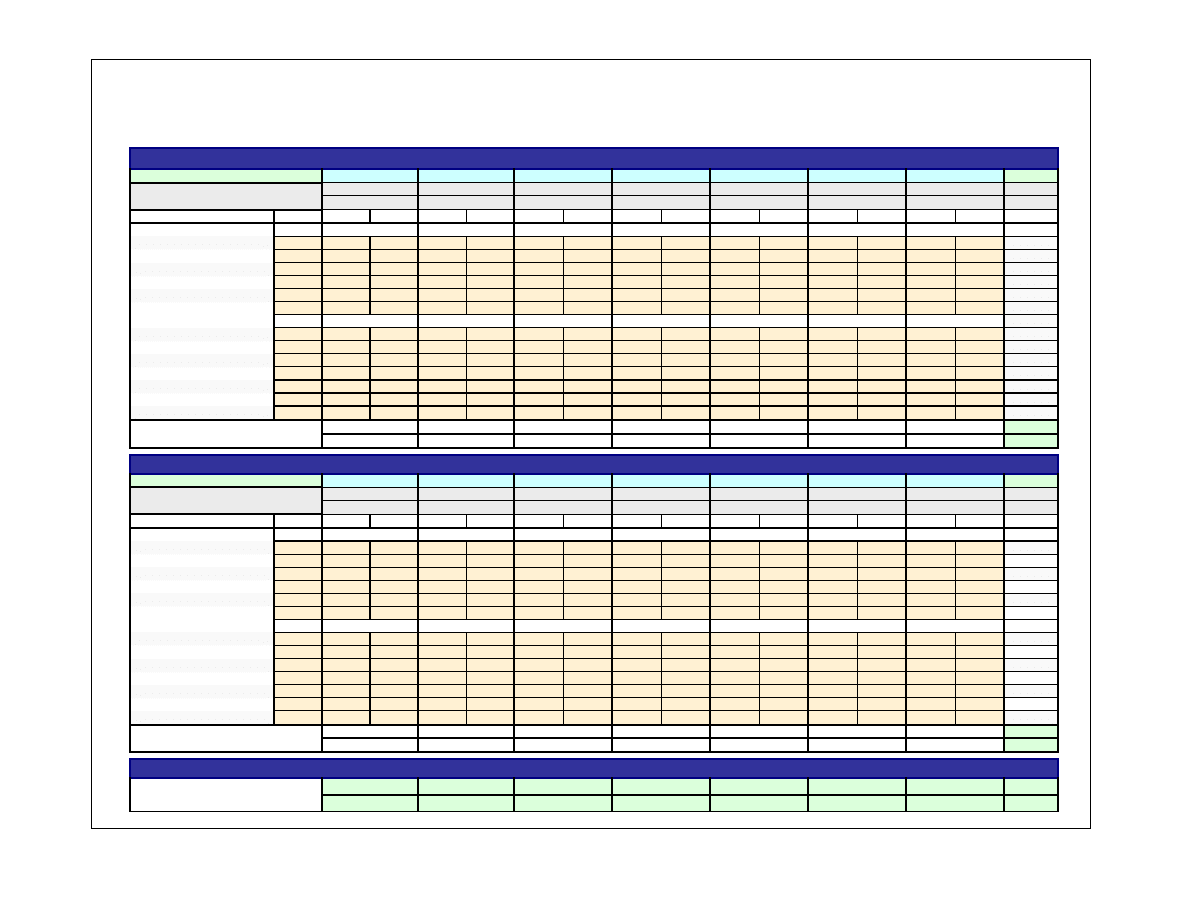
On the following page is the Sales Projection Worksheet. For a typical week, enter the
expected table turns for each meal period. The worksheet will automatically calculate the
number of guests and sales per meal period, day and week based on the average check
assumptions you entered on the bottom of this worksheet page. These numbers become the
basis for sales volume on the operating statements.
© 2005 RestaurantOwner.com. All rights reserved.
Page 8
Number of Seats
150
Table
% of
Turns
Covers
Food
Liquor
Beer
Wine
Total
Week
Breakfast
0.0
0
0
0
0
0
0
Lunch
0.7
105
874
47
68
142
1,131
Dinner
1.0
150
1,905
101
146
405
2,558
Day Totals
2,779
149
215
547
3,689
9.0%
Breakfast
0.0
0
0
0
0
0
0
Lunch
0.8
120
999
54
78
162
1,293
Dinner
1.1
165
2,096
111
161
446
2,813
Day Totals
3,095
165
239
608
4,106
10.0%
Breakfast
0.0
0
0
0
0
0
0
Lunch
0.9
135
1,124
61
88
182
1,455
Dinner
1.2
180
2,286
122
176
486
3,069
Day Totals
3,410
182
263
668
4,524
11.0%
Breakfast
0.0
0
0
0
0
0
0
Lunch
1.0
150
1,249
68
98
203
1,616
Dinner
1.5
225
2,858
152
219
608
3,836
Day Totals
4,106
219
317
810
5,453
13.2%
Breakfast
0.0
0
0
0
0
0
0
Lunch
1.2
180
1,499
81
117
243
1,940
Dinner
2.0
300
3,810
203
293
810
5,115
Day Totals
5,309
284
410
1,053
7,055
17.1%
Breakfast
0.0
0
0
0
0
0
0
Lunch
1.5
225
1,873
101
146
304
2,424
Dinner
2.5
375
4,763
253
366
1,013
6,394
Day Totals
6,636
354
512
1,316
8,818
21.4%
Breakfast
0.0
0
0
0
0
0
0
Lunch
1.5
225
1,873
101
146
304
2,424
Dinner
2.0
300
3,810
203
293
810
5,115
Day Totals
5,683
304
439
1,114
7,539
18.3%
31,017
1,657
2,394
6,116
41,183
75.3%
4.0%
5.8%
14.8%
100.0%
1.5
75
$20.00
80%
10%
3%
7%
100%
1,800
225
68
158
2,250
32,817
1,882
2,461
6,273
43,433
75.6%
4.3%
5.7%
14.4%
100.0%
Blue Water LLC
Sales Projection Worksheet - Typical Week
Per Person Average $
Sales Mix %
Special Events
(banquets, parties,
catering)
Special Event Sales Per Week
Totals in $
Sales Mix %
Ave. # of Banquets, Parties/ Week
Sales Mix %
WEEK TOTALS -
All Sales
Totals in $
Ave. # of Guests
Monday
Thursday
Tuesday
Wednesday
Friday
Saturday
Sunday
WEEK TOTALS
(restaurant only)
Daily Sales By Category
If you have a banquet room or plan on providing catering services, you can project average
weekly sales from these types of Special Events in this worksheet as well. Just enter the
average number of these types of events per week, number of guests per event and the average
$ charge per person. Also, estimate the sales mix on special event sales by indicating the
percent that will be from food, liquor, beer and wine sales. Labor cost on Special events is
estimated on the Hourly Payroll Worksheet.

© 2005 RestaurantOwner.com. All rights reserved.
Page 9
Hourly Labor Cost Projection
Hourly labor cost is one of the largest expenses in any restaurant. Don’t just assume that your
hourly labor cost will be XX% of sales just because of what other restaurants are doing. There
are many variables that effect hourly labor and they can be different even in what may appear
to be very similar operations. Take the time to project your labor cost by position for each
meal period in a typical week based on the level of business activity you actually expect.
The Hourly Labor Projection Worksheet allows you to list and assign average hourly wage
rates to each position in the kitchen and dining room. Then, while taking into consideration
each meal period’s covers (number of meals served) and sales volume, estimate the hours and
number of employees needed in each position to adequately staff the restaurant.
As a general rule for tableservice restaurants, the goal is to keep hourly labor (gross payroll)
at or below 18%-20% of sales. Hourly labor cost on busy nights can be as low as 11%-12% of
sales, whereas on slow nights, it can be as high 22%-25%. The goal for the week, however, in
most cases would be to shoot for an hourly labor cost of 18% or less.
Similarly in QSR restaurants, the goal in most instances would be to keep hourly labor cost
below 18%.
If you have a banquet room or plan on providing catering services, there is also an area at the
bottom of the Hourly Labor Projection worksheet to estimate the labor cost associated with
Special Event and Catering functions.
© 2005 RestaurantOwner.com. All rights reserved.
Page 10
- EARLY -
WEEK
1,140
$12,284
Position
Rate
Hours
#
Hours
#
Hours
#
Hours
#
Hours
#
Hours
#
Hours
#
Labor $
Kitchen -
Dishroom
$ 6.00
6.0
1
6.0
1
6.0
1
6.0
1
6.0
1
6.0
1
6.0
1
252
Prep Cooks
$ 7.50
8.0
1
8.0
1
8.0
1
8.0
1
8.0
1
8.0
1
8.0
1
420
Line Cooks
$ 8.00
8.0
1
8.0
1
8.0
1
8.0
1
8.0
1
8.0
1
8.0
1
448
Expo
$ 10.00
8.0
1
8.0
1
8.0
1
8.0
1
8.0
1
8.0
1
8.0
1
560
Other
$ 0.00
0.0
0
0.0
0
0.0
0
0.0
0
0.0
0
0.0
0
0.0
0
0
Other
$ 0.00
0.0
0
0.0
0
0.0
0
0.0
0
0.0
0
0.0
0
0.0
0
0
Dining Room -
Servers
$ 2.18
5.0
3
5.0
3
5.0
3
5.0
4
5.0
5
5.0
5
5.0
5
305
Host / Hostess
$ 6.00
4.0
1
4.0
1
4.0
1
4.0
1
4.0
1
4.0
1
4.0
1
168
Bussers
$ 6.00
6.0
1
6.0
1
6.0
1
6.0
1
6.0
1
6.0
1
6.0
1
252
Bartenders
$ 3.50
4.0
1
4.0
1
4.0
1
4.0
1
4.0
1
4.0
1
4.0
1
98
Cashiers
$ 0.00
0.0
0
0.0
0
0.0
0
0.0
0
0.0
0
0.0
0
0.0
0
0
Other
$ 0.00
0.0
0
0.0
0
0.0
0
0.0
0
0.0
0
0.0
0
0.0
0
0
Other
$ 0.00
0.0
0
0.0
0
0.0
0
0.0
0
0.0
0
0.0
0
0.0
0
0
Labor Cost Per Shift - $
2,503
Labor Cost Per Shift - %
20.4%
- LATE -
WEEK
1,695
$28,900
Position
Rate
Hours
#
Hours
#
Hours
#
Hours
#
Hours
#
Hours
#
Hours
#
Labor $
Kitchen -
Dishroom
$ 6.00
6.0
1
6.0
1
6.0
2
6.0
2
6.0
2
6.0
2
6.0
1
396
Prep Cooks
$ 7.50
8.0
2
8.0
2
8.0
2
8.0
2
8.0
2
8.0
2
8.0
2
840
Line Cooks
$ 8.00
8.0
2
8.0
2
8.0
2
8.0
2
10.0
2
10.0
2
8.0
2
960
Expo
$ 10.00
8.0
1
8.0
1
8.0
1
8.0
1
8.0
1
8.0
1
8.0
1
560
Other
$ 0.00
0.0
0
0.0
0
0.0
0
0.0
0
0.0
0
0.0
0
0.0
0
0
Other
$ 0.00
0.0
0
0.0
0
0.0
0
0.0
0
0.0
0
0.0
0
0.0
0
0
Dining Room -
Servers
$ 2.18
5.0
4
5.0
5
5.0
6
5.0
6
5.0
8
5.0
9
5.0
8
501
Host / Hostess
$ 6.00
4.0
1
4.0
1
6.0
2
6.0
2
7.0
2
7.0
2
7.0
1
402
Bussers
$ 6.00
6.0
1
6.0
2
6.0
2
6.0
3
6.0
3
8.0
3
8.0
2
636
Bartenders
$ 3.50
6.0
1
6.0
1
7.0
2
7.0
2
8.0
2
8.0
2
8.0
1
280
Cashiers
$ 0.00
0.0
0
0.0
0
0.0
0
0.0
0
0.0
0
0.0
0
0.0
0
0
Other
$ 0.00
0.0
0
0.0
0
0.0
0
0.0
0
0.0
0
0.0
0
0.0
0
0
Other
$ 0.00
0.0
0
0.0
0
0.0
0
0.0
0
0.0
0
0.0
0
0.0
0
0
Labor Cost Per Shift - $
4,575
Labor Cost Per Shift - %
15.8%
- DAY / WEEK TOTALS - RESTAURANT LABOR -
Hourly Labor - $
7,079
Hourly Labor Cost - %
17.2%
(breakfast & lunch)
Covers
Total Restaurant Sales
Covers
Total Restaurant Sales
(dinner only)
150
Monday
19.3%
Projection of Hourly Labor Cost
16.1%
13.4%
13.1%
1,005
1,052
22.6%
Blue Water LLC
1,136
1,183
986
767
814
617
19.1%
835
882
21.5%
22.2%
12.1%
489
536
658
694
21.5%
18.1%
15.0%
12.7%
19.0%
300
375
225
300
$2,558
$2,813
$3,069
$3,836
$5,115
$6,394
$5,115
165
180
369
15.2%
Tuesday
Wednesday
Thursday
Friday
Saturday
Sunday
369
19.0%
30.6%
347
26.8%
369
15.2%
347
23.8%
358
22.1%
Sunday
225
$1,131
$1,293
$1,455
$1,616
$1,940
$2,424
$2,424
150
Friday
180
Saturday
225
Thursday
105
Tuesday
120
Wednesday
135
Monday
347
© 2005 RestaurantOwner.com. All rights reserved.
Page 11
Assumptions to the Financial Projections
On the assumptions page enter the estimates of the remaining operating costs and expenses.
While some industry average guidelines are included, we highly recommend you consider
purchasing the National Restaurant Association’s Industry Operations Report as a way to
further “reality check” your numbers as compared with industry averages. Go to
NRA Industry Operations Report
for more information.
Following are the major cost and expense categories included on the Assumptions worksheet -
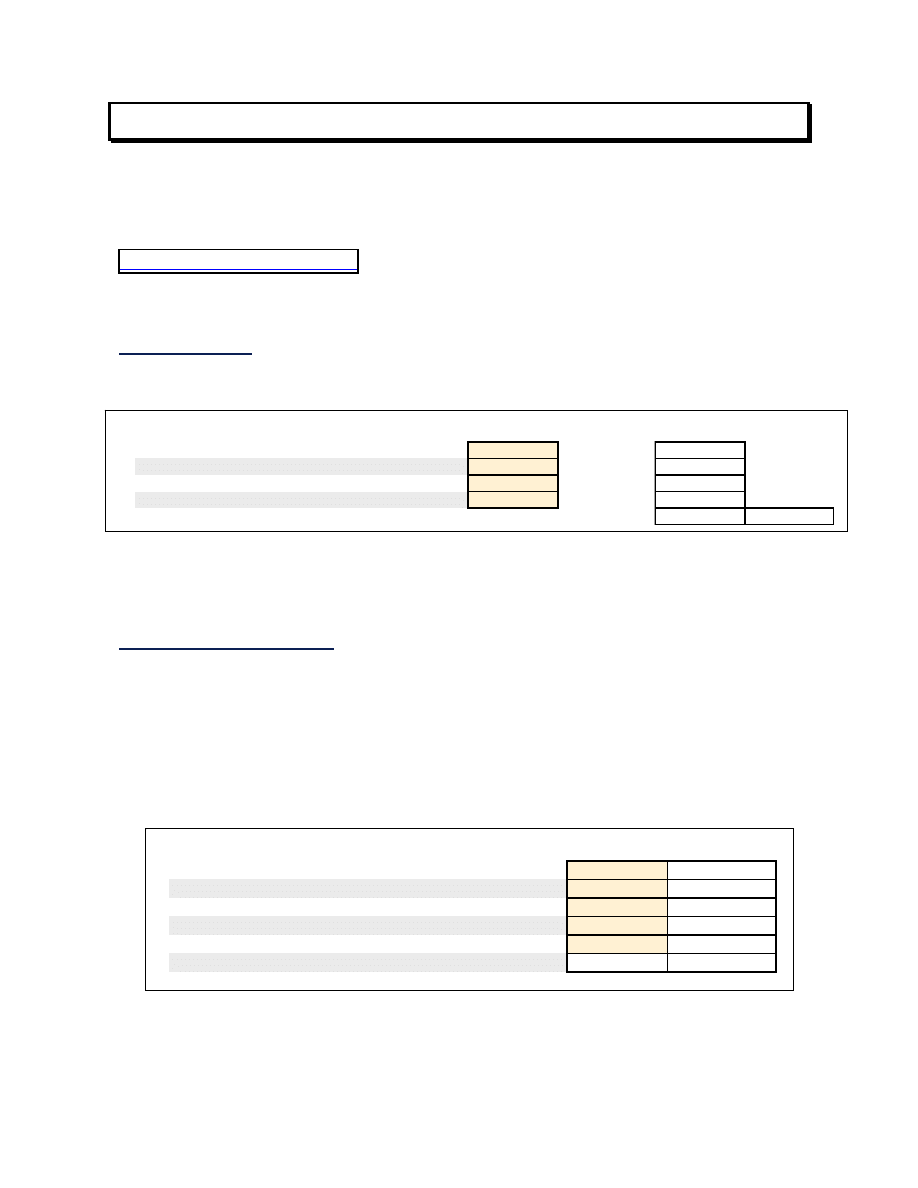
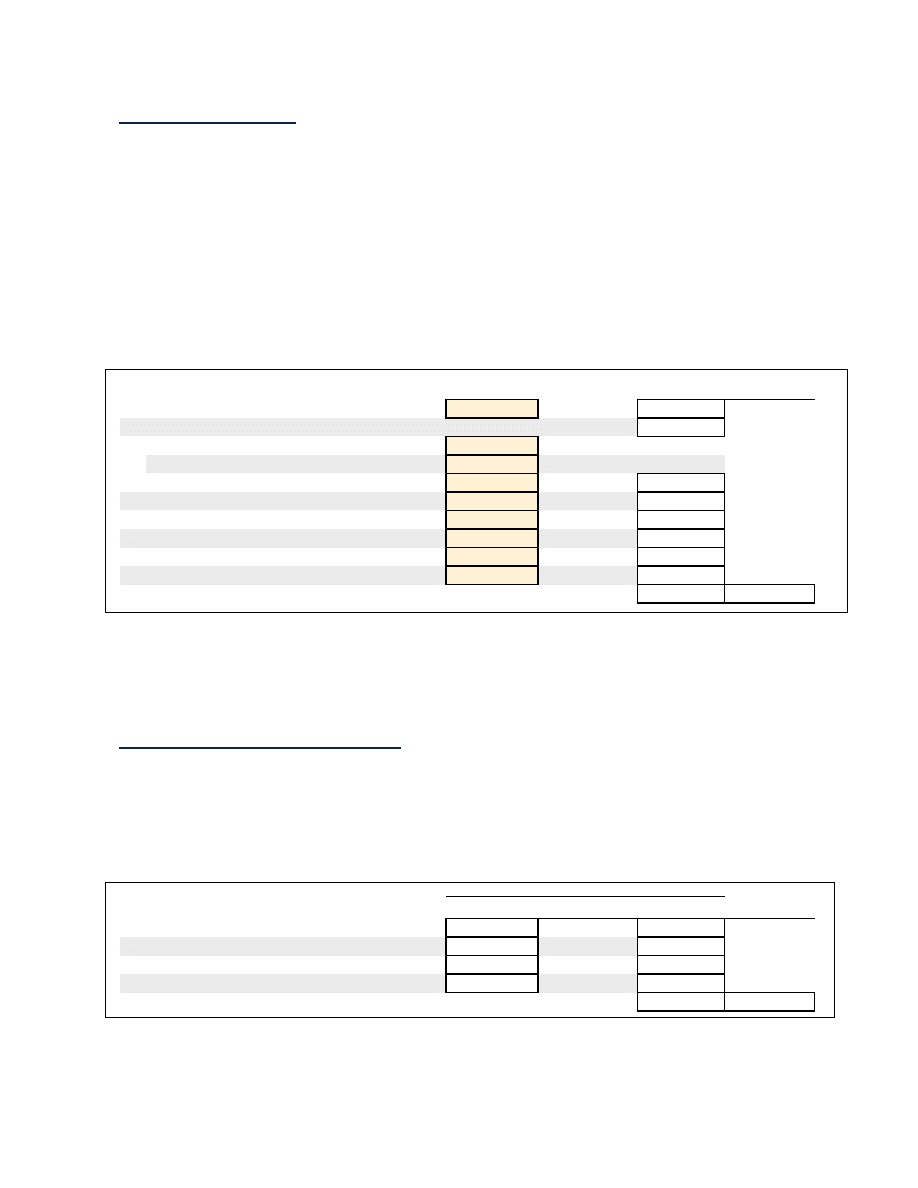
Cost of Sales
Estimate cost of sales as a percentage of the corresponding sales category.
Cost of Sales
Annual $
% of Sales
Food Cost %
32.0% of food sales
546,075
Liquor Cost %
20.0% of liquor sales
19,574
Beer Cost %
22.0% of beer sales
28,155
Wine Cost %
35.0% of wine sales
114,169
Total Cost of Sales
707,973
31.3%
In
QSR restaurants
, Paper Cost is included in Cost of Sales. It’s common for paper cost to
run 3% to 4% of total sales.
Management Salaries
As a general rule management salaries should not exceed 10% of sales. A GM’s salary often
runs between 3%-4% of gross annual sales. If you’re the owner/operator and you’re also
running the restaurant, you can, of course, pay yourself what you want. For purposes of the
business plan however, it would probably be prudent to keep your compensation within the
3%-4% of sales range. Your compensation should not become a contentious issue to your
lender or potential investors or detract from presenting the profit potential of the restaurant in
the best possible light.
Management Salaries (Annual)
% of Sales
1. General Manager
70,000
3.1%
2. Chef/Kitchen Manager
55,000
2.4%
3. Assistant Manager
40,000
1.8%
4. Assistant Manager
35,000
1.5%
5. Other
0
0.0%
Total Management Salaries
200,000
8.9%
© 2005 RestaurantOwner.com. All rights reserved.
Page 12
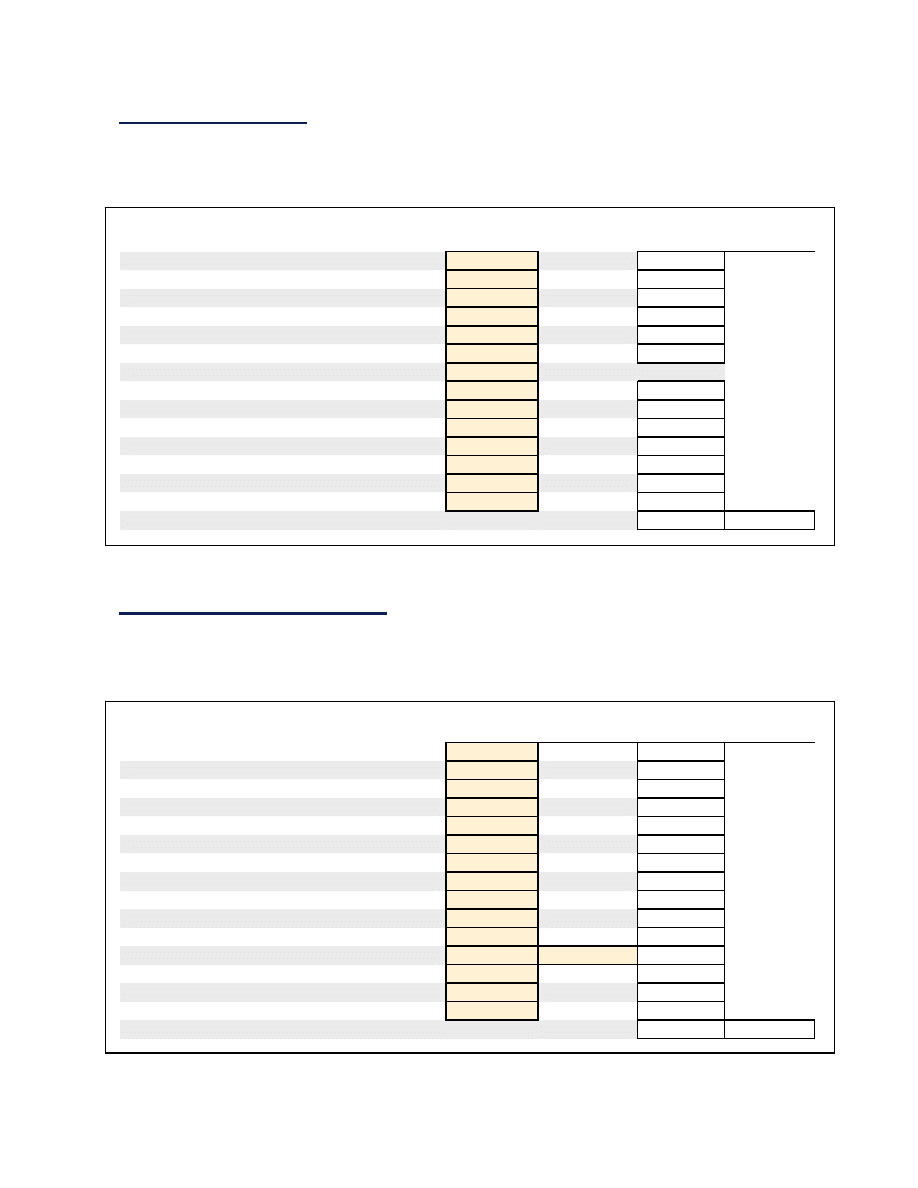
Employee Benefits
Employee benefits include the employer’s portion of payroll taxes, worker’s comp., medical
and other employee insurance premiums as well as other employee-related expenses.
Employee benefits often run 5%-6% of gross sales and 20%-23% of gross payroll.
Employee Benefits
Monthly $
Annual $
% of Sales
1.
8.00%
46,745
2.
1.50%
8,765
3.
0.80%
4,674
4. Other Payroll Taxes-as a % of Gross P/R
0.00%
0
5. Worker's Comp. - as a % of Gross P/R
6.0%
35,059
6. Group Medical Ins.-cost per employee
350
21,000
7. Group Medical Ins.-# of employees covered
5
8. Disability & Life Insurance
300
3,600
9. 401k Plan - per month
0
0
10. Employee Meals - per month
750
9,000
11. Employee Education - per month
0
0
12. Awards & Prizes - per month
150
1,800
13. Employee Christmas & Other Parties
200
2,400
14. Transportation & Housing
0
0
Total Employee Benefits
133,043
5.9%
FICA Taxes - as a % of Gross Payroll
State Unemployment-as a % of Gross P/R
Federal Unemployment-as a % of Gross P/R
Direct Operating Expenses
Direct operating expenses usually run 4%-6% of gross sales. Paper supplies can be entered as
an estimated dollar cost per month or as a % of food sales. In QSR restaurants, Paper is
considered part of Cost of Sales.
Monthly $
% of Sales
Annual $
% of Sales
1. Auto Expense
300
3,600
2. Catering & Banquet Supplies
200
2,400
3. Cleaning Supplies
600
7,200
4. Contract Cleaning
750
9,000
5. Extermination
600
7,200
6. Flowers & Decorations
500
6,000
7. Kitchen Utensils
600
7,200
8. Laundry & Linen
750
9,000
9. Licenses & Permits
400
4,800
10. Menus & Wine Lists
300
3,600
11. Miscellaneous
500
6,000
12. Paper Supplies
0
1.50%
25,597
13. Security System
250
3,000
14. Tableware & Smallwares
600
7,200
15. Uniforms
200
2,400
Total Direct Operating Expenses
104,197
4.6%
Direct Operating Expenses
© 2005 RestaurantOwner.com. All rights reserved.
Page 13
Music & Entertainment
Depending on the specific concept and the type of music and entertainment utilized, expenses
in this category can vary significantly. According to industry averages, music and
entertainment costs run from an almost negligible amount to as much as 2%-3% of sales when
live entertainment is employed on a regular basis.
Music & Entertainment -
Monthly $
Annual $
% of Sales
1. Musicians
0
0
2. Musak & Sound System
250
3,000
3. Other
0
0
Total Music & Entertainment
3,000
0.1%
Marketing
Marketing includes expenses associated with promotions, advertising and marketing programs
and materials. Industry averages show that many independent restaurants spend between 2%-
4% of sales on marketing related items. The cost of discounts on promotions and coupon sales
are normally charged to Marketing.
Marketing -
Monthly $
Annual $
% of Sales
1. Selling & Promotions
2,000
24,000
2. Advertising
1,000
12,000
3. Printed Materials
0
0
4. Research
250
3,000
Total Marketing
39,000
1.7%
Utilities
The cost of utilities can vary widely depending primarily on the location, local utility rates
and prevailing climate conditions. Many restaurants report spending between 2%-4% of sales
and from $4-$9 per square foot per year on utilities.
Utilities -
Monthly $
Annual $
% of Sales
1. Electricity
2,500
30,000
2. Gas
800
9,600
3. Water
700
8,400
4. Trash Removal
250
3,000
Total Utilities
51,000
2.3%
© 2005 RestaurantOwner.com. All rights reserved.
Page 14
General & Administrative
It is common for G&A to run 3%-6% of sales. One big component and factor in this category
is the use of credit cards by your customers. On the Assumptions page in the Financial Model,
use the cells referenced below to factor the % of sales tendered on credit cards (as opposed to
cash) and the average discount amount.
General & Administrative -
Monthly $
Annual $
% of Sales
1. Accounting Services
1,200
14,400
2. Bank Charges
50
600
3. Bank Deposit Services
500
6,000
4. Cash (Over) / Short
50
600
5. Credit Card Charges
44,041
6. Dues & Subscriptions
400
4,800
7. Miscellaneous
500
6,000
8. Office Supplies
200
2,400
9. Payroll Processing
200
2,400
10. Postage
250
3,000
11. Professional Fees
750
9,000
12. Protective Services
800
9,600
13. Telephone
600
7,200
14. Training Materials
550
6,600
Total General & Administrative
116,641
5.2%
Credit Card Charges:
Percentage of Credit Card Sales
75.0%
Average Discount Percentage
2.6%
Repairs & Maintenance
R&M includes repairs and ongoing maintenance of equipment, building components and
landscaping as well as the cost of equipment maintenance contracts. Restaurants in a new
facility with new equipment should have below average repair and maintenance expenses for
the first few years at least. As an industry average, R&M runs from 1%-2.5% in most
restaurants.
Repairs & Maintenance
Monthly $
Annual $
% of Sales
1. Building Repairs & Maint.
500
6,000
2. Equipment Repairs & Maint.
700
8,400
3. Grounds, Landscaping & Parking Lot
600
7,200
Total Repairs & Maintenance
21,600
1.0%
© 2005 RestaurantOwner.com. All rights reserved.
Page 15
Occupancy Costs
Occupancy Costs includes primarily fixed expenses associated with the facility housing the
restaurant. Kitchen equipment lease payments (if any), should also be included in Occupancy
Costs. A good rule of thumb is to keep Occupancy Costs at or below 10% of sales. It is often
very difficult to generate an adequate profit and return on investment when Occupancy Costs
exceed 10% of sales. As a general rule, rent should not exceed 6% of sales.
In most restaurants, occupancy costs run $12-$22 per square foot. However, in many urban,
particularly upscale, locations, occupancy costs can run much higher. Still, the 10% rule of
thumb would hold. Our advice would be to not venture into any location that you’re not
confident the restaurant will generate at least 10 times the total occupancy costs in annual
sales.
Occupancy Costs:
Monthly $
Annual $
% of Sales
1. Base (minimum) Rent
8,000
96,000
2. Percentage Rent -
27,512
Percentage amount
6.0%
On annual sales above
1,800,000
3. Common Area Maintenance (CAM)
500
6,000
4. Equipment Rental
1,000
12,000
5. Real Estate Taxes
2,000
24,000
6. Personal Property Taxes
500
6,000
7. Insurance on Building & Contents
1,500
18,000
8. Liquor Liability
600
7,200
Total Occupancy Costs
196,712
8.7%
It is extremely important to accurately estimate Occupancy Costs for the business plan
projections. Get at least 2 estimates from competent professionals in the real estate and
insurance industries to assist you in estimating the real estate (ad valorem) taxes and
insurance costs. You can’t afford surprises in this area.
Depreciation & Amortization
Depreciation & amortization are non-cash expenses and represent the arbitrary write-off or
expense allocation of capitalized assets like equipment, furniture & fixtures and pre-opening
or startup expenses. Depreciation & Amortization is based on your capital costs as per the
Capital Budget worksheet and your accountant’s recommended method of depreciation. We
used the straight-line method for depreciating the asset classes listed below.
Basis
Period
Per Year
% of Sales
1. Building
0
30 years
0
2. Leasehold Improvements
327,525
39.5 years
8,292
3. Furniture & Equipment
212,000
7 years
30,286
4. Pre-Opening Costs
133,450
5 years
26,690
Total Depreciation & Amortization
65,267
2.9%
Depreciation & Amortization:
In the operating projections we recommend adding Depreciation & Amortization back to Net
Income (and subtracting loan principal payments) to arrive at the amount of Cash Flow
generated by the restaurant each year.
© 2005 RestaurantOwner.com. All rights reserved.
Page 16
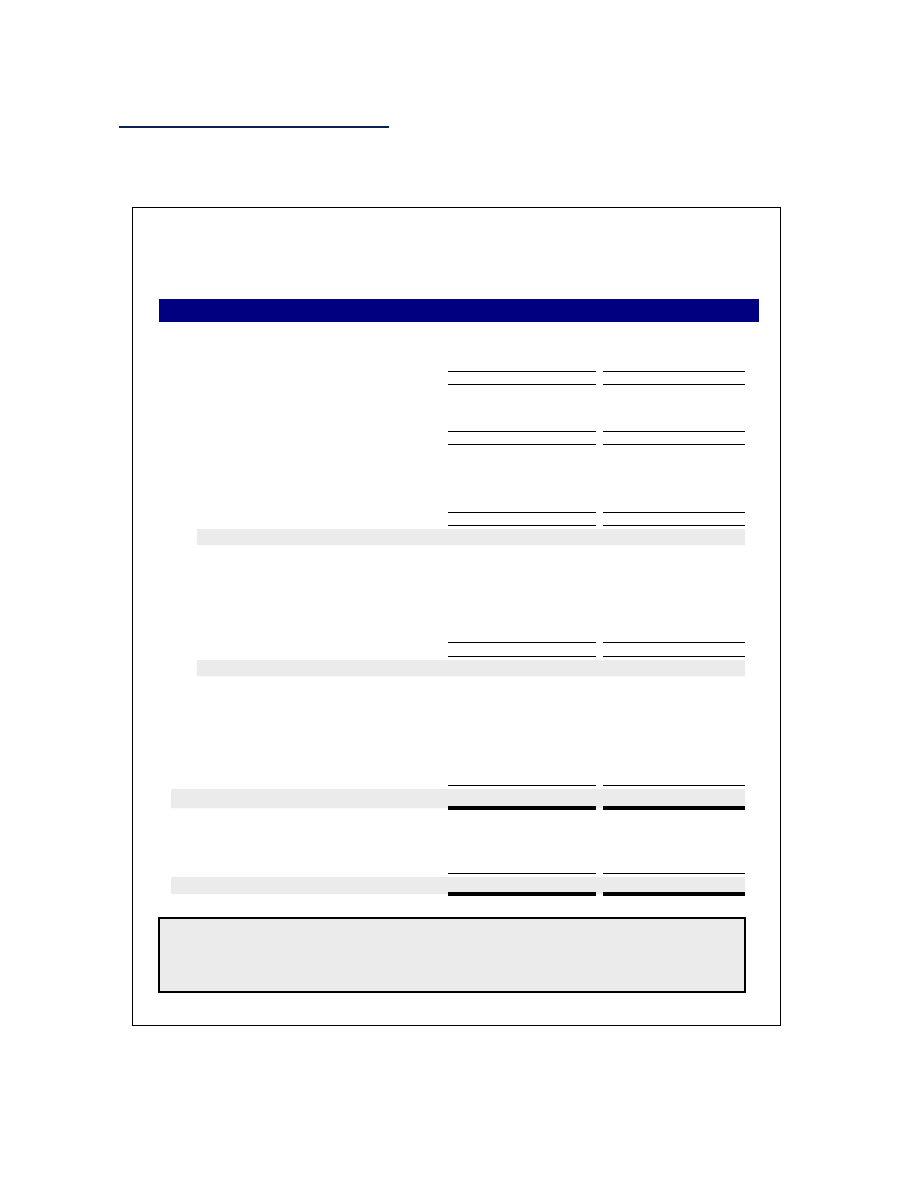
Annual Operating Projection - Detail
The Detailed Operating Projection is automatically generated from the Sales Projection,
Hourly Labor Projection and Operating Assumptions worksheets. This statement shows the
results of a typical month by dividing the annual projection by 12.
You may want to delete line items which have a -0- balance, such as Catering & Banquet
Expenses if this is not applicable to your situation.
The key ratios on this statement are PRIME COST and CONTROLLABLE PROFIT and of
course NET INCOME BEFORE TAXES. In a tableservice restaurant, the goal is to have a
prime cost of 65% or less. In a QSR restaurant, it’s about 60% or less. Controllable Profit
should be at least 15% with a goal of hitting 20% or more. The National Restaurant
Association has claimed for years that the average independent restaurant has a Net Income
Before Taxes of around 5% of sales. However, there are many independent restaurants that do
much better than what this “average” would suggest.
Sales:
Food
$ 142,207
75.6%
$ 1,706,484
75.6%
Liquor
8,156
4.3%
97,871
4.3%
Beer
10,665
5.7%
127,979
5.7%
Wine
27,183
14.4%
326,196
14.4%
TOTAL SALES
188,211
100.0%
2,258,529
100.0%
Cost of Sales:
Food
45,506
32.0%
546,075
32.0%
Liquor
1,468
18.0%
17,617
18.0%
Beer
2,346
22.0%
28,155
22.0%
Wine
8,699
32.0%
104,383
32.0%
TOTAL COST OF SALES
58,019
30.8%
696,230
30.8%
Gross Profit
130,192
69.2%
1,562,299
69.2%
Payroll:
Salaries & Wages -
Management
16,667
8.9%
200,000
8.9%
Hourly Employees
32,026
17.0%
384,311
17.0%
Total Salaries & Wages
48,693
25.9%
584,311
25.9%
Employee Benefits -
Payroll Taxes - Mgt. Incentive
5,015
2.7%
60,184
2.7%
Worker's Comp.
2,922
1.6%
35,059
1.6%
Group Medical Insurance
1,750
0.9%
21,000
0.9%
Other
1,400
0.7%
16,800
0.7%
Total Employee Benefits
11,087
5.9%
133,043
5.9%
TOTAL PAYROLL
59,779
31.8%
717,354
31.8%
PRIME COST
117,799
62.6%
1,413,583
62.6%
Other Controllable Expenses:
Direct Operating Expenses
Auto Expense
300
0.2%
3,600
0.2%
Catering & Banquet Expenses
200
0.1%
2,400
0.1%
Cleaning Supplies
600
0.3%
7,200
0.3%
Contract Cleaning
750
0.4%
9,000
0.4%
Extermination
600
0.3%
7,200
0.3%
Flowers & Decorations
500
0.3%
6,000
0.3%
Kitchen Utensils
600
0.3%
7,200
0.3%
Laundry & Linen
750
0.4%
9,000
0.4%
Licenses & Permits
400
0.2%
4,800
0.2%
Menus & Wine Lists
300
0.2%
3,600
0.2%
Miscellaneous
500
0.3%
6,000
0.3%
Paper Supplies
2,133
1.1%
25,597
1.1%
Security System
250
0.1%
3,000
0.1%
Tableware & Smallwares
600
0.3%
7,200
0.3%
Uniforms
200
0.1%
2,400
0.1%
Total Direct Operating Expenses
8,683
4.6%
104,197
4.6%
Annual Operating Projection - Detail
Blue Water LLC
MONTHLY AVE
ANNUAL
First Full Year of Operations
© 2005 RestaurantOwner.com. All rights reserved.
Page 17
Music & Entertainment -
Musicians
0
0.0%
0
0.0%
Musak & Sound System
250
0.1%
3,000
0.1%
Other
0
0.0%
0
0.0%
Total Music & Entertainment
250
0.1%
3,000
0.1%
Marketing -
Selling & Promotions
2,000
1.1%
24,000
1.1%
Advertising
1,000
0.5%
12,000
0.5%
Printed Materials
0
0.0%
0
0.0%
Research
250
0.1%
3,000
0.1%
Total Marketing
3,000
1.6%
36,000
1.6%
Utilities -
Electrical
2,500
1.3%
30,000
1.3%
Gas
800
0.4%
9,600
0.4%
Water
700
0.4%
8,400
0.4%
Trash Removal
50
0.0%
600
0.0%
Total Utilities
4,050
2.2%
48,600
2.2%
General & Administrative -
Accounting Services
1,200
0.6%
14,400
0.6%
Bank Charges
50
0.0%
600
0.0%
Bank Deposit Services
500
0.3%
6,000
0.3%
Cash (Over) / Short
50
0.0%
600
0.0%
Credit Card Charges
3,670
2.0%
44,041
2.0%
Dues & Subscriptions
400
0.2%
4,800
0.2%
Miscellaneous
500
0.3%
6,000
0.3%
Office Supplies
200
0.1%
2,400
0.1%
Payroll Processing
200
0.1%
2,400
0.1%
Postage
250
0.1%
3,000
0.1%
Legal & Professional Fees
750
0.4%
9,000
0.4%
Protective Services
800
0.4%
9,600
0.4%
Telephone
600
0.3%
7,200
0.3%
Training Costs
550
0.3%
6,600
0.3%
Total General & Administrative
9,720
5.2%
116,641
5.2%
Repairs & Maintenance -
Building Repairs & Maint.
500
0.3%
6,000
0.3%
Equipment Repairs & Maint.
700
0.4%
8,400
0.4%
Grounds, Landscaping & Parking Lot
600
0.3%
7,200
0.3%
Total Repairs & Maintenance
1,800
1.0%
21,600
1.0%
CONTROLLABLE PROFIT
42,909
22.8%
514,907
22.8%
Occupancy Costs & Depreciation
Occupancy Costs -
Rent & Common Area Maintenance
8,000
4.3%
96,000
4.3%
Percentage Rent
2,293
1.2%
27,512
1.2%
Common Area Maintenance (CAM)
500
0.3%
6,000
0.3%
Equipment Rental
1,000
0.5%
12,000
0.5%
Real Estate Taxes
2,000
1.1%
24,000
1.1%
Personal Property Taxes
500
0.3%
6,000
0.3%
Insurance on Building & Contents
1,500
0.8%
18,000
0.8%
Liquor Liability
600
0.3%
7,200
0.3%
Total Occupancy Costs
16,393
8.7%
196,712
8.7%
Depreciation & Amortization -
Building
0
0.0%
0
0.0%
Leasehold Improvements
1,154
0.6%
13,848
0.6%
Furniture & Equipment
3,625
1.9%
43,500
1.9%
Pre-Opening Costs
2,224
1.2%
26,690
1.2%
Total Depreciation
7,003
3.7%
84,038
3.7%
TOTAL OCCUPANCY & DEPREC.
23,396
12.4%
280,750
12.4%
Other (Income) Expense -
Vending & Telephone Commissions
(200)
(0.1%)
(2,400)
(0.1%)
Grease Sales
(100)
(0.1%)
(1,200)
(0.1%)
Misc Other Income
(100)
(0.1%)
(1,200)
(0.1%)
Interest
4,379
2.3%
52,547
2.3%
Misc Other Expense
200
0.1%
2,400
0.1%
Total Other (Income) Expense
4,179
2.2%
50,147
2.2%
NET INCOME BEFORE INCOME TAXES
$ 15,334
8.1%
$ 184,010
8.1%
ADD BACK:
Depreciation & Amortization
7,003
3.7%
84,038
3.7%
DEDUCT:
Loan Principal Payments
(3,843) (24.5%)
(46,117) (2.0%)
CASH FLOW BEFORE INCOME TAXES
$ 18,494
9.8%
$ 221,930
9.8%
© 2005 RestaurantOwner.com. All rights reserved.
Page 18
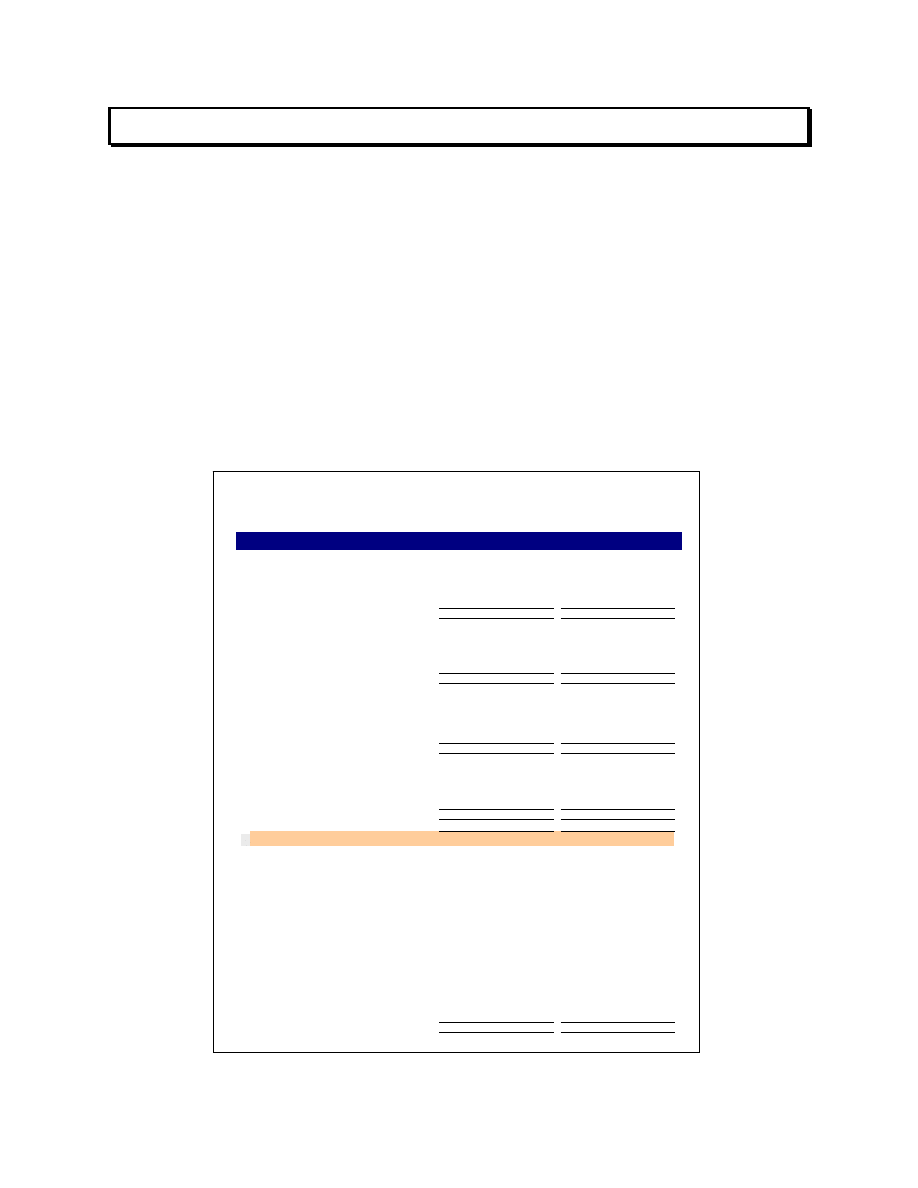
Annual Operating Projection - Summary
The Summary Operating Projection may be preferred over the Detailed Operating Projection
by some people who aren’t interested in all the details. It’s concise, easy to understand and
contains the key restaurant industry ratios most people will want to know. Refer to the
Assumptions, Sales Projection and Hourly Labor schedules if there are questions regarding
the numbers on the Summary Operating Projection and the Detailed Operating Projection.
Sales per square foot and per seat are important as they relate to industry averages and point
toward profit potential. In most instances where Occupancy Costs and other operating
expenses are in line with industry averages, restaurants that generate over $400 annual sales
per square foot and $10,000 annual sales per seat have the potential to generate at least
moderate profitability.
The sales to investment ratio is an important indicator of potential success or failure. The
higher the projected level of sales compared to the total startup costs (Capital Budget), the
greater potential the venture has for success. If the restaurant is leased, many restaurant
professionals believe the sales to investment ratio should be at least 1.5 to 1.0. See
“
How to Reduce the Risk of Opening a New Restaurant
” for more information .
Sales:
Food
$ 142,207
75.6%
$ 1,706,484
75.6%
Beverage
46,004
24.4%
552,045
24.4%
TOTAL SALES
188,211
100.0%
2,258,529 100.0%
Cost of Sales:
Food
45,506
32.0%
546,075
32.0%
Beverage
12,513
27.2%
150,155
27.2%
TOTAL COST OF SALES
58,019
30.8%
696,230
30.8%
Gross Profit
130,192
69.2%
1,562,299
69.2%
Payroll:
Salaries & Wages
48,693
25.9%
584,311
25.9%
Employee Benefits
11,087
5.9%
133,043
5.9%
TOTAL PAYROLL
59,779
31.8%
717,354
31.8%
PRIME COST
117,799
62.6%
1,413,583
62.6%
Other Controllable Expenses:
Direct Operating Expenses
8,683
4.6%
104,197
4.6%
Music & Entertainment
250
0.1%
3,000
0.1%
Marketing
3,000
1.6%
36,000
1.6%
Utilities
4,050
2.2%
48,600
2.2%
General & Administrative Expenses
9,720
5.2%
116,641
5.2%
Repairs & Maintenance
1,800
1.0%
21,600
1.0%
TOTAL OTHER CONTROLLABLE EXP.
27,503
14.6%
330,039
14.6%
CONTROLLABLE PROFIT
42,909
22.8%
514,907
22.8%
Occupancy Costs & Depreciation
Occupancy Costs
16,393
8.7%
196,712
8.7%
Depreciation & Amortization
7,003
3.7%
84,038
3.7%
Other (Income) Expenses
Other (Income)
(400)
(0.2%)
(4,800)
(0.2%)
Interest Expense
4,379
2.3%
52,547
2.3%
Other Expense
200
0.1%
2,400
0.1%
NET INCOME BEFORE INCOME TAXES
$ 15,334
8.1%
$ 184,010
8.1%
ADD BACK:
Depreciation & Amortization
7,003
3.7%
84,038
3.7%
DEDUCT:
Loan Principal Payments
(3,843)
(2.0%)
(46,117)
(2.0%)
CASH FLOW BEFORE INCOME TAXES
$ 18,494
9.8%
$ 221,930
9.8%
KEY RATIOS:
Sales Per Square Foot
$645
Sales Per Seat
$15,057
Sales to Investment
2.1
Annual Operating Projection - Summary
Blue Water LLC
MONTHLY AVE
ANNUAL
First Full Year of Operations
© 2005 RestaurantOwner.com. All rights reserved.
Page 19
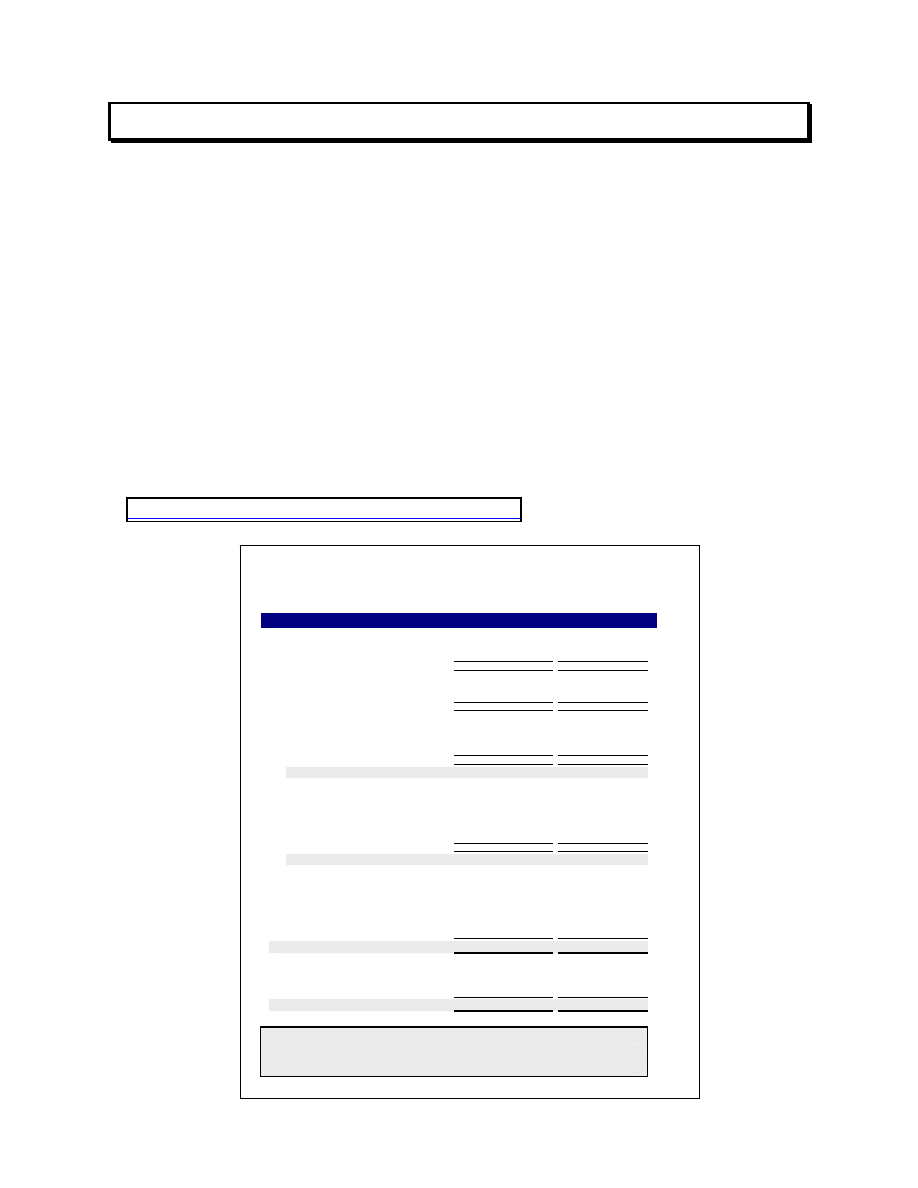
5 Year Operating & Investment Projections
The 5 Year Operating Projections begin in year one with the numbers from the Annual
Operating Projection – Summary discussed above. Years 2-5 are derived from the projected
changes in sales and expense levels of the prior year. On the bottom of the 5 Year Operating
Projections worksheet is the following table to enter your assumptions regarding year to year
changes in each Operating Projection line item.
OPERATING ASSUMPTIONS - Years 2 - 5
Sales - % Increase Over Prior Year
Food
4.0%
4.0%
4.0%
4.0%
Beverage
4.0%
4.0%
4.0%
4.0%
Cost of Sales - Cost as a % of Sales
Food
32.0%
32.0%
32.0%
32.0%
Beverage
27.2%
27.2%
27.2%
27.2%
Salaries & Wages - % Increase over Prior Year
Salaries & Wages
4.0%
4.0%
4.0%
4.0%
Employee Benefits
4.0%
4.0%
4.0%
4.0%
Other Expenses - % Increase over Prior Year
Direct Operating Expenses
3.0%
3.0%
3.0%
3.0%
Music & Entertainment
3.0%
3.0%
3.0%
3.0%
Marketing
3.0%
3.0%
3.0%
3.0%
Utilities
3.0%
3.0%
3.0%
3.0%
General & Administrative Expenses
3.0%
3.0%
3.0%
3.0%
Repairs & Maintenance
3.0%
3.0%
3.0%
3.0%
Occupancy Costs
2.0%
2.0%
2.0%
2.0%
Depreciation & Amortization (assumed to be constant in years 1-5)
Other (Income)
3.0%
3.0%
3.0%
3.0%
Interest Expense (from annual interest expense on loan amortization schedule on "Assumptions" page)
Other Expense
3.0%
3.0%
3.0%
3.0%
Loan Principal Payments (from annual total principal payments on loan amortization schedule on "Assumptions" page)
Investment Assumptions
Many restaurant ventures are capitalized with funds from outside investors. While the
formation and organization of these deals vary, the Investment Assumptions make it easy to
accommodate a common way of structuring a restaurant venture where there is an operating
partner and one or more investments partners.
In this structure the operating partner makes a nominal capital contribution with the bulk of
the equity contributed by the investment partner(s). The investment partner(s) receives a high
proportion (or all) of the distributable cash flow until all of the investment partner(s) equity
contribution is paid back in full (referred to as “payback”). After payback is achieved, the
cash distribution ratio changes, giving the operating partner a greater share of cash
distribution for the remaining life of the venture.
As you can see in the table below, you can show the equity contributions of both the operating
and investment partners with different cash distribution ratios before and after payback.
© 2005 RestaurantOwner.com. All rights reserved.
Page 20
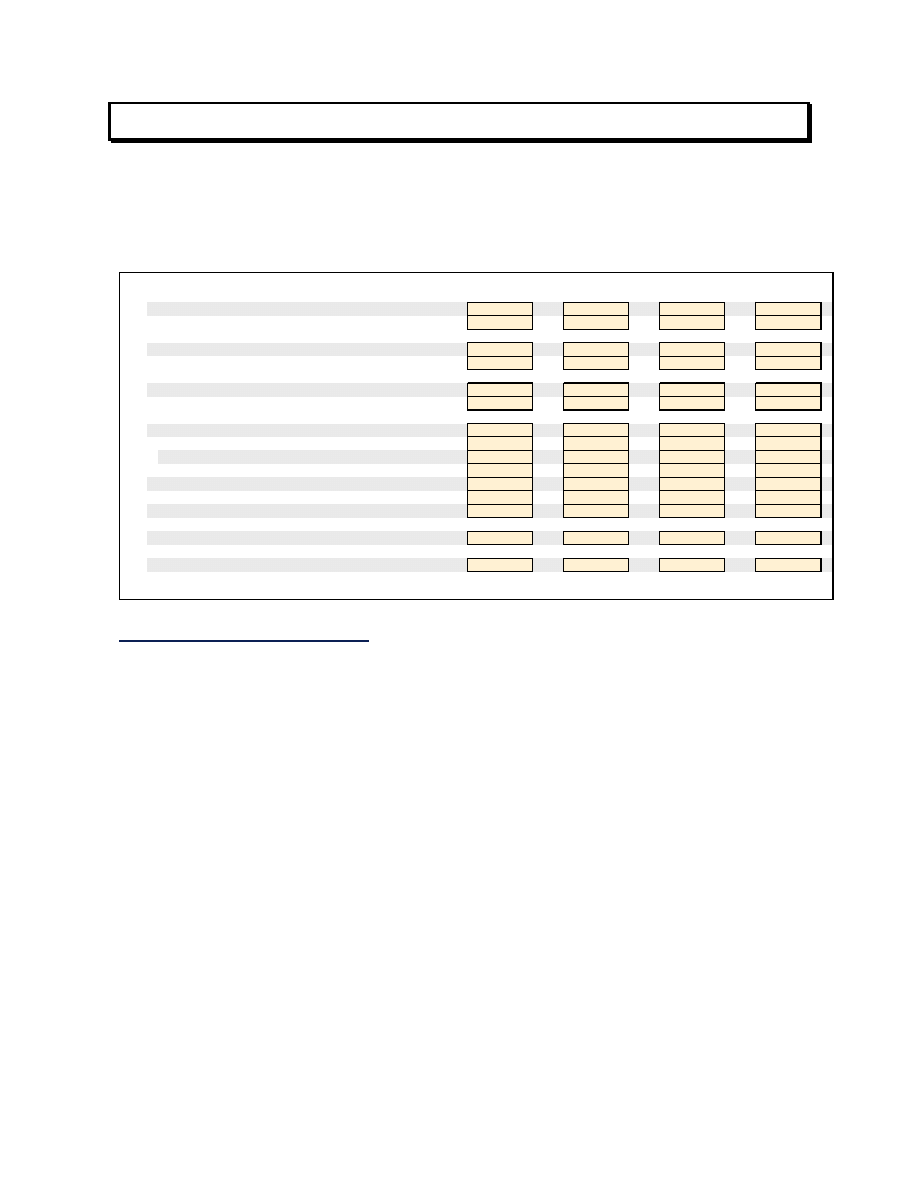
INVESTMENT ASSUMPTIONS
Total Equity Investment
$400,000
Operating Partner/Member (LLC)
Equity Contribution
$25,000
Cash Distribution Ratio Before Investor Payback*
25%
Cash Distribution Ratio After Investor Payback
50%
Investment Partner/Member (LLC)
Equity Contribution
$375,000
Cash Distribution Ratio Before Investor Payback
75%
Cash Distribution Ratio After Investor Payback
50%
* Investor "Payback" is the point at which the investor recoups 100% of their Equity Contribution.
Projected Investment Returns
After the 5 Year Operating Projections are completed, determine the distributable cash flow
percentage for each year in the fields just below “Cash Flow Before Taxes”. It is generally
prudent to plan on retaining some portion of the annual cash flow in the business as a reserve
for working capital, possible future operating deficits and capital improvement or expansion
projects. Some successful operators retain 1% of total sales per year for future capital
improvements such as roof, flooring, equipment replacement and re-imaging.
Based on your operating and investment assumptions the spreadsheet model will calculate the
Payback Period of the investment partner’s initial equity contribution as well as the
investment partner’s Return on Investment by year.
The Payback Period is important because is tells a potential investor when they can expect to
recoup the money they invested in the venture. It is common for investors in startup
independent restaurants to look for a payback period of 2-3 years. This is why the investment
partner(s) often receives a disproportionate share of the cash flow until payback is achieved.
Please note that all the numbers including Net Income, Cash Flow, Payback Period and
Return on Investment on this statement do not account for the affect of Local, State and
Federal Income Taxes. Potential investors may wish to have their accountants calculate the
impact of such taxes on their projected returns.
© 2005 RestaurantOwner.com. All rights reserved.
Page 21
Sales:
Food
$ 1,706,484
75.6%
$ 1,774,743
75.6%
$ 1,845,733
75.6%
$ 1,919,562
75.6%
$ 1,996,345
75.6%
Beverage
552,045
24.4%
574,127
24.4%
597,092
24.4%
620,976
24.4%
645,815
24.4%
TOTAL SALES
2,258,529
100.0%
2,348,870
100.0%
2,442,825
100.0%
2,540,538
100.0%
2,642,159
100.0%
Cost of Sales:
Food
546,075
32.0%
567,918
32.0%
590,635
32.0%
614,260
32.0%
638,830
32.0%
Beverage
150,155
27.2%
156,162
27.2%
162,409
27.2%
168,905
27.2%
175,662
27.2%
TOTAL COST OF SALES
696,230
30.8%
724,080
30.8%
753,044
30.8%
783,165
30.8%
814,492
30.8%
Gross Profit
1,562,299
69.2%
1,624,790
69.2%
1,689,781
69.2%
1,757,373
69.2%
1,827,668
69.2%
Payroll:
Salaries & Wages
584,311
25.9%
607,684
25.9%
631,991
25.9%
657,271
25.9%
683,561
25.9%
Employee Benefits
133,043
5.9%
138,364
5.9%
143,899
5.9%
149,655
5.9%
155,641
5.9%
TOTAL PAYROLL
717,354
31.8%
746,048
31.8%
775,890
31.8%
806,926
31.8%
839,203
31.8%
PRIME COST
1,413,583
62.6% 1,470,128
62.6% 1,528,934
62.6% 1,590,091
62.6% 1,653,695
62.6%
Other Controllable Expenses:
Direct Operating Expenses
104,197
4.6%
107,323
4.6%
110,543
4.5%
113,859
4.5%
117,275
4.4%
Music & Entertainment
3,000
0.1%
3,090
0.1%
3,183
0.1%
3,278
0.1%
3,377
0.1%
Marketing
36,000
1.6%
37,080
1.6%
38,192
1.6%
39,338
1.5%
40,518
1.5%
Utilities
48,600
2.2%
50,058
2.1%
51,560
2.1%
53,107
2.1%
54,700
2.1%
General & Administrative Expenses
116,641
5.2%
120,141
5.1%
123,745
5.1%
127,457
5.0%
131,281
5.0%
Repairs & Maintenance
21,600
1.0%
22,248
0.9%
22,915
0.9%
23,603
0.9%
24,311
0.9%
TOTAL OTHER CONTROLLABLE EXP.
330,039
14.6%
339,940
14.5%
350,138
14.3%
360,642
14.2%
371,461
14.1%
CONTROLLABLE PROFIT
514,907
22.8% 538,802
22.9% 563,753
23.1% 589,805
23.2% 617,004
23.4%
Occupancy Costs & Depreciation
Occupancy Costs
196,712
8.7%
200,646
8.5%
204,659
8.4%
208,752
8.2%
212,927
8.1%
Depreciation & Amortization
84,038
3.7%
84,038
3.6%
84,038
3.4%
84,038
3.3%
84,038
3.2%
Other (Income) Expenses
Other
(Income)
(4,800) (0.2%)
(4,944) (0.2%)
(5,092) (0.2%)
(5,245) (0.2%)
(5,402) (0.2%)
Interest Expense
52,547
2.3%
48,720
2.1%
44,574
1.8%
40,085
1.6%
35,223
1.3%
Other Expense
2,400
0.1%
2,472
0.1%
2,546
0.1%
2,623
0.1%
2,701
0.1%
NET INCOME BEFORE INCOME TAXES
$ 184,010
8.1%
$ 207,870
8.8%
$ 233,028
9.5%
$ 259,553
10.2%
$ 287,517
10.9%
ADD BACK:
Depreciation & Amortization
84,038
3.7%
84,038
3.6%
84,038
3.4%
84,038
3.3%
84,038
3.2%
DEDUCT:
Loan Principal Payments
(46,117)
(2.0%)
(49,945)
(2.1%)
(54,091)
(2.2%)
(58,580)
(2.3%)
(63,442)
(2.4%)
CASH FLOW BEFORE INCOME TAXES
$ 221,930
9.8%
$ 241,963
10.3%
$ 262,976
10.8%
$ 285,011
11.2%
$ 308,113
11.7%
PROJECTED INVESTMENT RETURNS
Distributable Cash Flow Percent *
70%
80%
90%
90%
90%
Distributable Cash Flow
$155,351
$193,571
$236,678
$256,510
$277,302
Cash Distribution:
Investment Partner/Member (LLC)
$116,513
$145,178
$145,409
$128,255
$138,651
Operating Partner/Member (LLC)
$38,838
$48,393
$91,270
$128,255
$138,651
Investment Partner/Member (LLC) Returns:
Net Investment After Cash Distributions - End of Year
$258,487
$113,309
$0
$0
$0
Payback Period
2.5
yrs.
Annual Return on Investment (before tax)
31.1%
38.7%
38.8%
34.2%
37.0%
Average Annual Return on Investment
35.9%
* It may be advantageous to retain a portion of the cash flow in the business for working capital, capital improvement reserves or for other reasons.
Blue Water LLC
5 Year Operating Projections
Year 1
Year 2
Year 5
Year 3
Year 4
© 2005 RestaurantOwner.com. All rights reserved.
Page 22
Break-Even
You can probably count on any potential investor or lender to ask the following question,
“What level of sales do you need to cover all your expenses?” By doing a break-even analysis
you can not only give them an answer but show them how the number was arrived at.
Break-Even Worksheet
The break-even worksheet uses numbers on the Summary P&L and the Assumptions page to
separate the various costs into being either a “fixed” or “variable”. While break-even is not an
exact science, you should get very close to an accurate break-even sales volume by following
our methodology described below.
Fixed Costs
Fixed costs or expenses are those that do not change or change very slightly with variations in
sales volume. Examples of fixed costs include management salaries, equipment rental and
base rent. Other costs, while not 100% fixed, do not change significantly when sales go up or
down. These types of fixed costs include utilities, most direct operating expenses and
marketing expenses.
Annual
Monthly
200,000
$
16,667
$
Minimum Hourly Labor
70%
269,018
$
22,418
$
Employee Benefits
114,250
$
9,521
$
Direct Operating Expenses
78,600
$
6,550
$
Music & Entertainment -
3,000
$
250
$
Marketing -
39,000
$
3,250
$
Utilities -
51,000
$
4,250
$
General & Administrative -
72,600
$
6,050
$
Repairs & Maintenance
21,600
$
1,800
$
Occupancy Costs:
169,200
$
14,100
$
Interest
52,547
$
4,379
$
Misc Other Expense
2,400
$
200
$
Loan Principal Payments
46,117
$
3,843
$
1,119,333
$
93,278
$
Fixed Costs
Total Management Salaries
In our sample financial projections model, these costs have been classified as “fixed.” Note
the “Minimum Hourly Labor” item. Hourly labor tends to have both a “fixed” and “variable”
component. As sales increase or decrease, labor hours can be adjusted but not in direct
proportion to the change in sales. Also, there is a certain baseline number of employees and
hours needed to minimally staff the restaurant. For this reason, we recommend that you
identify a Minimum Hourly Labor cost that is some percentage of the weekly hourly labor
cost you calculated on the Hourly Labor Projection Worksheet. A reasonable amount may be
60% to 75%. Enter this amount in the shaded box on this page (see above). The remaining
portion of hourly labor will be considered variable (see below).
© 2005 RestaurantOwner.com. All rights reserved.
Page 23
We recognize that this is somewhat arbitrary but break-even analysis is not an exact science
and this method tends to result in a fairly realistic and accurate estimate of a restaurant’s
break-even.
Variable Costs
Variable costs change in direct proportion to sales volume. For example, costs of sales, credit
card expenses and percentage rent, if applicable, are variable costs.
Variable Costs
% of Sales
$
Cost of Sales
30.8%
47,958
$
Hourly Labor
5.1%
7,942
$
Employee Benefits
0.8%
1,294
$
Credit Card Expense
2.0%
3,034
$
Paper Supplies
1.1%
1,763
$
39.8%
61,991
$
Annual
Monthly
Percentage Rent
3,648
$
304
$
The worksheet automatically pulls the variable costs out of Employee Benefits (payroll taxes
on variable portion of Hourly Labor), credit card expenses out of Administrative & General
and paper supplies out of Direct Operating Expenses.
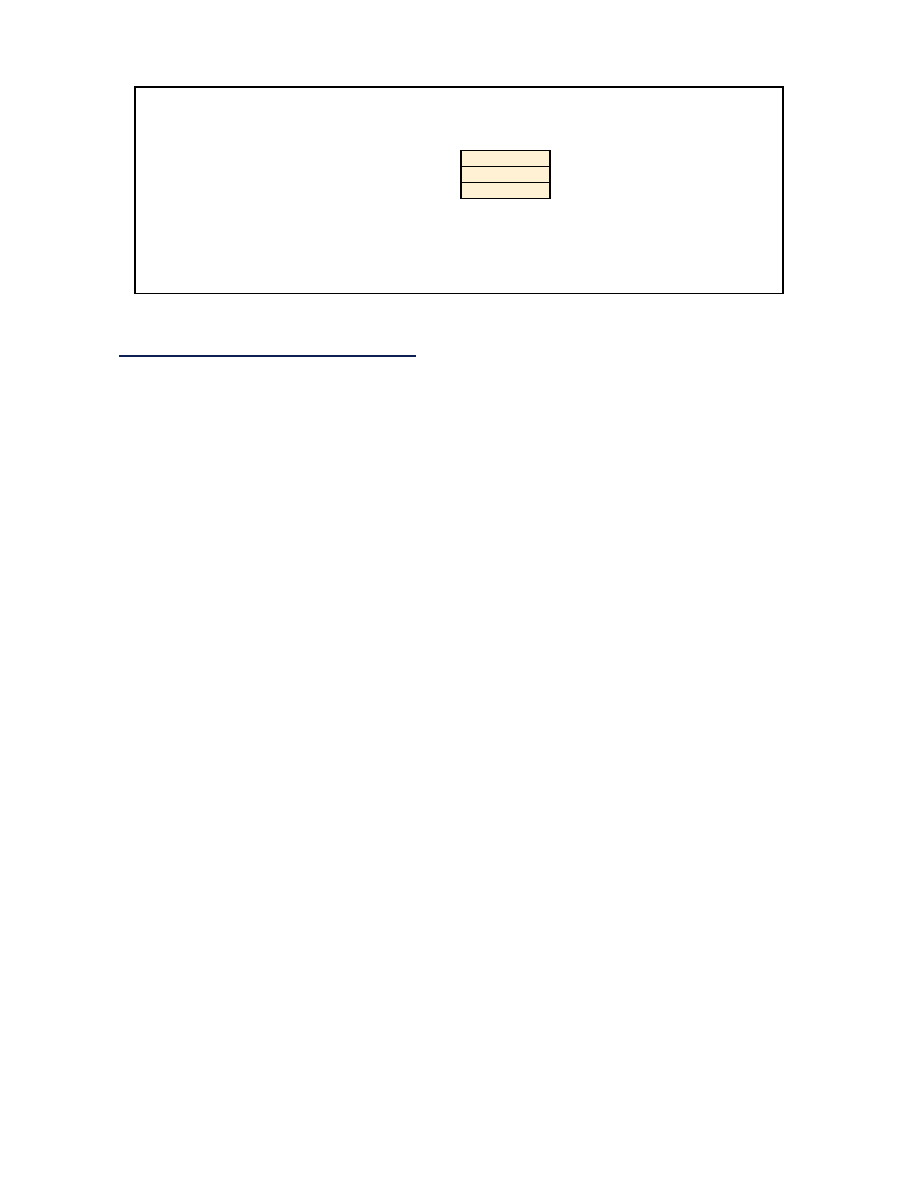
Cash Flow Break-Even
Based on the amount of total fixed costs and the variable cost %, the cash flow break-even
sales volume is automatically calculated and shown an annually, monthly and weekly.
Annual
Monthly
Weekly
Break-even Sales
1,866,872
$
155,573
$
35,901
$
Annual
Monthly
Weekly
Sales Break-Down:
Food
1,410,558
$
117,547
$
27,126
$
Liquor
80,899
$
6,742
$
1,556
$
Beer
105,785
$
8,815
$
2,034
$
Wine
269,630
$
22,469
$
5,185
$
Total
1,866,872
$
155,573
$
35,901
$
© 2005 RestaurantOwner.com. All rights reserved.
Page 24
Break-Even P&L Summary
The cash flow break-even is also presented in the P&L Summary format.
Sales:
Food
$ 117,547
75.6%
$ 1,410,558
75.6%
Beverage
38,026
24.4%
456,314
24.4%
TOTAL SALES
155,573
100.0%
1,866,872
100.0%
Cost of Sales:
Food
37,615
32.0%
451,379
32.0%
Beverage
10,343
27.2%
124,116
27.2%
TOTAL COST OF SALES
47,958
30.8%
575,495
30.8%
Gross Profit
107,615
69.2%
1,291,377
69.2%
Payroll:
Salaries & Wages
47,026
30.2%
564,318
30.2%
Employee Benefits
10,815
7.0%
129,784
7.0%
TOTAL PAYROLL
57,842
37.2%
694,102
37.2%
PRIME COST
105,800
68.0%
1,269,596
68.0%
Other Controllable Expenses:
Direct Operating Expenses
8,313
5.3%
99,758
5.3%
Music & Entertainment
250
0.2%
3,000
0.2%
Marketing
3,250
2.1%
39,000
2.1%
Utilities
4,250
2.7%
51,000
2.7%
General & Administrative Expenses
9,084
5.8%
109,004
5.8%
Repairs & Maintenance
1,800
1.2%
21,600
1.2%
TOTAL OTHER CONTROLLABLE EXP.
26,947
17.3%
323,362
17.3%
CONTROLLABLE PROFIT
22,826
14.7%
273,913
14.7%
Occupancy Costs & Depreciation
Occupancy Costs
14,404
9.3%
172,848
9.3%
Depreciation & Amortization
7,003
4.5%
84,038
4.5%
Other (Income) Expenses
Other (Income)
0
0.0%
0
0.0%
Interest Expense
4,379
2.8%
52,547
2.8%
Other Expense
200
0.1%
2,400
0.1%
NET INCOME BEFORE INCOME TAXES
($3,160)
(2.0%)
($37,921) (2.0%)
ADD BACK:
Depreciation & Amortization
7,003
4.5% 84,038
4.5%
DEDUCT:
Loan Principal Payments
(3,843)
(2.5%) (46,117)
(2.5%)
CASH FLOW BEFORE INCOME TAXES
$ 0
0.0%
($0) (0.0%)
BREAK-EVEN SALES
Week
$35,901
Month
$155,573
Year
$1,866,872
Cash Flow Break-Even Sales Volume
Blue Water LLC
MONTHLY
ANNUAL
Wyszukiwarka
Podobne podstrony:
Biznes plan restauracji, Fryzjerstwo, Biznes plan
biznes plan restauracji pod murami 2
Biznes plan restauracja po ciemku
Biznes Plan Restauracja
Plan marketingowy restauracja
Plan marketingowy 1
Plan pracy na 2011 pps
Damage Control Plan
Plan Balcerowicza
Wykład 7 Wieloletni Plan Finansowy
7 Plan sieciowy
PANsound manual
als manual RZ5IUSXZX237ENPGWFIN Nieznany
plan wspier
więcej podobnych podstron