
Global Value Chains
and Economic Globalization
- Towards a New Measurement Framework
Timothy J. Sturgeon
Industrial Performance Center, Massachusetts Institute of Technology

For information on the background of Eurostat’s work on global value chains and
international sourcing, and related available statistics, please access via
www.globalvaluechains.eu

Global Value Chains and Economic Globalization
- Towards a new measurement framework
Report to Eurostat by
Dr. Timothy J. Sturgeon
Industrial Performance Center,
Massachusetts Institute of Technology
May 2013
Contact: sturgeon@mit.edu

Acknowledgments: The author wishes to thank members of his project advisory
committee (Nadim Ahmad, Koen De Backer, Hubert Escaith, Gary Gereffi, Ronald
Jansen, J. Bradford Jensen, Peter Bøegh Nielsen, and William Powers) for their
support, insights, and experience; various Eurostat personnel for sharing their deep
subject expertise, and in particular Pekka Alajääskö, Principal Administrator and
project manager at Eurostat, for providing valuable input and support during the
preparation of this report. Feedback and discussion during the Global Value Chains
and Economic Globalization Workshop held on October 9, 2012 provided very useful
information.
Disclaimer: This report reflects solely the views of the author and is not meant to
represent the views of Eurostat or the Massachusetts Institute of Technology.

i
ABSTRACT
There is broad agreement that the world economy is becoming more deeply integrated
and interdependent along multiple dimensions: economic, cultural and political. While
one might expect cultural or political integration to be difficult to measure with precision,
global economic integration has also proven resistant to detailed quantification and
empirical characterization. We have a strong sense of profound changes in the world
economy, and see signs of it everywhere, but cannot fully describe the new patterns and
structures that are taking shape, not least because the official statistics at our easy
disposal were created for other purposes and in simpler times.
Economic globalization is a dynamic, long-term historical process that ebbs and flows,
waxes and wanes, and changes its character and extent over time, all with profound
effects on countries in the trading system. Advances in information technology, better
codification schemes, and improvements in transport and logistics increase the potential
for the geographical fragmentation of work. Because of this, the potential for economic
globalization appears to be increasing rapidly.
As it becomes more likely that value chains in large, economically important enterprises
and industries will be spread across multiple countries, it is more difficult to conceive of
national industries as self-contained systems and national economic performance as
endogenous. The measurement and policy challenges posed by these changes are non-
trivial. Thus, it is essential that the statistical resources to fully characterize and better
respond to the process of economic globalization be put in place as soon as possible.
After an extended background discussion that maps the shift from simple
internationalization to the more complex patterns of economic globalization that are
developing today, Part I provides a conceptual framework for determining the data
resources required, centered on Global Value Chains. Part II provides an assessment of
existing and experimental resources in the European statistical system and identifies the
data gaps. Part III emphasizes the use of micro-data resources as part of a plan for
moving forward while expending the least resources. Part IV provides a vision for
moving forward and a list of priorities and is followed by some concluding remarks.

ii
Table of contents
BACKGROUND ........................................................................................................................................... 1
F
ROM INTERNATIONALIZATION TO ECONOMIC GLOBALIZATION
.................................................................... 1
T
HE CHALLENGES OF ECONOMIC GLOBALIZATION FOR STATISTICAL MEASUREMENT
................................. 5
D
ATA GAPS LEAD TO POLICY GAPS
........................................................................................................................ 7
T
HE GLOBAL VALUE CHAINS AND ECONOMIC GLOBALIZATION PROJECT
(
GVC
-
EGP
) .................................... 8
PART I: A CONCEPTUAL FRAMEWORK FOR STATISTICS RELATED TO ECONOMIC
GLOBALIZATION ...................................................................................................................................... 9
E
CONOMIC GLOBALIZATION
,
A WORKING DEFINITION
...................................................................................... 9
F
OUR BASIC USES FOR STATISTICS ON ECONOMIC GLOBALIZATION
.............................................................. 10
G
LOBAL VALUE CHAINS
:
A CONCEPTUAL FRAMEWORK FOR ECONOMIC GLOBALIZATION STATISTICS
.... 10
The value chain ..................................................................................................................................................... 10
Bringing in globalization; international sourcing from intra-group affiliates and external
suppliers ................................................................................................................................................................... 12
PART II: A REVIEW OF CURRENT EUROPEAN STATISTICS RELATED TO ECONOMIC
GLOBALIZATION ................................................................................................................................... 14
D
ATA RESOURCES FOR INTERNATIONALIZATION
,
A REVIEW
......................................................................... 15
International trade in goods ........................................................................................................................... 15
International trade in services....................................................................................................................... 17
Foreign affiliate and foreign direct investment (FDI) statistics .................................................... 20
D
ATA RESOURCES FOR INTERNATIONAL SOURCING
,
A REVIEW
..................................................................... 21
International sourcing surveys ...................................................................................................................... 23
Tracking science, technology, and innovation (STI) in global value chains ............................. 29
S
UMMARIZING THE DATA GAPS AND ISSUES
..................................................................................................... 30
PART III: LEVERAGING MICRO-DATA RESOURCES ................................................................... 35
T
RADE BY ENTERPRISE CHARACTRERISTICS
..................................................................................................... 35
T
HE
E
UROGROUPS
R
EGISTER
(EGR)
AND
E
UROPEAN SYSTEM OF BUSINESS REGISTERS
(ESBR
S
) ....... 36
I
NTERNATIONAL INPUT
-
OUTPUT DATABASES
.................................................................................................. 38
T
AKING MICRO
-
DATA MAINSTREAM
.................................................................................................................. 42
PART IV: THE VISION AND THE PRIORITIES ............................................................................... 43
THE
N
EED FOR AN INTERNATIONALLY HARMONIZED MEASUREMENT FRAMEWORK
................................ 43
A
N INTEGRATED INTERNATIONAL DATA PLATFORM
....................................................................................... 44
T
HE PRIORITIES
..................................................................................................................................................... 46
CONCLUDING REMARKS ..................................................................................................................... 48
REFERENCES ........................................................................................................................................... 50
APPENDIX A. PROJECT ADVISORY COMMITTEE ........................................................................ 57
APPENDIX B. DEFINITIONS OF SEVEN BUSINESS FUNCTIONS AND CORRESPONDENCE
WITH CENTRAL PRODUCT CLASSIFICATION (CPC, VER. 2) ................................................... 58
APPENDIX C. DETAIL IN PRIVATE ENTERPRISE SYSTEMS, AN EXAMPLE ......................... 60

iii
Figures
F
IGURE
1.
A
SIMPLE VALUE CHAIN IN FOUR BASIC STEPS
........................................................................................................... 11
F
IGURE
2.
O
RGANIZATION AND LOCATION IN
GVC
S
;
FOUR SOURCING OPTIONS
.................................................................... 13
F
IGURE
3.
A
SIMPLE FOUR
-
STAGE VALUE CHAIN WITH FOUR SOURCING POSSIBILITIES
........................................................ 14
F
IGURE
4.
B
USINESS FUNCTIONS SOURCED INTERNATIONALLY BY
D
ANISH ENTERPRISES ENGAGED IN INTERNATIONAL
SOURCING
,
2001-2006
AND
2009-2001 ...................................................................................................................... 26
F
IGURE
5.
D
ATA COLLECTION GRID FOR FOUR SOURCING OPTIONS BY BUSINESS FUNCTION
............................................... 28
F
IGURE
6.
A
SIMPLE VALUE CHAIN WITH SOURCING POSSIBILITIES AND DATA RESOURCES
................................................. 30
F
IGURE
7.
S
HARE OF
D
ANISH NON
-
FINANCIAL ENTERPRISES AND EMPLOYMENT BY TRADE AND OWNERSHIP
CATEGORIES
(2010) ............................................................................................................................................................ 36
F
IGURE
8.
A
SIMPLE
,
GENERIC TWO
-
COUNTRY
IIO
TABLE
......................................................................................................... 39
Tables
T
ABLE
1.
S
EVEN BUSINESS FUNCTIONS USED IN THE
E
UROSTAT SURVEY ON INTERNATIONAL SOURCING
........................ 24
T
ABLE
2.
2012
E
UROSTAT INTERNATIONAL SOURCING SURVEY
,
SAMPLES SIZES AND PRELIMINARY RESPONSE RATES
26
T
ABLE
3.
I
NFORMATION REQUIRED FOR MEASURING THE INTERNATIONAL FLOWS AT THE ENTERPRISE LEVEL
............. 33
T
ABLE
4.
E
XISTING AND MISSING
GVC
VARIABLES IN THE
E
UROPEAN
S
TATISTICAL
S
YSTEM
(ESS) ................................ 34
T
ABLE
5.
C
ONCENTRATION OF EXPORTERS IN TOTAL MANUFACTURING EXPORTS
(
PERCENT
),
2003
.................. 37

iv

1
BACKGROUND
International trade and foreign direct investment (FDI) have long been important features
of the world economy, and both have grown steadily since the end of World War Two.
Peter Dicken (2011, p. 5) has referred to this process as internationalization, defined as
the “simple extension of economic activities across national boundaries.”
Today the picture has grown more complex, with multilayered international sourcing
1
networks and new technology-enabled business models that better integrate and
accelerate cross-border economic activity. This report characterizes these changes,
develops a conceptual framework for economic globalization statistics, reviews the
European Union’s current statistical resources and identifies data gaps, sets out a list of
priorities for improving the European Statistical System, and advocates for an
International Integrated Data Platform (IIDP) to link new and existing data resources.
The report intends to convey a sense of urgency. Even as most economic activity
remains nationally-, and even locally-bounded, the enterprises driving economic
globalization tend to be the most economically potent: large, fast growing, dynamic, and
innovative. Furthermore, the concept of global economic integration, by definition,
includes an assumption that cross-border business linkages will continue to connect more
places.
Because economic activity is increasingly linked across national jurisdictions it is
prudent, even essential, for all producers of economic statistics — within Europe and
beyond — to respond in coordinated fashion. However, because regional economic
integration has proceeded the farthest in Europe, it seems logical for Eurostat, the
statistical office of the European Union, to take the lead in developing a new framework
for economic statistics that takes the emerging realities of economic globalization more
fully into account. The purpose of this report is to provide guidance for such an effort.
FROM INTERNATIONALIZATION TO ECONOMIC GLOBALIZATION
Internationalization is largely driven by two mechanisms: 1) the spatial expansion of
markets through arms-length trade, and 2) the expansion of the internal structures of
multinational enterprises (MNEs) through foreign direct investment (FDI) and
subsequent intra-group trade between enterprises of the same group (e.g., global group
heads and foreign affiliates).
2
1
In this report sourcing refers to the acquisition of goods and services by enterprises. The terms internal
sourcing and intra-group sourcing are used when goods and services are obtained from within the
enterprise or enterprise group (sometimes called “in-house” sourcing). The term external sourcing is used
when goods and services are purchased from suppliers, vendors, and service providers that are not part of
the enterprise or enterprise group. Internal sourcing may occur domestically or, when foreign affiliates are
used, internationally. Likewise, external sourcing may rely on independent non-affiliated domestic
suppliers or suppliers in other countries. The term international sourcing used here refers to the use of both
foreign affiliates and foreign suppliers. Throughout the report, the terms international intra-group
sourcing and international external sourcing are used to refer to the internal and external versions of
international sourcing (see Figure 2 on page 15 for full definitions and discussion of these terms).
2
This definition covers only the most important drivers of internationalization. Other common forms of
global engagement include international portfolio investment, licensing, franchising (UNCTAD, 2011), and

2
The statistical resources to monitor internationalization and analyze its effects are far
from perfect, and the accuracy and timeliness of statistics in traded goods is regularly and
rightly questioned (van Leeuwen and Schout, 1987; Van Der Linden and Oosterhaven
1996). While improvements are needed, very detailed information is readily available on
the value and (in some cases) quantity of goods traded among hundreds of partner
countries (e.g., from Eurostat’s COMEXT and the UN’s COMTRADE databases).
International trade statistics have proven extremely useful to researchers and policy-
makers. They have served as a basis for the development and implementation of policy
for very specific categories of traded products (e.g., tariff thresholds and voluntary export
restraints, lists of excluded or restricted products) and helped to answer urgent policy
questions, such as the scale and impact of goods imports on domestic employments and
enterprises (e.g., Feenstra, 1984; Hausmann et al, 2006).
However, lack of detail on traded services has caused enough concern to cause data
producers to expand product lists and make other improvements to classification schemes
and associated surveys (Jensen, 2011). Statistics on the activities of MNE foreign
affiliates (e.g., from Eurostat’s Foreign Affiliate Statistics, or FATS dataset), while
useful, provide no information about intra-enterprise trade, and European statistics on
international trade in goods and services do not identify intra-group transactions.
3
Statistics on FDI (e.g., from Eurostat’s balance of payment accounts or from the tables
published annually in UNCTAD’s World Investment Report) provide little detail on the
activities of foreign affiliates, and cannot be linked to information about outward or
inward investors in business registers.
The producers of official statistics in Europe and elsewhere are aware of these
shortcomings, and improvements are being made. Still, there is a perception that recent
changes in the global economy have begun to widen the data gaps to alarming
proportions. The reasons are both quantitative and qualitative. On the quantitative side,
the opening of China, Russia, and India added huge product and labor markets that had
been all but outside the capitalist trading system prior to 1989, nearly doubling the field
of play for internationalization (Freeman, 2006, 2010). Faced with slow growth at home,
large enterprises rushed to set up operations in these newly opened markets, especially
China, in an effort to carve out brand recognition and market share in rapidly expanding
consumer markets and to cut costs on goods produced for export to international and
home markets. For goods that require shorter supply lines, the countries of East Europe
have joined traditional “export processing” locations such as Mexico and North Africa.
Related to this — and not — there was more work to be relocated. On the advice of
business school ‘gurus’ (Prahalad and Hamel, 1990) and under pressure from financial
markets (Williams, 2000), large American and European enterprises
4
embarked on a “2nd
unbundling” of corporate functions during the 1990s (Baldwin, 2011). In an effort to
focus on “core competencies,” nearly every business function deemed “non-core” was
subject to consideration for possible external sourcing from more specialized, lower cost,
looser forms of cross-border “strategic alliances” and memorandums of understanding between enterprises
(Simonin, 1999).
3
Data on MNEs collected by the United States Bureau of Economic Analysis do cover affiliated, intra-
group trade, see: http://www.bea.gov/iTable/index_MNC.cfm
4
Large Japanese manufacturing companies have been slower to embrace the large scale external sourcing,
but have been very active in setting up operations overseas. In doing so, they have often asked their main
suppliers to come with them (see Sturgeon, 2007).

3
and often less unionized suppliers (see Sturgeon, 2002, for a detailed case study of the
trend toward external sourcing in the electronics industry). Manufacturing functions
were among the first to be externally sourced.
It was common for service functions such as IT, transport, and facilities maintenance to
be externally sourced almost as early as manufacturing, but by the 2000s the
computerization of work and emergence of low-cost international communications
enabled a surprisingly wide range of service tasks to be standardized, fragmented,
codified, modularized, and more readily sourced externally and cheaply transported
across vast distances. Aspects of R&D even fell under consideration for external
sourcing. As in goods production, the application of information technology to the
provision of services allows some degree of customization within the rubric of
automation and high volume production, or what Pine and Davis (1999) call “mass
customization.”
5
When India’s new role as a location for large-scale “services offshoring” and “business
process outsourcing” came to light in the early 2000s, existing trade in services statistics
proved to be woefully inadequate to answer basic questions such as the scale of the trend
or the content of the work involved (Sturgeon et al, 2006; NAPA, 2006; Graham, 2007).
With 70-80% of OECD employment in services, and prior transformations in
manufacturing easily invoked, these questions took on a sudden urgency. If the political
changes after 1989 doubled the field of play for internationalization, the idea that services
could follow the same path as manufacturing expanded the potential field again and by a
similar proportion.
On the qualitative side, the rise of industrial capabilities in less developed countries
created many more options for relocating work, and new players came onto the field.
What previously had to be done within the confines of the MNE could be externally
sourced from newly competent global suppliers and service providers with offices and
factories around the world (Sturgeon and Lester, 2004). The twin trends of external and
international sourcing
6
meant that existing suppliers simultaneously received vast
quantities of new work and pressure to follow their customers to offshore locations
(Humphrey, 2003). At the same time and for the same reasons, the most competent
suppliers based in developing countries also grew rapidly and became MNEs in their own
right (Kawakami, 2011).
As a result, the character of MNEs changed. It is no longer accurate to conceptualize
MNEs only as large brand-carrying enterprises such as IBM, Nokia and Toyota.
Suppliers, vendors, and service providers of all kinds have joined the ranks of MNEs.
While this is straightforward enough for the enterprises involved — branded “lead”
enterprises want to simplify and centralize their supplier relationships as they globalize
by relying on their largest suppliers and service providers in multiple locations — it alters
the structure of the global economy and renders the statistical resources underlying
internationalization even less adequate. Statistics on MNEs and their affiliates no longer
can capture the myriad of “vertical” sourcing relationships that exist in the global
economy.
5
For example, the pre-determined sales pitches or responses to customer questions (known as scripts) used
by call center workers are often embedded in IT systems, and can be quickly and easily changed to sell or
provide customer service for a range of different products.

4
To complicate matters further, a set of highly influential global buyers gained scale and
influence in the 1990s, including retailers such as Wal-Mart and Tesco and branded
merchandisers such as Nike, Zara, and Uniqlo (Feenstra and Hamilton, 2006). Building
on successful experiments in 1970s and 1980s by a handful of pioneering retailers such as
JC Penny and Sears, global buyers began placing huge orders with suppliers around the
world without establishing any factories or farms of their own (Gereffi, 1999; Ponte and
Gibbon, 2005). Unlike traditional MNEs, where equity ties link headquarters with foreign
affiliates, global buyers link to their suppliers via non-equity external sourcing ties that
are much more difficult to discern in official statistics. Often, intermediaries (e.g.,
trading companies such as Hong Kong’s Li & Fung
6
) are used to link buyers to producers
in multiple countries.
For enterprises, however, engaging in external international sourcing is not the same as
engaging in simple arms-length trade. Global buying/sourcing relationships often come
with specifications and requirements for product design, quality, input sourcing, and
logistics that are as detailed and stringent, or even more so, than those set by MNEs for
their foreign affiliates (UNCTAD, 2011). Even with stringent requirements, contracts are
often “incomplete,” in that the characteristics of products and services cannot be fully
specified in advance, triggering iterative communication, frequent business travel,
successive contracts, and long-term linkages between buyers and sellers (Johanson and
Matsson, 1987).
It has been widely noted that these structural changes in the global economy have made it
more common for value to be added to products and services in two or more countries
prior to final use (Escaith and Timmer, 2012). However, transformations in the global
economy run deeper than that. Within this new, spatially and organizationally fragmented
system, high levels of monitoring and control, more precise coordination of logistics, and
the transfer of highly complex design parameters, requirements and instructions are
enabled by the computerization of design and manufacturing processes, low cost data
communications, and improved software to manage the flow of information both within
and between enterprises. As a result, distance has become less of a hindrance to
segmenting and relocating business processes and the international trading system has
become more dynamic, flexible, responsive and complex. New, previously unimagined
business models have arisen to leverage and arbitrage globally “distributed” capabilities,
labor markets, regulatory regimes, and markets. Producing for global markets provides
opportunities for scale — even in narrow segments of the value chain — that never
existed when markets were only local, domestic or regional. Internet retailing allows
individual shoppers to assess and purchase the wares of sellers the world over. What we
are witnessing is not a simple fragmentation of existing industrial systems but a basic
transformation of how buyers connect to sellers, how work is accomplished, how
production is organized, and how distribution is coordinated.
Peter Dicken (2011, p. 5) argues that the combination of these quantitative and qualitative
changes requires a different term: globalization, defined as “the functional integration of
internationally dispersed activities.”
7
Today, economic globalization combines the
6
http://en.wikipedia.org/wiki/Li_%26_Fung
7
Of course, in common usage the term globalization signifies a much broader set of changes, including
long-term tendencies toward deeper cultural and political interconnection (if not integration). Broadly
defined, globalization involves larger and more immediate flows of money, ideas, and people and the
concomitant, if uneven rise of regional and global institutions meant to govern them. This report narrows

5
traditional drivers of internationalization (arms-length trade and intra-enterprise trade
related to FDI) with external international sourcing that requires high levels of explicit
coordination that differentiate it from arms-length trade (Gereffi et al, 2005). As this
report highlights, external international sourcing comprises a largely unmeasured third
form of trade (in addition to arms-length and intra-group trade) that is, apparently,
growing in importance. In essence, external international sourcing arrangements imbue
inter-enterprise trade with characteristics similar to intra-group trade: better control from
the center, higher levels of bi-lateral information flow, tolerance of asset specificity, and
a harmonization and immediate integration of business processes that increase the
potential for foreign activities to substitute for activities performed at home.
It is this last point, in particular, that underscores the policy concerns associated with
current trends in economic globalization. Patterns of cross-border investment and trade
based on product-cycles, where less developed countries receive older, outmoded
products from more advanced economies (Vernon, 1966; 1979), are rapidly giving way to
more unified global production systems and markets, with different countries specializing
in specific aspects, or stages, of the development and production of leading edge goods
and services.
THE CHALLENGES OF ECONOMIC GLOBALIZATION FOR STATISTICAL MEASUREMENT
To be clear, external international sourcing has not supplanted traditional forms of
internationalization. Arms-length trade and the activities of MNEs continue to be the
main drivers of economic globalization. With internationalization, MNEs production was
sometimes fragmented. Ford, for instance, began by exporting vehicle “kits” from
integrated production facilities in the US and Canada for final assembly in foreign
markets in the 1900s. But, as local content requirements demanded, local parts
production gradually substituted for imported items. The result, in general, was a
replication of production structures, leaving home organizations largely unaffected
(Sturgeon and Florida, 2004).
8
While MNEs continue to set up production behind (existing or potential) tariff walls for
better market access and to capture the rents from protectionism, the fragmentation and
day-to-day (and sometimes hour-by-hour, minute-by-minute, or even real time)
integration of detailed work across high- and low-cost geographies is creating larger
potential for large scale substitution of work, triggering substantial changes within home
organizations and economies. In fact, external international sourcing and the use of
foreign affiliates are not mutually exclusive strategies, but are often entwined in dynamic
ways. Case study research has shown that international sourcing creates ample
this lens by referring to “economic globalization.” Global economic integration is partly, but not wholly
responsible for driving the broader processes of globalization forward.
8
In the context of internationalization, employment in foreign affiliates tends to complement domestic
employment. Research by Borga (2005) and, Desai et al (2005), and Slaughter (2003) all conclude that that
expansion of U.S. multinationals abroad stimulated job growth at home, and research that focuses on
affiliates in low wage locations found very small displacement effects (Harrison and MacMillian 2010, p.
4). Harrison and MacMillian (2010, p. 7) estimate that a ten percent increase in U.S. MNE offshoring to
affiliates in low-wage countries reduces U.S. manufacturing employment by .2 percent, while offshoring to
affiliates in high-wage countries increases U.S. manufacturing employment by .8 %. However, when
measurement of inter-industry flows of workers out of the manufacturing sector were taken into account,
larger effects were found.

6
opportunities for re-organization and automation, both at home and in new locations
(Dossani and Kenney, 2003). Small scale “tactical international sourcing” of a few
narrow tasks can lead to “transformational international sourcing” that drives
fundamental changes in home organizations (Kedia and Lahiri, 2007). Jensen and
Petersen (2013, p. 67) provide a description of how this process unfolded for a Danish
software company:
In March 2008, SimCorp, a successful provider of asset management software,
announced the opening of a wholly owned subsidiary in the Ukrainian city of Kiev. The
announcement kicked off the phasing out of the company's large-scale outsourcing
operation in the Ukraine, which had been launched with two local service providers as a
small pilot project in the spring of 2005. In the intervening years, the small-scale,
relatively basic outsourcing operation was transformed into a large-scale transformational
undertaking involving significant investments in local human assets. From March 2008
and for the next 18 months, SimCorp's Kiev subsidiary was staffed by a few expatriates
from the Danish headquarters and about 100 software developers from the two service
providers. This massive transfer of personnel, which took place in full agreement with the
two local service providers, safeguarded SimCorp's extensive human asset investments in
the Ukraine.
In this example we see external international sourcing leading to the formation of a MNE
affiliate, but there are many opposite examples as well, as when GE Capital spun off its
Indian IT services arm as Genpact in 2005. Genpact began in 1997 as a small Indian
office of GE Capital, performing back-office functions such as remote processing of car
loans and credit card transactions for U.S. customers because it was having difficulty
selling financial services in the heavily regulated Indian market. By 2011, Genpact had
grown into a $1.26 billion publicly traded business process and technology management
services company with 43,000 employees worldwide (Bhasin, 2011).
The greater scale, complexity, and transformational potential of economic globalization
demand that we ask more from our economic statistics: ways to systematically
differentiate arms-length trade from intra-group trade and external international sourcing,
ways to track services trade in more detail, ways to determine the real location of value
added, and ways to differentiate globally-engaged from non-globally-engaged enterprises
so the performance of these very different segments of national economies can be tracked
in terms of profits, innovation, employment, and wages paid. Old and new data sources
must be better harmonized, integrated, and linked, not only to each other but to
“international business registers” that identify the ownership structures of enterprises
across borders and link to detailed information on employment, investment, and
economic performance. Only with an integrated international data platform (IIDP) of this
sort will policy-makers be able to understand the impact of economic globalization and
develop appropriate responses (see 44 for a full discussion of this concept).
Five main issues arise from this discussion:
First, the barriers to international and even domestic inter-agency data sharing can be
significant. Some if this is determined by legislation related to confidentiality, but
more often the barriers are created by institutional inertia, inter-agency competition,
lack of leadership, funding, and ultimately, political will. If data and data
infrastructure can be more easily linked across countries and regions, more can be
done with existing data.
Second, information on intra-group trade is missing; a glaring data gap given the
central role MNEs play in economic globalization. Ownership matters because it

7
often determines when and where further investments are made, where profits are
taken, and where technological capabilities and intellectual property truly lie (Linden
et al, 2009, 2011). With full information on ownership, “trade in income” could
begin to be tracked along with trade in value added (Escaith and Timmer, 2012).
Third, external international sourcing, because it cannot be differentiated from arms-
length or affiliated trade in current statistics, represents a largely unmeasured third
form of trade.
Fourth, data on traded services is quite weak, in part because large-scale trade in
services is relatively new and in part because services trade is difficult to account for.
Fifth, the vastly expanded trading system has brought in countries with poorly
developed statistical resources. More effort is needed to help these countries improve
their statistical systems.
DATA GAPS LEAD TO POLICY GAPS
The implications of economic globalization for policy are far reaching. How can workers,
enterprises, and industries be provided with the best environment for engaging with the
global economy? How can we be sure that enough wealth, employment, and innovative
capacity are generated at home as economic globalization proceeds? How much of the
rewards of innovation and new industry creation can be captured domestically, and for
how long? What are the motivations for investing in domestic innovation if the bulk of
the jobs and value will likely be created in other countries? How much national
specialization – and by extension, interdependence with other societies – is too much?
These are open questions. Even if policy-makers seek few direct interventions in the
areas of trade, industrial, or innovation policy, economic globalization can make the
process of economic adjustment more difficult because it accelerates the pace of change.
With stakes this high, there is broad interest in finding mechanisms to ensure that MNEs
and external international sourcing networks not only thrive but also work to elevate,
rather than depress, the welfare of societies in which they are embedded.
But with
multiple externalities, high complexity, and mixed outcomes, the challenge at hand is to
understand the effects of economic globalization more precisely, and for this there is an
urgent need to develop better statistical resources.
Because the picture of economic globalization provided by current official statistics is
incomplete, the causal links to economic welfare indicators such as employment and
wages tend be weak and unconvincing, allowing a set of highly charged, politically
motivated, and unproductive debates over the basic facts of economic globalization to
flourish. New thinking and new data will be required to develop clear, incontrovertible,
evidence-based insights into the character and implications of economic globalization.
Perhaps the most pressing need is to make full use of existing data resources, for a system
that ties data from business surveys to the wealth of information from administrative
sources. Of course, new data also needs to be collected, but the additional information
needed is actually quite modest. The most important, and more challenging step, is to
develop an International Integrated Data Platform (IIDP) to link existing and new data in
an easy-to-use statistical product that can rapidly deliver useful analysis in ways that
protect confidentiality. A vision and list of priorities for the steps are laid out in Part IV
of this report (page 44). Before recommendations for improvement can be made,

8
however, a clear conceptual framework and evaluation of the current situation is required.
THE GLOBAL VALUE CHAINS AND ECONOMIC GLOBALIZATION PROJECT (GVC-EGP)
The Global Value Chains and Economic Globalization Project (GVC-EGP) is intended to
provide technical background for an eventual Eurostat manual to help EU member states
collect and produce appropriate statistics on economic globalization. The aim of this
report is to help stimulate and contribute to Eurostat’s and the European Statistical
System’s internal deliberations on the best ways to move forward.
Two critical points need to be stressed at the outset.
1. First, because economic globalization is by definition a cross-border phenomenon,
international standardization is essential. Compatible, if not identical, data sets
will need to be developed, not only in EU member states, but also — eventually
— in all countries in the trading system. While this is a big challenge in Europe
and OECD nations, it is even greater in developing countries where data resources
are less developed. But in this lies opportunity: to develop new, internationally
standardized data resources that are on one hand parsimonious, to save resources
and minimize respondent burden, and on the other rich by current standards
because they shed light on aspects of economic globalization that have so far
remained nearly invisible in economic statistics.
2. Second, an integrated approach is needed to make better use of existing data and
tie it to new resources meant to fill the data gaps. No single statistical resource
will answer all of the questions that need to be asked or fill all of the requirements
of policy makers. However, the use of common classifications within a unified,
integrated conceptual framework can create a broad vision of the statistical
resources required. This will provide the guidance needed to evaluate current data
collection programs and devise new ones. A holistic framework will help
statisticians identify redundant data resources, appropriate standards for detail and
accuracy, and insure maximum use of existing data resources (including
administrative micro-data). In this way managers of data agencies can move
quickly to develop new data resources with full confidence that they are urgently
needed to fill known data gaps within a larger, integrated vision.
While adapting European — and eventually the world’s — statistical systems to the
realities of economic globalization will take time and be difficult to achieve, a concerted
effort is needed now. Again, this report is intended to create a heightened sense of
urgency that can help motivate and inform this process. Part I provides a framework for
identifying the data needs related to economic globalization: Global Value Chains
(GVCs). Part II reviews how far traditional data resources related to internationalization
can go toward fulfilling these needs, and identifies a few key data gaps. Part III identifies
some innovative surveys, concepts, and methods for improving statistics related to
economic globalization. Part IV offers a vision and set of priorities for moving forward.

9
PART I: A CONCEPTUAL FRAMEWORK FOR STATISTICS RELATED
TO ECONOMIC GLOBALIZATION
ECONOMIC GLOBALIZATION, A WORKING DEFINITION
How do we define economic globalization for statistical purposes? The scope of this
report is limited to the cross-border activities of for-profit enterprises and other
organizations,
9
specifically investment, production, trade, sales, and international
sourcing of intermediate goods and services.
The analysis specifically excludes labor markets, employment, and the specific content of
jobs as units of statistical analysis. Of course the quantity, quality, and content of jobs are
central concerns, and both are affected by economic globalization. The movement of
workers — skilled and unskilled — is an intrinsic feature of economic globalization
(Saxenian, 2005, 2006). The cost and quality of labor are central drivers of economic
globalization: for example when enterprises internationally source from places with low
labor costs or set up affiliates in places where labor markets provide access to specific
skills. However, the effects of economic globalization on employment and jobs will
mainly require an improved picture of the global engagement
10
of enterprises, especially
of the activities (just mentioned in the above definition) that drive the process of
globalization economic integration forward: investment, production, trade, sales, and
international sourcing. Hiring patterns and skill requirements can be most usefully
judged in the context of these basic measures of economic globalization. In other words,
while data on employment is readily available at the national level, very little is known
about how employment is affected by economic globalization. To make this link, better
statistical information on the global engagement of enterprises is the main requirement.
Therefore, the working definition of economic globalization for this report is as follows:
The inward and outward flow of goods, services, and investment across national
borders, along with the functions —including functions related to innovation —
that enterprises and organizations use to set up, support, and manage these flows.
This definition includes primary products, intermediate goods and services, and final
goods and services. It includes not only the flow of products, services and investment,
but the equity and ownership ties and channels of control and information exchange that
enable and structure these flows.
9
The reference to “other organizations" here is in recognition to the fact that all organizations, for-profit,
non-profit, and public sector all have the potential to engage in FDI and/or international sourcing.
Examples include non-profit and public sector organizations that source call center or customer support
services internationally, non-profit universities that set up satellite campuses outside of their home country.
10
Again, global engagement is a two-way concept that includes importing and exporting, as well as
accepting and engaging in inward and outward international investment and sourcing.

10
FOUR BASIC USES FOR STATISTICS ON ECONOMIC GLOBALIZATION
What are the basic questions that need to be answered about economic globalization?
Before outlining the data resources needed, this question needs to be addressed. Four
important (and interrelated) uses for statistics related to economic globalization can be
identified as follows:
1. To develop a full set of enterprise characteristics, including the enterprise’s global
engagement. Is the enterprise domestic or foreign-owned? Is the enterprise part of
an MNE or non-equity business network? What products and services does the
enterprise make itself and what does it source domestically or internationally?
These data can be used descriptively to characterize global engagement at the
level of localities, industries, or countries; and also as control variables in other
analysis, especially a deeper analysis of international trade than is currently
possible.
2. To gauge how pervasive global engagement is and what the trends are.
3. To better understand the impact of global engagement on the quantity and quality
of employment, including wages and social, inter-industrial, and international
mobility. While the statistics on employment are rich, and business registers
include information about the number of employees per enterprise, a European-
level register and links to trade and other economic statistics will need to be
established before they can be made useful for the analysis of economic
globalization.
4. To better understand the impact of global engagement on innovation.
GLOBAL VALUE CHAINS: A CONCEPTUAL FRAMEWORK FOR ECONOMIC
GLOBALIZATION STATISTICS
The central question addressed by this report is: What are the minimal statistical
resources required to answer these four critical policy and research goals? The approach
to answering is to apply the logical concept of lex parsimoniae, or Occam's Razor. The
goal of Occam's Razor is to achieve maximum parsimony, economy, or succinctness in
the construction of theory and methods. The basic conceptual framework should first be
developed by “shaving off” any data elements that are unnecessary and include only
those that are absolutely required to provide statistical support for the above-stated goals
with the fewest built-in assumptions. In a context where official information must be
optimized under budgetary constraints, the first step should be to target the collection of
very specific, broadly harmonized data, not to collect every bit of information from every
source possible. But this is only a first step. Once the proper conceptual framework and
international data infrastructure is in place, more existing data sources can be integrated
and linked to better serve policy goals. To accomplish this, a guiding framework is
needed to help visualize the required data elements.
THE VALUE CHAIN
The concept of global value chains (GVCs) can provide a conceptual framework for
economic globalization statistics. To build this conceptual model in step-wise fashion,
we can start with the simple concept of the value chain. It is useful to think of economic

11
activity as a series of value added stages, or steps. Following Kaplinsky and Morris
(2001) we can define a value chain as follows:
The value chain describes the full range of activities required to bring a product or
service from conception through the different phases of production, delivery to final
consumers, and final disposal after use.
At a simple level, value chains include sequential value added functions such as design,
production, marketing, transportation, logistics, distribution and support and after-sales
service to final consumers. Value chains can produce goods, services, or (quite typically)
some combination of the two. The activities that comprise a value chain can be contained
within a single enterprise or divided among different enterprises, serving internal needs or
the open market. Therefore, a single value chain stage can describe a functional group or
division within an enterprise or an entire industry segment (e.g., in-house manufacturing
vs. contract manufacturing; in-house call centers vs. external call center services; internal
information technology (IT) support vs. externally sourced IT services).
Clearly, the real economy is not so simple, linear, or unidirectional. Value chains are
profoundly shaped by the institutions and regulatory regimes in which they are situated
(Henderson et al, 2002). They cannot be simply traced in stepwise fashion from simple
inputs to complex final goods and services. Value chains, especially in service-producing
industries, are filled with iterative work, consisting of feedback loops where ‘drafts’ of
products and projects are created, reviewed, and altered over time. ‘Support’ functions
such as management, administration, IT services, and facilities maintenance tend to cut
across sequential activities (Porter, 1985). Intermediate goods, capital equipment, and
services enter value added chains along multiple vectors as discrete inputs but also as
fully formed machines, subsystems or ‘blocks’ of useful services and knowledge that are
incorporated by organizations in a variety of ways. Materials, components, machinery
and IT systems each have their own value chains, add value to production both directly
and indirectly, and can be amortized over time across a variety of products and services.
11
Nevertheless, the value chain concept provides a useful heuristic device for more fully
accounting for goods and services as they are created and flow into markets. In its
simplest level, a value chain can be said to consist of four steps, 1) research, design, and
product development; 2) inputs; 3) production; and 4) marketing, sales, distribution, and
after-sales service, with most trade (generally) occurring in the “supply chain” portion
consisting of intermediate inputs and the production of final goods, and most value
(generally) created in the first and last steps of R&D and sales (see Figure 1):
Figure 1. A simple value chain in four basic steps
11
Figure 1 is highly simplified. After-sales functions such as disposal and recycling are increasingly
important and highly regulated activities that can transform waste back into inputs for future use, creating a
“value cycle.”
Research, Design
and Product
Development
Inputs
Production
Marketing, Sales,
Distribution, and
After-sales Service
The Supply Chain

12
BRINGING IN GLOBALIZATION; INTERNATIONAL SOURCING FROM INTRA-GROUP
AFFILIATES AND EXTERNAL SUPPLIERS
The strength of the value chain concept is that it leads us to consider the entire range of
activities needed to bring products and services from conception to end-use and beyond.
The usefulness of this approach is enhanced by the fact of economic globalization. When
business networks extended beyond the boundaries of the enterprise or the nation, the use
of the value chain concept demands that the flow of work be traced along its various
stages and locations to end use and even beyond into after-sales service, disposal, and
recycling.
Because value chains can be contained within a single geographical location or linked
across multiple locations, it is appropriate to use the term global value chain or GVC to
capture the full range of possibilities. The term GVC as used here is not meant to
exclude the domestic components of value added or even entirely domestic value chains,
it is simply meant to increase the scope of consideration to include the possibility that
value chains can span international borders, especially continental borders.
In theory, each segment, function, activity, or node in the value chain can contribute a set
of highly specialized tasks and inputs to finished products or services. The dividing
points between value chain stages are not given, but are influenced by points of
technological, process, or scale dissimilarity (Richardson, 1972) as well as the quality and
ubiquity of codification schemes and standards that ease the exchange, or “hand off” of
appropriate technical information between specialized tasks (Langlois and Robertson,
1995; Baldwin and Clark, 2000; Sturgeon, 2002; and Principe et al, 2003). If knowledge
and information are fully tacit and uncodified, as they are more likely to be in the
research, design, and product development phases of the value chain, it stands to reason
that co-location within an enterprise or urban industrial cluster is more likely.
Specialized labor markets and exchanges of tacit knowledge are especially dense,
efficient, and vibrant when it is possible for agents to meet face to face (Storper, 1995).
Localization is important in the creation of new knowledge because innovative work
necessarily involves the generation and exchange of knowledge that has not been
rendered portable through codification (Malmberg and Maskell, 1997; Martin and
Sunley; 2006).
However, the opposite is also true. When knowledge and information is
rendered portable (e.g. through digitization) it stands to reason that work can more easily
spread geographically (Sturgeon, 2009). Such technical factors can influence how work
is divided, not only within a factory or single enterprise, but also in globe-spanning
business networks that link several — if not dozens — of enterprises, facilities, offices,
carriers, and workshops as a product or service takes shape as it moves along a value
adding chain of activities. However, technology can only enable specific patterns of
economic geography. It is the strategic decisions of managers, in the end, that create
these patterns.
The implication for corporate strategy is that each value chain stage in Figure 1 (or in
fact, each business function or activity required to bring a product or service from
conception to end use) presents managers with four distinct sourcing options when it
comes to organization and location (see Figure 2). In terms of location managers have
two domestic options: 1) internal domestic sourcing from within the enterprise of
enterprise group, and 2) external sourcing from independent domestic suppliers; and two

13
international options: 3) internal international sourcing from within the enterprise group
(i.e., using foreign affiliates), and 4) external international sourcing from independent
suppliers.
Similarly, in terms of organization managers have two internal sourcing options: 1)
internal domestic sourcing from within the enterprise of enterprise group, and 3) internal
international sourcing from within the enterprise group (i.e., using foreign affiliates); and
two external sourcing options: 2) external sourcing from independent domestic suppliers,
and 4) external international sourcing from independent suppliers.
Figure 2. Organization and location in GVCs; four sourcing options
ORGANIZATION
LOCATION
DOMESTIC SOURCING INTERNATIONAL SOURCING
INTERNAL SOURCING:
sourced from within the
enterprise or enterprise
group
EXTERNAL SOURCING:
sourced from outside the
enterprise or enterprise
group
Source: adapted from Nielsen, 2008, and Eurostat’s methodology for international sourcing surveys.
The next step is to combine the simple value chain in Figure 1, containing four basic
activities, or functions, with the four sourcing choices in Figure 2. This yields sixteen
possible sourcing realms that need to be considered to develop a more complete view of
economic globalization (see Figure 3). Of course, in practice, there are many more value
chain steps, and many more realms of activity (European international sourcing surveys
use seven functions as shown in Table 1 below), and enterprises and other organizations
have the choice to mix all four sourcing options for any value chain activity in complex
and dynamic ways. While they are not included in Figure 2, arms-length transactions are
still important in international trade and cannot be ignored.
12
If intra-group trade and
external sourcing can be identified or estimated in trade statistics, arm-length trade can be
derived as a residual category of international trade. With this caveat firmly in mind,
12
UNCTAD (2013, p. 16) estimates that arms-length trade (i.e. trade unrelated to MNCs or external
international sourcing) represents 20% of world trade.
1) Domestic intra-group sources
Work performed within the
enterprise or enterprise group
within the compiling country
(work sourced "in-house")
3) International intra-group
affiliates
Work performed within the
enterprise or enterprise group
outside the compiling country
2) Domestic external suppliers
Work performed outside the
enterprise or enterprise group
by non-affiliated enterprises
within the compiling country
(.e.g., sourced from
independent suppliers, service
providers, contractors, etc.)
4) International external suppliers
Work performed outside the
enterprise or enterprise group by
non-affiliated enterprises outside
the compiling country (.e.g.,
sourced from independent
suppliers, service providers,
contractors, etc.)
Four sourcing options
for any business
function

14
Figure 3 can be said to concisely illustrate the range of GVC activity realms where
statistics need to be produced to create a fuller picture of economic globalization.
Figure 3. A simple four-stage value chain with four sourcing possibilities
The final step is to recognize that foreign (or extra- EU) enterprises and enterprise groups
have the same choices as domestic (or EU) enterprises do when it comes to economic
globalization. Here, it becomes clear that economic globalization is a very complex
process, with the sixteen sourcing options depicted in Figure 3 multiplied in bi-lateral and
multi-lateral networks of international trade, investment and sourcing. The importance of
foreign enterprises in these networks, as investors and suppliers, underscores the need for
international standardization and cooperation in the effort to create and maintain cross-
border business registers. Compiling full statistics on trade, investment, and sourcing
practices for all sixteen quadrants in Figure 3 for all enterprises in the EU will never be
enough if they cannot be linked to compatible statistics on enterprises based outside of
the EU.
In Part III, the GVC framework developed here will be used to summarize the economic
globalization resources available in the European statistical system (see Figure 6). First,
those resources need to be assessed.
PART II: A REVIEW OF CURRENT EUROPEAN STATISTICS RELATED
TO ECONOMIC GLOBALIZATION
This section reviews the current data regime in Europe related to economic globalization.
While there is more work to do, several important steps have been taken to fill in missing
data and create links to business registers to allow profiles of globally engaged
enterprises to be systematically aggregated and analyzed to reveal trends and apparent
effects related to economic globalization. The review is not meant to be comprehensive
or encyclopedic. The Eurostat web portal can link readers seeking more information to
meta-data descriptions and to the data itself.
13
The goal here is to assess current data
resources and identify the most important data gaps so clear recommendations for
moving forward can be developed in Parts III and IV.
13
See:
http://epp.eurostat.ec.europa.eu/portal/page/portal/eurostat/home/
Research, Design and
Product Development
Inputs
Production
Marketing, Sales,
Distibution, and After-
sales Serivce
Domestic
intra-group
sources
International
intra-group
affiliates
Domestic
external
suppliers
International
external
suppliers
Four
sourcing
options
Domestic
intra-group
sources
International
intra-group
affiliates
Domestic
external
suppliers
International
external
suppliers
Four
sourcing
options
Domestic
intra-group
sources
International
intra-group
affiliates
Domestic
external
suppliers
International
external
suppliers
Four
sourcing
options
Domestic
intra-group
sources
International
intra-group
affiliates
Domestic
external
suppliers
International
external
suppliers
Four
sourcing
options

15
DATA RESOURCES FOR INTERNATIONALIZATION, A REVIEW
Internationalization is a venerable process. Trade has been an important feature of the
global economy for thousands of years, with important inter-continental trade routes for
spices and incense established between Rome and India as far back as the 1
st
Century.
The motivations for arms-length trade have been identified in economic theory as 1)
exporting goods produced at lower cost than is possible in trading partners (Smith, 1776),
2) exploitation of comparative advantage based on the natural factor endowments of
countries, such as trading Spanish wine for English wool (Ricardo, 1817), 3) exporting
goods (or goods relying on production factors) that are unavailable or scarce in importing
countries (Ohlin, 1952; Kravis, 1956), 4) trading similar but specialized goods with
trading partners with similar demand profiles (Linder, 1961), and 5) exporting goods that
have technological advantages over local products (Rogers, 1962).
Multinational enterprises (MNEs) also have a long pedigree. The British East India
Company was granted a Royal Charter by the English Crown in 1600. With the rise of
mass production the Ford Motor Company, to provide just one example, established
assembly plants in Canada, England, France, Spain, Italy, Belgium, Germany, Denmark,
Sweden, Argentina, Brazil, Mexico, Chile, Japan, Australia, South Africa, India, and
Malaysia between 1904 and 1929 (Sturgeon and Florida, 2000).
INTERNATIONAL TRADE IN GOODS
Historically, national governments have had an interest in measuring trade in goods
where tariffs and duties were collected or where other trade policy measures were
applied.
14
To support this, governments collect and publish detailed information on the
value of imported and exported goods. The main trading countries (the U.S. and many
European countries) began to publish bilateral disaggregated merchandise trade data in
the 1850s, and an international convention for the publication of customs tariffs was
established in 1890. Countries used these statistics to support elaborate tariff regulations
meant to protect local industry, increase local content, and collect revenue from both
arms-length trade and intra-group trade within MNEs. This drove both an expansion of
MNCs and retaliatory policy responses between trading partners in a classic “trade-war”
dynamic. In the face of waxing nationalist sentiments in the run-ups to the two World
Wars, progress towards more harmonized trade data was interrupted (as was trade itself
during wartime), but this progress resumed in the 1940s.
Today, European policy-makers see promotion of international trade as a key driver of
economic growth and job creation within the common market region. In fact trade policy
is an exclusive power of the EU – only the EU, and not individual member states, can
legislate on trade matters and conclude international trade agreements. The harmonized
customs rules ensure that these rules are followed and necessary data for statistics will be
available.
15
For this reason European statistics on international trade tend to distinguish
trade between European Union (EU) Member States and non-EU countries from trade
within the EU. On the other hand, the EU is a single market with free movement of
goods. Since January 1993 controls on the movement of goods within the EU have been
14
For example, it is sometimes deemed necessary to ban, restrict, or otherwise exclude trade in specific
items for legal, public health, or national security reasons.
15
See:
http://ec.europa.eu/trade/

16
abolished; the European Union is now a single territory without internal frontiers. The
abolition of customs tariffs promotes intra-EU trade, and this accounts for a large portion
of the total imports and exports of the Member States.
Statistics on trade within the EU are collected through the Intrastat system.
16
In this
system, intra-EU trade data are collected directly from trade operators, which send
monthly declarations to the relevant national Statistical Institutes (NSIs).
17
Data on
international trade in physical goods and commodities are available in considerable detail
on-line in the COMEXT dataset.
18
The database contains information on import and
export of goods between individual and groupings of European countries and 200 trading
partners (plus various groupings), from 1988 to the current year.
Regional integration in Europe has driven the creation and application of high standards
for the collection of goods trade in Intrastat. However, statistics on trade statistics
reported by non-EU countries are not required to adhere to European standards. Because
trade data are collected from customs forms by different national statistical institutes
(NSIs), they vary in quality and coverage. Evidence of inaccuracy in trade statistics can
be found in analysis of “mirror statistics”, where the exports between specific trading
partners are compared to imports in the same commodity (van Leeuwen and Schout,
1987; Van Der Linden and Oosterhaven 1996). Errors in trade statistics can result from
poor compliance, unrecorded re-exporting, and deliberate falsification. In general,
exports statistics tend to be less accurate than imports because requirements for
compliance tend to be less stringent for exports than for imports.
19
This is because
governments are financially motivated to collect tariffs and duties on imports and tend to
screen banned or limited products more aggressively than exports.
20
Nevertheless, statistics on traded goods are very rich. The COMEXT database publishes
information on imports and exports by value and in some cases by the number of units or
volume shipped, by product, industry, tariff regime, and mode of transport, according to
five different product (commodity) lists (CN8, HS, CPA, SITC, and BEC), the most
detailed being the CN8 list, which follows the structure of the World Customs
Organization’s Harmonized System (HS) but adds additional detail and is updated
annually, currently encompassing to more than 9,000 product descriptions at the eight-
digit level. All European importers and exporters have established unique ID codes that
can be linked to administrative data in the business registers of Member States. The Trade
in Enterprise Characteristics project is an example how this has been utilized to examine
the employments effects of international trade in specific countries (see page 36).
Data issue: there are inconsistencies in reporting (e.g., differences in mirror statistics
and different classifications for imports and exports of the same product) and lack of
16
See
http://epp.eurostat.ec.europa.eu/statistics_explained/index.php/International_trade_introduced
- soon
to be revised by a burden-reducing new initiative called “SIMSTAT”
17
See:
http://epp.eurostat.ec.europa.eu/portal/page/portal/international_trade/introduction
18
See:
http://epp.eurostat.ec.europa.eu/portal/page/portal/international_trade/data/database
19
An exception is intra-EU trade, where exports statistics are considered to be more accurate because they
are based on surveys (rather than customs forms) of fewer companies with higher trade volumes in fewer
products categories relative to mirrored imports where there are more importers and more products.
20
Exceptions include products that are excluded from export for national security reasons.

17
accounting for re-exports. Ongoing work to reconcile bilateral trade flows and track
trade for processing with trading partners should continue.
21
Data gap: Statistics on international trade in goods do not differentiate affiliated
from non-affiliated trade. A “related party” flag should be included on all customs
and survey forms.
Data issue: Statistics on the gross value of goods trade do not account for double
counting of trade from the value of imported intermediate inputs in exports. They
also render information about country of origin relevant only for the last stage of
production. International Input-Output databases are seeking to address this
problem from the top down, but rely on the gross estimations and assumptions of
Leontief type modeling to estimate the embodied imports in exports (see page 39
below). The situation could be helped, if not solved, by more useful broad categories
in international trade statistics that identify customized vs. generic intermediate
goods
22
that might be used to link imports and exports flows.
INTERNATIONAL TRADE IN SERVICES
Data gaps are especially acute in services, where product and geographic detail has
historically been lacking and vast inferences are made to settle national accounts, even in
domestic industries. While the situation is improving (especially in Europe), the easy
availability and richness of trade in goods data in datasets such as COMEXT and
COMTRADE has tilted research and policy related to the impact of international trade
towards the goods sector. Research on the goods sector has contributed greatly to our
understanding of international trade and its impacts on various national economies and
industries, but the lack of similar detail, geographic coverage, and quality on data on
international trade in services has created a significant knowledge gap (Jensen, 2011).
Why are the data resources related to services so poor? One reason is that the data are
difficult to collect. While companies might track the source of many physical inputs to
manufacturing, for warranty or quality control purposes, services expenditures are
typically grouped into very coarse categories in company records, such as “purchased
services” In business statistics, services inputs are often grouped with goods as
“purchases of goods and services.” The absence of tariffs on services, and their non-
physical character, means that no customs forms are filled out and little if any
administrative data are generated when service work moves across borders. The Manual
on Statistics of International Trade in Services (2002) frames the issues as follows
(section 1.21, p. 4):
Measurement of trade in services is inherently more difficult than measurement of
trade in goods, inasmuch as services are more difficult to define. Some services are
defined through the use of abstract concepts rather than by pinpointing any specific
physical attribute or physical function. In the case of trade in services, unlike that of
trade in goods, there is no package crossing the customs frontier with an
internationally recognized commodity code; a description of the contents;
21
It is important to note that inconsistencies in reporting can also arise because of intrinsic differences in
trade reporting or because specific business practices result in complicated goods flows. For instance, the
exporting country may not know the ultimate destination for exports but importing countries are still
required to report the country of origin. If any intermediate processing takes place, the country of origin
may or may not be reflect this stage of production. So, bilateral reconciliation studies can correct errors but
also lead to better understand of the global value chain itself.
22
The current revision of the Broad Economic Categories (BEC) under development by the UN Statistical
Division proposes a division of this sort for intermediate goods in international trade for both goods and
services.

18
information on quantity, origin and destination; and an invoice. Nor is there an
administrative system associated with customs duty collection that is practiced at
assembling these data. Obtaining the required information on services trade, once
defined, is dependent on the reaching of a common understanding of concepts with
data providers. Measurement of trade services relies on information that may be
reported either from business accounting and record-keeping systems or by
individuals, and on a variety of data sources, including administrative sources and
surveys, and estimation techniques.
Another reason why services trade has received less attention from data producers and
policy-makers is that service work has historically been thought to consist of non-routine
activities that require face-to-face contact between producers and users. Services as
different as haircuts and legal advice have traditionally been consumed, in place, as soon
as they are produced. The customized and ephemeral nature of many services has led
them to be considered “non-tradable” by economists or at least very ‘sticky’ in a
geographic sense relative to the production of tangible goods. Because of this, there has
been little motivation to collect detailed information on international trade in services in
the past.
Finally, services have long been viewed as ancillary to manufacturing, either as direct
inputs (e.g. transportation) or as services provided to people who worked in
manufacturing (e.g. residential construction, retail sales, etc.). As such, services have
been viewed as a by-product, not a source, of economic growth. Thus, data collection on
services has historically been given a low priority by policy makers and statistical
agencies (Sturgeon et al, 2006).
These conditions and attitudes are changing quickly. Almost all of the defining features
of services: that they are non-tradable, non-storable, customized, and insensitive to price
competition are changing in ways that enable and motivate international sourcing
(through intra-group and external sourcing). As a result, task fragmentation and trade in
services is burgeoning, both domestically and internationally. With computerization and
inexpensive data storage, services can be stored and reused. Tariff and non-tariff barriers
to international trade in services are falling. Global “business process” service providers
such as Wipro and IBM Global Services have come onto the scene. The costs of voice
and data communications have plummeted with the rise of the Internet. As a result,
services have become the focus of intense international competition and dynamic
innovation. With standardization, commodification, and increasing scale, labor inputs to
services have become more sensitive to costs, providing enterprises with the motivation
to take advantage of the new domestic and international sourcing options for a wide range
of services and business functions, including software coding, “back office”
administrative tasks, sales, customer service, and even elements of R&D.
The rising importance of international trade in services, especially in trade negotiations,
led to the 1995 General Agreement on Trade in Services (GATS). This, in turn,
increased demand for more comprehensive and better data on trade in services. In
response the Interagency Task Force on Statistics of International Trade in Services
(TFSTIS)
23
issued its first Manual on Statistics of International Trade in Services
23
The ITFSTIS is mandated by the United Nations Statistical Commission and convened by the
Organization for Economic Cooperation and Development (OECD) with representatives from the World
Trade Organization (WTO), the United Nations Statistics Division (UNSD), the International Monetary

19
(MSITS) in 2002, updated in 2010 as the Extended Balance of Payments Services
(EBOPS 2010) classification.
24
In Europe, trade in services data are an integral part of the balance of payments (BoP)
information provided by central banks, though NSIs may provide data to central banks in
some instances. Data collection methods are uneven; some EU Member States collect
trade in services information from administrative data, some from surveys, some use
estimation techniques, and some use a combination of these methods. Eurostat publishes
services trade data in flows of value (in Euros) between residents and non-residents as
debits and credits to national accounts about 90 product categories based on the EBoPS
2010.
25
Data gap: Product detail in services trade. With about 90 product categories trade in
services detail in Europe is in far better shape than in the United States, where the
Bureau of Economic Analysis collects import and export data for only 23 service
product categories (up from 17 in 2003). Statistics Canada collects only 28, and the
OECD, which relies on member countries for data, publishes only 11. Contrast the
poor detail in traded services with detail on goods in the COMEXT database (9,000
product codes in CN-8) and the magnitude of the data gap becomes clear. This
paucity of detail in services means that we have little information about what is
happening in the service product categories that have been mentioned as opening up
to international sourcing, e.g. back-office functions such as accounting, customer
support, R&D and software programming. What is less clear is if the detail on the
goods side will need to be maintained. With roughly equal numbers of products in
goods and services (about 150 product classes each at the four-digit level) the UN’s
Central Product Classification (CPC) and equivalent European Central Product by
Activity (CPA) probably provide the appropriate level of detail. Services should also
be clearly mapped to the list of support business functions contained in international
sourcing surveys (as discussed on page 23 and shown in Appendix B. Definitions of
Seven Business Functions and Correspondence with Central Product Classification
(CPC, ver. 2)
Data gap: Geographic detail in services trade. A major limitation of the trade in
services data published by Eurostat is that only countries in the European Union,
Euro area, and EU Member States plus Croatia, Turkey, Norway, Iceland,
Switzerland, the United States and Japan are reported. India, for example, a major
location for the offshoring of service work, is not represented. Of course, data from
non-EU countries may only be published if Eurostat has made an agreement with
them to disseminate data. Eurostat should pursue agreements with a full range of
current and potential trading partners.
Data issue: Poor data quality in services trade. Because of the afore-discussed issues,
data quality for trade in services tends to be low. However, the Interagency Task
Force on Statistics of International Trade in Services based at the UN Statistical
Division has a stated commitment to help the producers of statistics improve the
quality of data on traded services, and has requested that a task force be set up to
build capacity in this area.
Fund (IMF), the Statistical Office of the European Union (Eurostat), the United Nations Conference on
Trade and Development (UNCTAD) and the World Tourism Organization.
24
See:
http://unstats.un.org/unsd/tradeserv/tfsits/manual.htm
25
The exact number varies because there are mandatory and non-mandatory items and different levels of
EBoPs.

20
FOREIGN AFFILIATES AND FOREIGN DIRECT INVESTMENT (FDI) STATISTICS
MNEs have long been a focus of research and debate among scholars of the global
economy. A central question of research in the field of International Business and
Development Studies is why enterprises choose to take on the risk and expense of FDI
rather than engaging in simple arms-length trade. This work has examined and debated
the methods, timing, and motivations of MNEs and the degree that they acted as conduits
for the transfer of capabilities from developed to developing countries (Lall, 2000). In
addition to providing a mechanism to gain the advantages of international trade
mentioned already, motivations for FDI have been identified in theory as 1) exploitation
of monopolistic advantage in superior products by locating production across tariff
barriers (Hymer, 1960), and 2) moving production of older products to less developed
countries to wring additional value from fully amortized technology and equipment while
making way for new products at home (Vernon, 1966; 1979). The “eclectic paradigm,”
or OLI model developed by Dunning (1977), argues that MNEs form when
internationalization costs are lower inside the enterprise than when trading externally.
Specifically, MNEs provide three cost advantages, Ownership (brands, organizational
and operational skills, and scale benefits), Locational (access to lower cost materials,
labor, or taxes or tariffs) and Internalization advantages (lowering costs through the use
of international licensing or joint ventures).
While global sourcing is often channeled through international MNE affiliates (sourcing
option #3 in Figure 3), the rise of global suppliers means that FDI has become
commonplace at every level of the value chain, and that international sourcing from
independent suppliers (sourcing option #4 in Figure 3), may well connect MNE to MNE
(Sturgeon and Lester, 2004; Gereffi and Sturgeon, forthcoming). As a result, the ability
to link FDI statistics to the enterprise groups involved has become an important
requirement for understanding the processes of economic globalization.
Eurostat’s investment position dataset from the balance of payments provides data on
inward and outward foreign direct investment abroad (equity capital and reinvested
earnings) for about 70 industries (NACE revision 2) and nearly 200 partner countries.
Summary tables are provided for industry and geography, both within Europe and in
various recipient regions (e.g., NAFTA, etc.).
In Europe data is available on foreign affiliates in the inward and outward Foreign
AffiliaTes Statistics (FATS) datasets.
26
There are three main variables in the Outward
FATS data set, namely ‘number of enterprises’, ‘turnover’ and ‘number of persons
employed’. For a limited number of countries ‘value added at factor costs’, ‘gross
investments in tangible goods’, and ‘personnel costs’ are published as well. The data are
available for nearly 200 recipient partner countries and many useful country groupings.
Data on foreign controlled enterprises in the EU, known as Inward FATS, is much richer,
with 11 main variables:
1. number of enterprises
2. turnover
3. production value
4. value added at factor cost
5. total purchases of goods and services
26
The OECD refers to Foreign Affiliate Trade in Services as “FATS”, which can cause confusion.

21
6. purchases of goods and services purchased for resale in the same condition as received
7. gross investment in tangible goods
8. personnel costs
9. number of persons employed
10. number of R&D personnel.
11. total intra-mural R&D expenditures
The nationality of the Ultimate Controlling Institutional Unit (UCI) or Global Group
Head is also collected and data is published for the 27 EU countries for about 130
activities at different NACE breakdowns.
In terms of ownership and control, the definitional bar is set higher (50% of voting rights)
for inclusion of affiliates in FATS than in FDI dataset (10% of voting rights). Because of
this, the FATS population can be seen as a sub-group of the population of FDI
investments; in other words, affiliates are a special case of FDI where the Ultimate
Controlling Enterprise (UCI) has either direct or indirect controlling interest. So, FDI
statistics cover equity investment while FATS statistics provide business statistics on
affiliates. These are quite detailed in the case of inward FATS, and less so in the case of
outward FATS.
Data gap: In inward FATS the foreign-owned enterprise population cannot currently
be identified among trading enterprises, so information about their imports, exports,
and sourcing practices cannot be isolated. This situation could improve in the near
future when the Trade in Enterprise Characteristics (TEC) initiative (see page 35)
identifies foreign affiliates in Structural Business Statistics data sets.
Data gap: In outward FATS no information about outward investors is collected. This
could be easily remedied because these UCIs are in the business registers of EU
member countries and have business statistics collected on them. The new
EuroGroups Register (see page 37) will help to fill this gap, but eventually enterprise
structures outside of Europe will also need to be tracked, most likely with
international cooperation.
DATA RESOURCES FOR INTERNATIONAL SOURCING, A REVIEW
The rise of international sourcing (via affiliated trade and external international sourcing)
has led the users and providers of official statistics to acknowledge a growing knowledge
gap in regard to the location of value added, industrial capabilities, and other important
statistical indicators related to trade and economic globalization. A spate of recent
conferences, reports, and data enhancements efforts led by Eurostat, the WTO, UNIDO,
OECD, UNSD, the World Bank, the ILO and many others reflect these concerns. The
sense is that the data gaps are rapidly growing wider.
As discussed earlier, the roots of international external sourcing can be found in the
experiments with external international sourcing by a handful of pioneering retailers (e.g.,
JC Penny, Sears) and manufacturing enterprises (e.g., IBM, General Motors,
Volkswagen, Fairchild Semiconductor) that set up production in East Asia, Mexico, and a
handful of other locations around the world beginning in the late 1960s with the explicit
purpose of lowering production costs and exporting finished goods back to home markets
(Fröbel et al, 1980; Dassbach, 1989; Gereffi, 1994). Over time retailers and branded
manufacturers in wealthy countries became more experienced with international

22
sourcing. MNEs too began to stress the “locational advantages” of exporting from places
with low operating costs (as referenced in Dunning’s OLE model above). In response,
developing countries acquired the infrastructure and capabilities needed to sustain more
complex operations, and suppliers upgraded their capabilities in response to larger orders
for more complex goods.
In the 1990s, as the integration of the transition economies opened up vast new areas for
external international sourcing, the most successful U.S.- and Europe-based suppliers
quickly became huge global players, with facilities in scores of locations around the
world (e.g., Siemens, Valeo, Flextronics). A handful of elite East Asian suppliers (Pao
Chen, Quanta, Foxxcon – all based in Taiwan with extensive operations on Mainland
China) and trading companies (Li & Fung – based in Hong Kong but with links to
contract factories worldwide) also grew rapidly by taking on more tasks for MNE
affiliates and global buyers. These enterprises expanded production, not only in China,
but also in other Asian countries and more recently in Africa, East Europe, and Latin
America as well. As the resources in this “global supply-base” improved, more lead
enterprises gained the confidence to embrace the twin — and often entwined — strategies
of external and international sourcing.
This process has been driven in part by competitive dynamics. Firms are constantly
searching for better options as they carefully watch the performance of other enterprises
in their industry. When one of these actions is successful it is likely to be retained by the
enterprise and eventually become routine (Nelson and Winter 1982). Should enterprises
using these new methods prove successful, other enterprises in the same industry are
likely to see them as “best practice” and respond with similar strategies. If publically
held enterprises chose to ignore such lessons, they can be swiftly compelled to do so by
financial markets (Williams, 2000). This is of course not purely an evolutionary story,
since management fads can lead groups of enterprises to make poor choices (DiMaggio
and Powell, 1983). Fund managers and financial analysts can fall into the same traps of
“conventional wisdom” as corporate managers, and can get things famously wrong.
Nevertheless, the fact remains that the trend toward using external suppliers and vendors
for everything from accounting to manufacturing to logistics initiated a co-evolutionary
dynamic between lead enterprises and large suppliers (Sturgeon and Lee, 2005).
International external sourcing drives increases in scale and competency in the supply-
base, which in turn stimulates new rounds of external sourcing because better supply base
capabilities make it more attractive for lead enterprises. Thus, the process of industry co-
evolution typically extends beyond the intentions of the pioneering enterprises as it opens
up new possibilities for the enterprises that follow. Today, the existence of highly
competent and diverse global supply base provides opportunities for even SMEs and
start-up enterprises to either be “born global” or quickly scale up their activities via
external international sourcing (Moen and Servais, 2002; Knight and Cavusgil, 2004).
In sum, international external sourcing emerged in part from a self-reinforcing cycle of
external sourcing and supply-base upgrading that connects enterprises across developed
and developing countries. It is important to note that external sourcing does not exclude
the involvement of MNEs; today’s MNE is as likely to be a supplier to other MNEs (e.g.
Foxconn) than to be a brand-carrying MNE in its own right (e.g., Apple).
Today, external sourcing networks have grown up across the world to offer ready access
to highly efficient, large-scale capital and low cost labor, both skilled and unskilled.

23
Leading-edge production, services, and logistics capacity can be hired easily and as
needed. While evidence from recent research suggests that most European enterprises
still engage in little if any international sourcing (Nielsen, 2008; Alajääskö, 2009), the
largest, most technologically adept, and most economically important enterprises are
deeply globally engaged (Bernard et al; 2005; Mayer and Ottaviano, 2007; Slaughter,
2009; Brown and Sturgeon, forthcoming). While enterprises may pull back to domestic
sourcing during severe economic downturns, longer-term analysis suggests that
enterprises increase and even accelerate international sourcing when demand accelerates
in a recovery (Sturgeon, 2003; Johnson and Noguera, 2012). If this pattern remains
consistent, further accelerations in international sourcing can be expected with full
economic recovery.
The frontiers and capabilities of economic globalization continue to evolve very rapidly.
The process is very unlikely to fully reverse; if anything, it will accelerate. At the same
time, the processes of economic globalization are complex, uneven, and take a variety of
forms. To understand the character and implications of economic globalization and put
policies in place that respond to it effectively, it is essential to have statistical resources in
place to adequately characterize international sourcing, especially external international
sourcing. As MNEs and external international sourcing networks continue to expand and
the technical, psychological, and (perhaps) political barriers to relying on them diminish,
it will be critical to have the needed statistical resources in place to track them, gauge
their consequences, and respond to them with evidence-based policy responses.
International sourcing surveys can help by making direct measurements of sourcing
patterns, including direct comparisons of sourcing from international affiliates and
external international sourcing to unaffiliated enterprises.
INTERNATIONAL SOURCING SURVEYS
There is a pervasive dynamic working against the usefulness of current business statistics.
On one hand, production is becoming increasingly bundled with services, and on the
other hand, it has become easier to fragment the value chain geographically. While we
know very little about service inputs, a range of largely intangible “support” functions
(e.g., R&D, sales, marketing, IT systems, etc.) clearly add value, and like physical inputs,
these support functions are available from suppliers and service providers outside the
enterprise and in a variety of locations around the world (Dossani and Kenny, 2003;
Fernandez-Stark et al, 2011).
These trends require a standardized method for grouping enterprise activities to
supplement the main production function of the enterprise – i.e., the business function –
and new surveys to capture how they are sourced and to quantify their cost to the
enterprise. Business function surveys are useful for collecting new information on
economic globalization for three reasons. First, because they consist of intangible
services, the value added by support functions has proven very difficult to capture,
classify and quantify. Second, the parsimony of business function lists (see Table 1)
reduce respondent burden, while still generating new data that can be compared and
aggregated across enterprises, countries and industries (assuming harmonized lists).
Third, experience with pioneering surveys suggest that data quality tends to be high
because business functions are in keeping with the way many managers think about and
account for their operations (Brown, 2008; Nielsen and Luppes, 2012; Brown and
Sturgeon, forthcoming).

24
Not only is the business function classification useful for measuring service inputs in any
type of organization, but also as a high-level stand-in for occupational categories, since
jobs can also be tallied according to their general function within and across
organizations, industries, and geographies.
Table 1. Seven business functions used in the Eurostat survey on international sourcing
In the European International Sourcing survey, seven business functions (plus a residual “other” category) were identified using
the European Central Product by Activity classification (CPA).
1) Core/Primary business functions:
Production of final goods or services intended for the market or third parties carried out by the enterprise and yielding income.
The core business function usually represents the primary activity of the enterprise. It may also include other (secondary)
activities if the enterprise considers these to comprise part of its core functions.
Support business functions:
Support business functions (ancillary activities) are carried out in order to permit or facilitate production of goods or services
intended for sale. The outputs of the support business functions are not themselves intended to be directly for sale. The
support business functions in the survey are divided into:
2) Distribution and logistics:
This support function consists of transportation activities, warehousing and order processing functions. In figures and tables,
“Distribution” is used as an abbreviation for this function.
3) Marketing, sales and after sales services including help desks and call centers:
This support function consists of market research, advertising, direct marketing services (telemarketing), exhibitions, fairs and
other marketing or sales services. Also including call-centers services and after sales services, such as help-desks and other
customer supports services. In figures and tables “Marketing, sales” is used as an abbreviation for this function.
4) ICT services:
This support function includes IT-services and telecommunication. IT services consist of hardware and software consultancy,
customized software data processing and database services, maintenance and repair, web-hosting, other computer related and
information services. Packaged software and hardware are excluded. In figures and tables “ICT services” is used as an
abbreviation for this function.
5) Administrative and management functions:
This support function includes legal services, accounting, bookkeeping and auditing, business management and consultancy,
HR management (e.g., training and education, staff recruitment, provision of temporary personnel, payroll management, health
and medical services), corporate financial and insurance services. Procurement functions are included as well. In figures and
tables “Administration” is used as an abbreviation for this function.
6) Engineering and related technical services:
This support function includes engineering and related technical consultancy, technical testing, analysis and certification.
Design services are included as well. In figures and tables ”Engineering” is used as an abbreviation for this function.
7) Research & Development:
This support function includes intramural research and experimental development. In figures and tables “R&D” is used as an
abbreviation for this function.
Note: In the 2012 Survey Engineering and related technical services were combined with R&D.
Source: Nielsen 2008
Business function lists
Enterprises, or their main operating units
27
typically have one or more main output,
consisting of goods, services or a mix of both. In a statistical context, the business
function that produces the main output(s) typically determines the enterprise’s industry
27
Large enterprises may have several distinct operational units with distinct outputs. These are variously
called divisions, lines of business, or business segments. For such enterprises it is sometimes best to collect
sourcing data at this level.

25
classification(s) using standardized activity/industrial codes (e.g., ISIC, NACE, or
NAICS). Inputs of goods are sometimes recorded in great detail, but services inputs have
proven difficult to capture or characterize. Business function surveys provide an easy
solution to this problem by providing a parsimonious, standardized, generic, mutually
exclusive, and exhaustive list of support functions (see Table 1). In the business function
frameworks developed so far, the main productive function of the enterprise has been
designated variously as “production” (Porter, 1985), the “core function” (Nielsen, 2008),
“operations” (Brown, 2008), and the “primary” business function (Brown and Sturgeon,
forthcoming). Even if the terminology used differs, the approach is similar in the sense
that it distinguishes between the primary business (output) function and a generic list of
functions that “support” it. While collecting economic data according to business
functions is still in an early stage of development, business function lists might provide
an initial, generic list of service inputs to complement industry-specific input product lists
that underlie input-output tables. Respondent burden would be lower than using the more
detailed classifications for services trade found in EBoPS or the Central Product
Classification (CPC). Full definitions of the seven business functions in Table 1 and
correspondence with the CPC (ver. 2) can be found in Appendix B. The main strength of
the business function approach is its potential to identify and measure support activities
and other intangible assets and service inputs to the enterprise (R&D or customer service
capabilities) in a way that is easily comparable across sectors and countries.
Using business function surveys to collect data on domestic and international sourcing:
The 2007 and 2012 Eurostat International Sourcing Surveys
Eurostat has been a leader in collecting international business function sourcing data.
28
Economy-wide ad-hoc surveys (covering the so-called non-financial business economy)
were carried out by the National Statistical Institutes (NSIs) of 12 European countries in
2007 and 14 countries in 2012. The 2007 survey asked about sourcing decisions made by
European enterprises in the period 2001–2006, and the 2012 survey for the period 2009-
2011. The focus of the surveys was on larger enterprises, as these were considered to be
the key drivers of international sourcing. A cutoff threshold of 100 or more employees
was used, although statistical offices in several countries decided to lower the threshold
to enterprises with 50 or more persons employed to increase the sample size and pick up
more enterprises. Samples sizes, employment thresholds, and preliminary response rates
for the 2012 Eurostat International Sourcing Survey is presented in Table 2.
The 2007 Eurostat International Sourcing Survey found that 16 per cent of the enterprises
with 100 or more employees had sourced one or more business function abroad. More
than twice as many enterprises in Ireland and the United Kingdom did so (38 per cent and
35 per cent, respectively). The two small and open Nordic economies, Denmark (25 per
cent) and Finland (22 per cent), were also significantly above the average. Germany (13
per cent) was just below the average.
At the time of writing this report, the results of the 2012 survey are only available for a
few countries (Denmark and the Netherlands). In Denmark, 19 per cent of all enterprises
with 50 or more employees sourced internationally in the period 2009-2011 (any
function). Manufacturing enterprises were the most likely to engage in international
sourcing, although the share in 2009-2011 fell slightly compared to 2001-2006. In the
2009-2011 period, the core function was the most commonly sourced internationally,
28
See:
http://epp.eurostat.ec.europa.eu/statistics_explained/index.php/International_sourcing_statistics
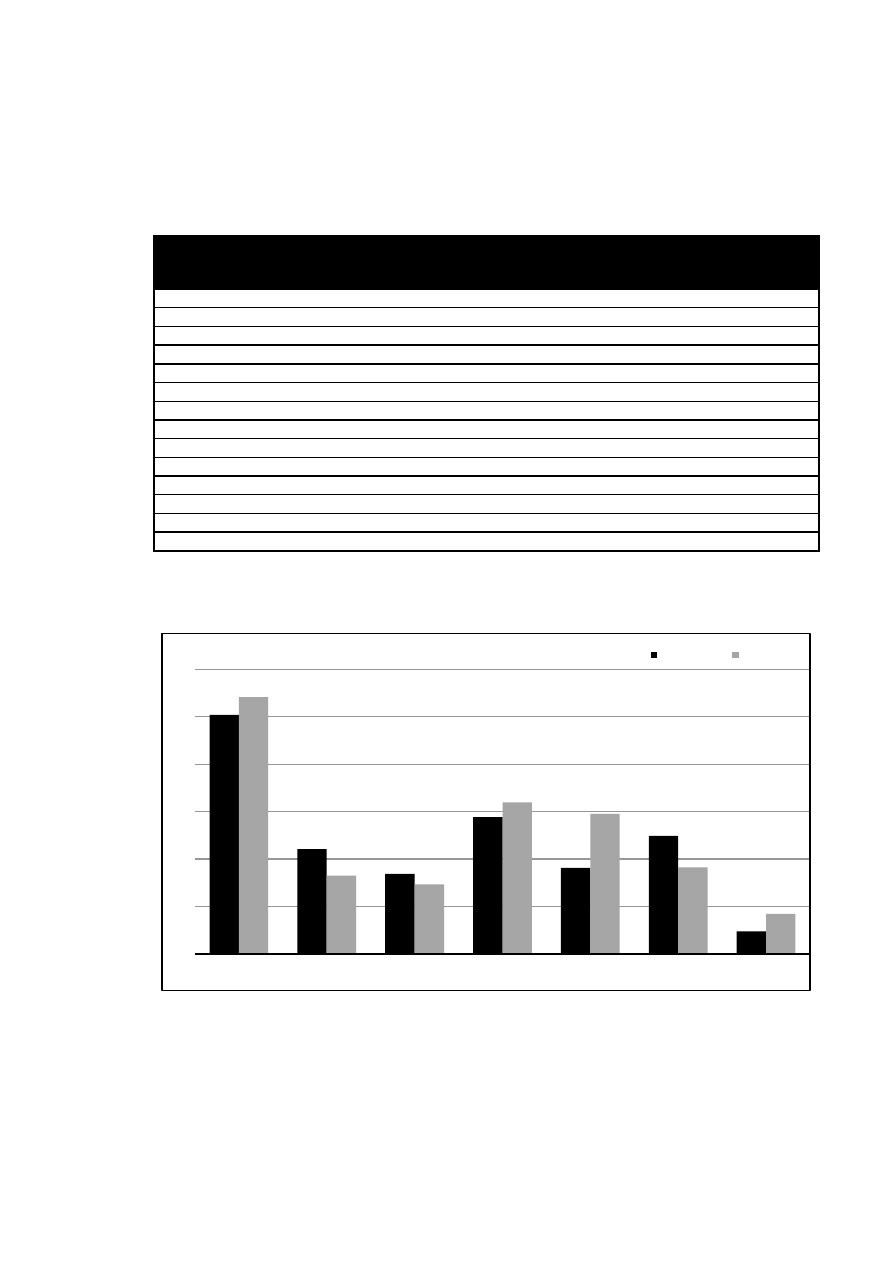
26
followed by ITC services. Instances of enterprises internationally sourcing administrative
functions increased substantially, while distribution and R&D/engineering both decreased
slightly (see Figure 4).
Table 2. 2012 Eurostat international sourcing survey, sample sizes and preliminary
response rates
Country
Sample size
Size Threshold
(minimum number of
employees)
Preliminary
response rate %
France
8,100
50
72
Portugal
1,000
100
92
Netherlands
2,200
100
79
Romania
3,000
100
96
Slovakia
1,300
100
78
Sweden
1,000
100
UA
Lithuania
1,000
100
UA
Latvia
600
100
95
Estonia
500
50
87
Ireland
1,400
100
41
Belgium
1,000
100
UA
Norway
2,300
50
94
Denmark
4,500
50
96
Finland
2,000
50
75
Source: Nielsen and Luppes, 2012, based on Eurostat data
Figure 4. Business functions sourced internationally by Danish enterprises engaged in
international sourcing, 2001-2006 and 2009-2001
Note: R&D and engineering one function in the survey covering 2009-2011, but was included as two functions for
2001-2006. Enterprises sourcing both in 2001-2006 have only been counted once in calculating the 2001-2006 shares.
Source: Nielsen, 2012, based on Eurostat-coordinated sourcing surveys
0
10
20
30
40
50
60
Core funciton
Distribution,
logistics
Marketing,
sales etc.
ICT services
Admin.
functions
R&D,
engineering
Other
functions
2001-2006
2009-2011
per cent

27
Quantifying sourcing in business function surveys: the 2011 National Organizations
Survey
Neither the 2007 nor the 2012 Eurostat International Sourcing Survey asked respondents
to quantify the value of their external and international sourcing, only to indicate if they
had made such choices or not. Both economic theory and case study research suggest
that managers often experiment with a variety of “make” or “buy” choices in regard to
both domestic and international sourcing (Bradach and Eccles, 1989; Berger et al., 2005).
Quantifying sourcing costs according to the four quadrants of Figure 2 is important
because enterprises can, and often do, use a combination of sources for specific business
functions. For example, the core/primary business function (e.g., component
manufacturing or assembly) may be externally sourced, but only as “overflow” work
when internal capacity is fully utilized. Or, enterprises might combine internal and
external sourcing for strategic reasons, such as pitting in-house operations against
external sources to create competition in the realms of cost, quality, or responsiveness.
Combinations of internal and external sourcing might show a transitional phase of
sourcing, the movement of work back in-house (sometimes referred to as insourcing), or
building up new in-house functions, and quantitative sourcing data collected over time
can capture these trends. Most importantly, quantitative information can reveal the scale
of external and international sourcing. With a binary answer, it cannot be determined if a
“yes” response to an international sourcing question represents a small or a large contract,
a small portion of the costs of the business function or most or even all of the function’s
costs.
Quantitative employment, wage, and sourcing information by business function were
recently collected in the United States by the 2011 National Organizations Survey (NOS),
funded by the National Science Foundation.
29
The purpose of the study is to generate
direct comparison of domestic employment characteristics with sourcing practices in
eight business functions according to all four sourcing options shown in Figure 2. The
2011 NOS was administered online and by phone to a representative sample of United
States businesses plus an oversample of the largest U.S. companies.
As they have been in the Eurostat International Sourcing Surveys, questions about
business functions in the 2011 NOS were apparently well understood and easily answered
by senior executives. Respondents at large and small enterprises, non-profits, and public
organizations were able to quantify the number of jobs, wage ranges, and sourcing
“locations”
by business function according to their “best estimate.” For example, in the
336 completed surveys, only 4.5% (15) respondents indicated “don’t know” to the
question asking for the share of the organization’s total United States employment
according to business function. Of these, twelve were able to supply information about
ranges of employment for each function (e.g., 1-10%, 11-30%, etc.), leaving only three
respondents unable to answer the question. For each of the eight functions (unlike the
Eurostat surveys, the NOS survey asked about sales and marketing functions separately
from after sales service functions) the survey asked for sourcing costs in each of the four
quadrants of Figure 2 as a per cent of total costs for the function (see Figure 5).
30
29
See:
http://scienceofsciencepolicy.net/award/national-survey-organizations-study-globalization-
innovation-and-employment
30
In the 2011 NOS survey, sourcing “costs” are defined as follows. For a manufacturing business the costs
of goods sold (COGS) includes materials, labor, and factory overhead. For a retail business COGS what the
company pays to buy the goods that it sells to its customers. For a service business, it is the cost of the
persons or machines directly applying the service, typically called “cost of sales.” by accountants. For a
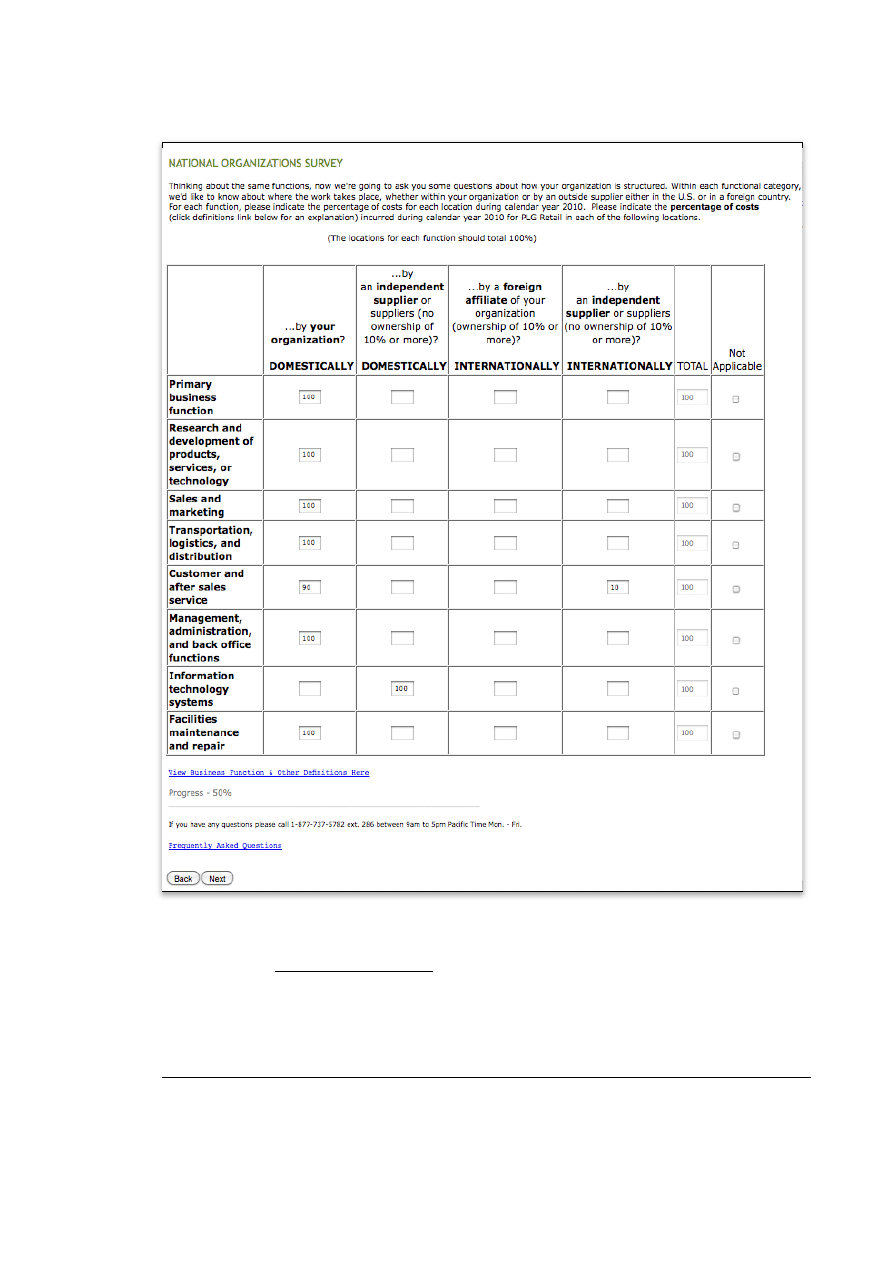
28
Figure 5. Data collection grid for four sourcing options by business function
Source: National Organizations Survey
Data gap: Valuation of sourcing. In the 2007 and 2011 European surveys,
respondents only provided binary responses: indicating yes or no by checking a box
(an exception was R&D sourcing costs, which were quantified). Since enterprises
use mixed sourcing practices and a quantitative measure is required to judge the
consulting company, for example, the cost of sales would be the compensation paid to the consultants plus
costs of research, photocopying, and production of reports and presentations. For a public organization,
costs are typically defined in its operating budget.

29
magnitude of international sourcing, future international sourcing surveys in Europe
should collect information on the value of sourcing for each business function.
Data gap: Current sourcing. In the 2007 and 2011 surveys, respondents were asked
about sourcing events that occurred during a specific time period. Because of this,
business functions externally sourced before the period were not captured.
Quantitative panel data on international sourcing will reveal trends more reliably
than asking respondents to recollect sourcing decisions made several years earlier.
Data gap: External domestic sourcing. In the 2007 and 2011 surveys, no data was
collected about external domestic sourcing (quadrant 2 of Figure 2), although a
distinction was made between intra-EU sourcing and extra-EU sourcing. Domestic
sourcing is important because it can draw attention to business functions soon to be
sourced internationally, or a function that relies on proximity even if it is possible to
be sourced externally. Either way, the implications for employment and policy
making are important. When specific business functions are observed being
externally sourced in large scale, either domestically or internationally, the data
might be capturing the birth of a new industry such as call center services or IT
services.
Data issue: For quantitative international sourcing and other new data, a threshold
may need to be crossed: for certain datasets, statisticians may need to accept more
subjective data sources. More flexibility is needed in regard to data collection
methods. This can mean moving away, in some instances, from an accounting model
where respondents are asked to access and provide data from official company
records. In subject areas where companies do not keep detailed and consistent
records (e.g., purchased services, international sourcing), surveys may need to rely
on the “best estimates” of informants. The key to data quality, in these instances,
will hinge on the quality of the respondent — reaching “the right person” at the
target enterprise or organization — and on the crafting of survey question to reflect
the day-to-day experiences of practitioners.
TRACKING SCIENCE, TECHNOLOGY, AND INNOVATION (STI) IN GLOBAL VALUE CHAINS
Research and development (R&D) and Innovation are widely believed to be a main
source of economic development. The central idea is that new scientific discoveries and
new technologies lead to new processes and products and these in turn lead to increased
industrial output, exports, and employment.
31
In Europe, following the “Oslo Manual,”
the definition of innovation has gravitated toward the activities in the private sector,
occurring in the context of the business practices and the open marketplace: "Innovation
is defined as the introduction of new or significantly improved products (goods or
services), processes organizational methods, and marketing methods in internal business
practices or in the open marketplace” (OECD/Eurostat, 2005).
32
As a result of this broad agreement and interest in R&D and innovation, the data
resources to measure domestic R&D and innovation have improved greatly. R&D
expenditures by business, government, higher education, and private non-profit
organizations are collected and published by Eurostat by source of funds, by type of
costs, by type of economic activity (NACE), by enterprise size class, by type of R&D
(basic, applied, and experimental research), and several other variables. R&D personnel
31
For results of the 2013 Innovation Union Scoreboard of the EU, see
http://ec.europa.eu/enterprise/policies/innovation/facts-figures-analysis/innovation-
scoreboard/index_en.htm
32
Recently the United States’ National Science Board adopted this definition as well (NSB, 2012).
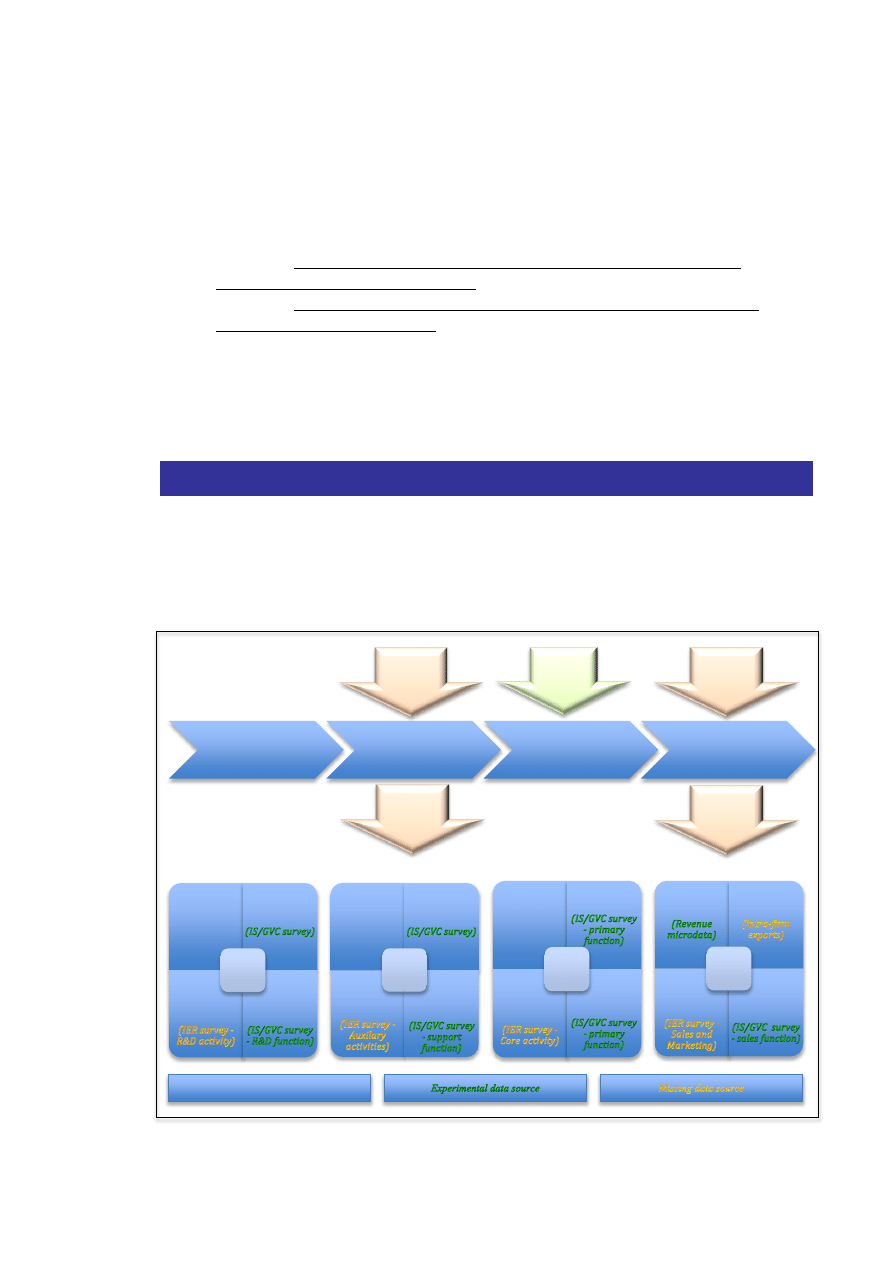
30
data is available in full-time equivalent and head count (HC) form, and as a % of
employment and as a % of labor force. The data is further broken down by occupation, by
qualification, by gender, by size class, by citizenship, by age groups, by fields of science.
Data is published for all EU Member States (EU-27, EU-15 and EA-17), plus Candidate
Countries, EFTA Countries, the Russian Federation, China, Japan, the United States and
South Korea.
Data gap: Links between STI statistics and more detailed information on
international trade in R&D services
Data gap: Links STI statistics international sourcing of R&D function from
international sourcing surveys
International sourcing surveys ask about imports of R&D from both affiliates and
independent suppliers (and quantitative information collected). For enterprises that
engage in international sourcing of R&D, additional questions could be added to gain a
fuller picture of the nature of the R&D activities being performed.
SUMMARIZING THE DATA GAPS AND ISSUES
Figure 6 shows the traditional data sources to characterize internationalization and then
adds the sixteen sourcing reams realms in Figure 3 (four each for R&D, Inputs,
Production, and Distribution of outputs). Established, experimental, and missing
statistical resources are indicated by black, green, and yellow font colors.
Figure 6. A simple value chain with sourcing possibilities and data resources
Internationalization (trade and FDI)
Globalization (adds domestic and international sourcing)
Research, Development,
and Product Design
Inputs
Production
Marketing, Sales,
Distibution, and After-
sales Serivce
Domestic
intra-group
sources
(R&D Survey,
CIS)
International
intra-group
affiliates
Domestic external
suppliers
International
external suppliers
Four
sourcing
options
Domestic
intra-group
sources
(Industrial
input data
)
International
intra-group
affiliates
Domestic
external suppliers
International
external suppliers
Four
sourcing
options
Domestic
intra-group
sources
(Industrial
output data)
International
intra-group
affiliates
Domestic external
suppliers
International
external suppliers
Four
sourcing
options
Domestic
intra-group
sources
International
intra-group
affiliates
Domestic external
suppliers
International
external suppliers
Four
sourcing
options
Established data source
Intermediate
Imports
(Comext)
Final Imports
(Comext)
Intermediate
Exports
(Comext)
All Exports
(Comext)
Inward FDI
(BOPS)

31
Examining the upper section of Figure 6 (internationalization) from left to right, flows of
goods inputs (imports and exports) can be observed through statistics on international
trade in (intermediate) goods. Inward investment statistics (Inward FDI) are available by
industry, providing some notion of the scale of foreign investment in specific sectors, but
the investment data cannot be tied to enterprises. Outward investment data is also is not
available in enough detail to be useful for observing or even estimating the activities of
foreign affiliates owned by European enterprises, so it is omitted from in Figure 6.
Examining the lower section of Figure 6 (domestic and international sourcing) from left
to right, information about in-house domestic R&D activity is captured by R&D surveys,
while R&D sourced in foreign affiliates is international sourcing surveys, which asks if
“R&D, engineering and related technical services” are sourced in either foreign affiliates
or internationally to independent suppliers. No data is collected on R&D services
externally sourced domestically except by the Inter-Enterprise Relations survey
33
, marked
as missing because it was only fielded once, in 2003. As discussed above, data on
internal R&D activities is relatively rich, but it cannot be easily linked to information
trade in R&D services at the European level. However, there is scope for research that
links enterprise-level results from European R&D and innovation surveys to survey data
on international sourcing of R&D from the experimental international sourcing survey.
Moving to the second value chain stage in Figure 6, inputs, it is clear that intermediate
sourcing data for other support functions are harder to come by. There is no direct data
collected about in-house provision of specific support services. Occupational
employment statistics provide some clues in this regard, but job descriptions cannot be
attributed to specific internal support functions without making some gross assumptions.
While data in purchased inputs is included in the micro-data that underlie national input-
output tables, it does not generally specify goods vs. services (much less contain product
detail) or domestically sourced vs. imported inputs.
Rich information on the third value chain stage in Figure 6, production, can be found in
structural business statistics (SBS), and coverage for services was improved in 2008.
However, for European MNEs, information about the activities of affiliates is largely
missing from outward FATS statistics. Information about the sourcing of enterprises’
primary function is available only from the experimental international sourcing survey.
Finally, some data on sales and distribution (i.e. wholesale and retail trade) can be found
in turnover data collected in SBS, and outward FATS collect turnover and persons
employed at affiliates. The experimental international sourcing survey asks if sales and
distribution services are provided by affiliates or externally sourced from independent
foreign enterprises. No data is currently collected on the use of domestic suppliers for
sales, distribution, or aftersales service.
Several things become clear in this discussion. First, data on domestic sourcing is
completely lacking. Second, the international sourcing survey is the only source for data
on international sourcing to affiliates or independent suppliers, suggesting that this
experimental survey needs to be further enhanced to collect more detail and made
permanent and enhanced. Third, because the EBoPS classification for trade in services
has limited correspondence with other classifications, links to enterprises can only be
made for trade in goods, and so far only at the level of individual member states. Fourth,
33
See
http://epp.eurostat.ec.europa.eu/statistics_explained/index.php/Inter-enterprise_relations

32
and perhaps less obvious or even masked by Figure 6, is the fact that the various data
sources listed have different conceptual frames, sample frames, periodicities, levels of
detail, and modes and levels of accessibility. This can lead to situations where the
statistical outputs of the various data sets cannot be readily compared or linked because
the definitions, concepts and methodologies applied are partially or even totally different.
Lack of compatibility and consistency make it difficult for data sources to be used in
combination to tell a holistic story of economic globalization or provide support for the
four main uses for statistics on economic globalization mentioned on page 10: enterprise
characteristics, globalization trends, employment effects, or innovation effects.
There are many initiatives in the EU to address and improve above issues.
The Eurostat International Sourcing Survey has already been discussed at length,
including gaps and deficiencies in the current survey.
Another is the European Statistical System Network (ESSnet) on Profiling, which is
developing a methodology to identify, at the EU level, enterprises within
multinational enterprise groups through an analysis of their legal, operational and
accounting structure, delineated in terms of legal units.
The ESSnet on Consistency Project is working to create consistent concepts,
definitions and methodologies within the European Statistical System.
Inconsistencies arise from incoherent concepts, definitions and methodologies, as
well as from different implementation in Member States. Issues include target
populations, sample frames, reference periods, classifications and their applications,
as well as characteristics and their definitions. It would be advisable for all business
related statistics, including statistics on international trade, to use common
classifications like ISIC and CPC (NACE and CPA in the European context), or at
least classifications that can be aggregated to ISIC/CPC (NACE/CPA). Where
appropriate, compatibility with the System of National Accounts (SNA) framework,
the international statistical standard for the national accounts adopted by the United
Nations Statistical Commission (UNSC) and the European System of Accounts
(ESA) should be pursued.
There are efforts to in Eurostat to specify the Nature of Transactions (NoT) in
international goods trade (purchase/sale, work under contract, etc.) for balance of
payments and national accounts purposes. The flow of intermediate and final goods
in some of these arrangements is sometimes characterized as “processing trade.”
Processing trade typically occurs when parents or contract issuers send intermediate
inputs from home countries to international locations where “contract production” is
performed by affiliates or independent suppliers, sometimes in export processing
zones (EPZs), where no duties are charged for imports and finished goods are
imported back to home countries under preferential agreements that do not charge
duties on foreign value added. The problem being addressed by these efforts (in
cooperation with the United Nations Economic Commission for Europe) is that the
preferential agreement programs do not necessarily track all transactions related to
processing because it relies on customs and VAT rules for compliance. Enterprises
engaged in processing trade do not have incentives to use these customs processing
procedures because tariff rates are zero.
Finally, work is also underway on a European System of Business Registers
(ESBRs) within the framework of the European Statistical System Vision

33
Implementing Programme (ESS.VIP)
34
. This would allow many of the data gaps
just discussed to be more easily filled.
Several of these efforts are discussed in more detail in Part III.
To summarize, four main inward and outward international flows have been identified in
the discussion so far:
1. arms-length trade,
2. intra-group trade,
3. external international sourcing, and
4. FDI.
Table 3 summarizes the most basic (e.g., domestic external sourcing is excluded)
information required for measuring the GVC engagement of enterprises, along with the
data sources and data gaps discussed in Part II.
Table 3. Information required for measuring the international flows at the enterprise level
Variable
Measure
Available?
Inward flows
Arms-length imports
Value by product and trading partner country
Yes. But there is no way to differentiate arms-
length from other transactions (intra-group or
externally sourced) in COMEXT or BOPs
international services transactions data.
There are no links between trading partners (IDs).
Intra-group imports
Value by product and trading partner
No. Not differentiated in COMEXT or BOPs
international services transactions data
Inward external
sourcing
Value of intermediate goods and services sold to
foreign customers by business function
(including R&D services)
Partially. The experimental international sourcing
survey has one question on inward sourcing, but
no information on the value of services are
collected
Inward FDI
Value of FDI by industry and recipient country
Yes, but there are no links to enterprise IDs
Outward flows
Arms-length exports
Value by product and trading partner country
Yes. But there is no way to differentiate arms-
length from other transactions (intra-group or
externally sourced) in COMEXT or BOPs
international services transactions data.
There are no links between trading partners (IDs).
Intra-group exports
Value by product and trading partner
No. Not differentiated in COMEXT or BOPs
international services transactions data
Outward external
sourcing
Value of sourcing by business function (including
R&D)
Yes. The experimental international sourcing
survey asks this question, but sourcing is valued
only for R&D
Outward FDI
Value of FDI by industry and recipient country
Yes, but there are no links to enterprise IDs and
very little information about foreign affiliates in
outward FATS data.
34
See
http://epp.eurostat.ec.europa.eu/portal/page/portal/pgp_ess/news/ess_news_detail?id=134606438&pg_id=2
737&cc=ESTAT_EUROSTAT

34
Table 4 summarizes the existing and missing GVC variables in the current European
statistical system based on the main established datasets (black font color in Figure 6). In
all cases links to enterprise identifiers (and therefore characteristics) at the enterprise
group level are missing. Without these links, research and the production of indicators
based on micro-data linking will not be possible.
Table 4. Existing and missing GVC variables in the European Statistical System (ESS)
Topic
Eurostat data set
Useful GVC variables
Missing GVC variables
Existing data sources
International Trade in
Goods
COMEXT
Value of trade by:
Product
Industry
Trading partner
Intra-group trade
International sourcing of intermediate and
final goods
International trade in
services
BOPS services trade
Value of trade by:
Product
Industry
Trading partner
Intra-group trade
International sourcing of services
Outward foreign direct
investment
BOPS outward FDI
Value of outward FDI by:
Industry
Trading partner
Links to parent
Affiliate characteristics
Inward foreign direct
investment
BOPS inward FDI
Value of outward FDI by:
Industry
Trading partner
Links to parent
Affiliate characteristics
Activities of European
MNEs abroad
SBS outward FATS
Affiliate turnover
Number employed
Parent characteristics
Intra-group trade
Activities of foreign MNEs
in Europe
SBS inward FATS
Affiliate turnover
Number employed
…many others
Intra-group trade
R&D
R&D survey
R&D spending,
employment, etc.
Links to enterprise characteristics
Links to trade in R&D services
International sourcing of R&D
Experimental data sources
International sourcing
IS/GVC survey
Sourcing by:
Business function
Affiliate or independent
supplier
Geographical location
Value of sourcing (cost of goods and
services)
In-house costs by function
Domestic sourcing by function
Domestic sourcing
Inter-industry
relations survey
Domestic sourcing by:
Core activity
R&D
Sales and marketing
ICT services
Value of sourcing (cost of goods and
services)
Missing business functions (management
and admin, transport and logistics,
facilities maintenance, etc.)

35
Part III: LEVERAGING MICRO-DATA RESOURCES
Governments collect data for the purpose of administering programs such as tax
collection, compliance with environmental protection laws, and the like. For this reason
such data is typically referred to as “administrative data.” In national statistical institutes
(NSIs) as well, more detailed “micro-data” underlie what is ultimately made available to
the public. NSIs usually have (or should have) legal access to tax records and social
security records. Administrative records for enterprises, known as “business registers”
are critical elements of the statistical system. Data in business registers typically include
business name, address, a unique establishment-level identifier, industry, employment,
and the identity of the enterprise that owns the establishment. Linked tax information can
include information on turnover, profits, and investments. Business registers can provide
comprehensive sample frames for surveys and provide rich information when linked to
data on individuals (work and wage histories, for example), international trade and other
statistics related to economic globalization. Because they are responsible for maintaining
and updating business registers, NSIs are well positioned to develop and maintain links
between business registers and other statistics.
The work of making fuller use of business registers and other administrative data is only
beginning. To state an important caveat again, administrative data are usually
confidential. Researchers in and out of government who have security clearance and
have their proposals accepted by the agencies that hold micro-data resources can gain
access (as long as agency personnel screen the results before the research is published)
and have conducted important research. But business registers and other micro-data
resources are only now being made more assessable, put to more general use, and —
crucially for the purpose of understanding economic globalization — linked
internationally.
TRADE BY ENTERPRISE CHARACTRERISTICS
A recent Eurostat initiative called Trade by Enterprise Characteristics (TEC)
35
represents
a major step forward because it links trade statistics to the enterprises that trade, creating
new information about classes of enterprises in Europe, including firm size and industry,
but also by ownership (domestic/foreign) and type of international engagement (i.e.,
exporters, importers, and both). Based on micro data linking of SBS, inward and outward
FATS, and VAT statistics, Figure 7 shows the share of Danish enterprises in each of
these latter categories. The figure reveals what has already been mentioned and will be
discussed again below: internationally engaged firms tend to have an outsized impact.
Because COMEXT and BoPS trade in services data cannot differentiate arms-length
trade from intra-group trade and trade from external international sourcing, the
picture provided by TEC is incomplete. Not only are ownership and direct
involvement in trade important, but information about the enterprises engaged in
external international sourcing might bring in enterprises that otherwise appear to
be outside of the trading system. Again, three types of trade need to be identified:
arms-length, intra-group, and external international sourcing.
35
See
http://epp.eurostat.ec.europa.eu/statistics_explained/index.php/International_trade_by_enterprise_characteri
stics
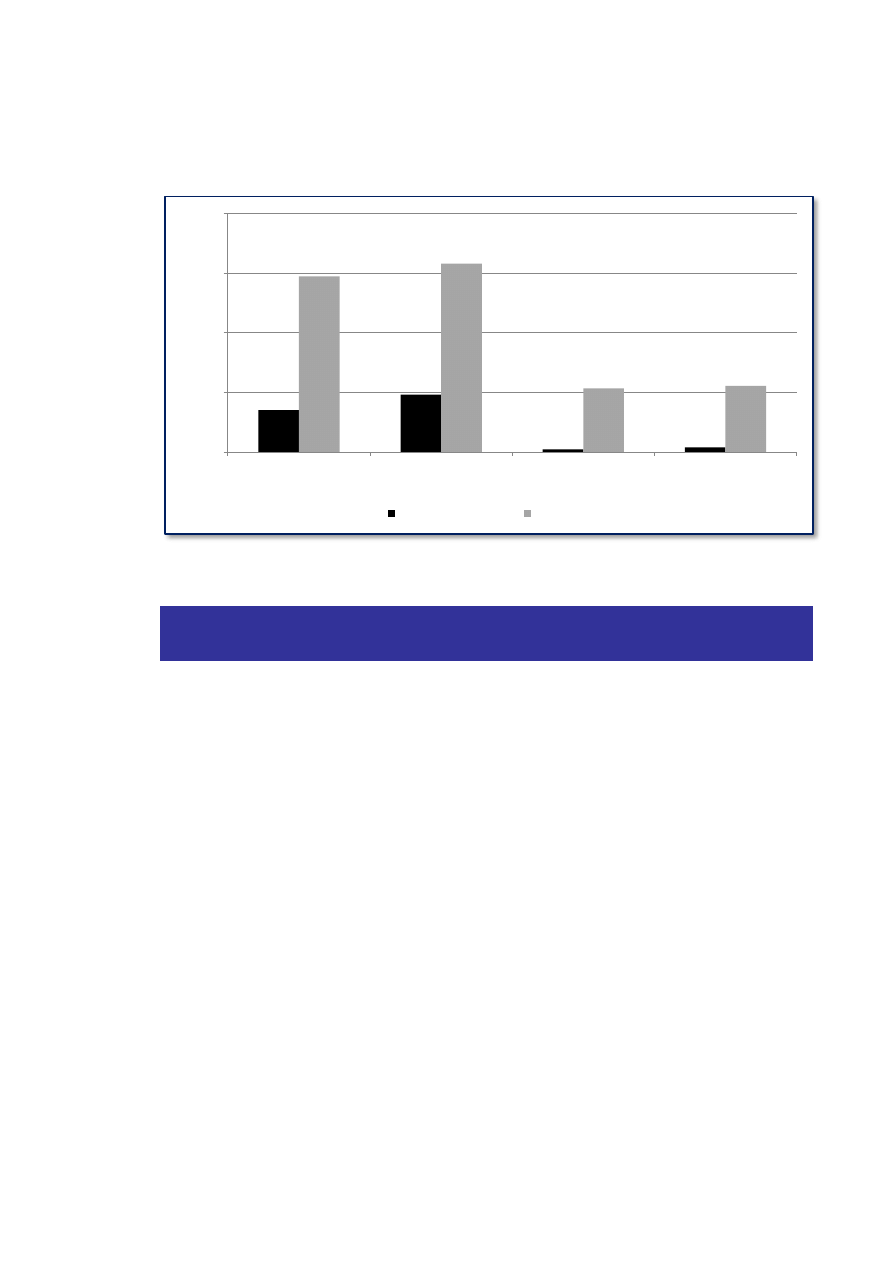
36
Figure 7. Share of Danish non-financial enterprises and employment by trade and
ownership categories (2010)
Note: Categories are not mutually exclusive.
Source: Nielsen and Luppes, 2012
THE EUROGROUPS REGISTER (EGR) AND EUROPEAN SYSTEM OF BUSINESS
REGISTERS (ESBRS)
In any society, MNEs tend to be large, competitively dominant, highly productive, and
technologically advanced enterprises that are large domestic employers and also the
largest traders and investors in R&D. In other words, they are economically important
actors that account for a large share of innovation and economic globalization. Slaughter
(2009, p. 10), summarizing the work of Bernard et al (2007) makes the case very
convincingly for the United States:
Companies in the United States that are part of a multinational firm account for a small fraction of one
percent of all companies. But these firms account for 23.7% of all private-sector jobs—jobs that
involve lots of knowledge creation, capital investment, and international trade, all activities associated
with higher compensation. In 2006 these multinationals undertook 42.6% of all U.S. capital investment,
shipped 66.9% of all U.S. goods exports and brought in 59.9% of all goods imports, and conducted a
remarkable 89.6% of all U.S. private sector R&D. The bottom line that year for their nearly 27 million
employees was an average compensation of $64,121—over 25% above the economy-wide average.
In the United States, data on MNEs includes data on parents in the U.S. and intra-group
trade for both U.S. MNEs and foreign MNEs with affiliates in the U.S. Taken together,
MNEs account for nearly 60% of U.S. imports and 70% of exports, 24% of employment,
and 90% of spending on R&D. It is important to note that the key innovation in the work
of Bernard et al (2005) was the identification of enterprise characteristics in terms of
trade and ownership and the creation of links to a wide variety of enterprise-level
performance measures were derived from data in the business register. What is needed is
full information on the characteristics of enterprises, connected a unique identifiers and
information on intra-group trade, as mentioned earlier.
Mayer and Ottaviano (2007) found similar patterns in Europe (see Table 5).
0
20
40
60
80
Exporting enterprises
Importing enterprises
Enterprises with foreign
affiliates
Foreign controlled
enterprises
Pe
r c
ent
Number of enterprises
Employment

37
Table 5. Concentration of exporters in total manufacturing exports (percent), 2003
Country of origin
Top one percent
Top five percent
Top ten percent
Germany
59
81
90
France
44 (68)
73 (88)
84 (94)
United Kingdom
42
69
80
Italy
32
59
72
Hungary
77
91
96
Belgium
48
73
84
Norway
53
81
91
Source: Mayer and Ottaviano, 2007, p. 8.
Note: France, Germany, Hungary, Italy and the UK provide figures on large firms only; Belgian and Norwegian data is
exhaustive. Numbers in brackets for France are percentages from an exhaustive sample
An important step toward better micro-data infrastructure in Europe is being undertaken
by Eurostat and by the NSIs of the EU and EFTA countries, which are developing the
EuroGroups Register (EGR) to house information on MNEs, including global group
heads and affiliates of foreign enterprises in the EU, information generally missing from
business registers in Europe. The EGR provides enterprise information to at three levels
as follows:
legal units: identity, demographic, control and ownership characteristics;
enterprises: identity and demographic characteristics, activity code (NACE),
number of persons employed, turnover, institutional sector;
enterprise groups: identity, demographic characteristics, the structure of the
group, the group head, the country of global decision center, activity code
(NACE), consolidated employment and turnover of the group.
Data gap: It is impossible to know the country of ownership of enterprises in Europe
using current data sources. Even at the European level, the fragmentation of
enterprises is causing problems for the compilation of key statistics related to
economic globalization, including Foreign AffiliaTes Statistics (FATS), foreign direct
investment (FDI), and external trade. For example, inward FDI statistics from
EBoPS cannot be linked to enterprises. The EGR is a major step forward, but the
scope is only to cover the “most important enterprises” (i.e., largest MNEs operating
in Europe). The scope should be broadened to the extent possible.
Data issue: The EGR should be linked to a full set of business registers that include
ALL enterprises in Europe, MNEs and domestic enterprises. One reason is that not
all enterprises that are globally engaged are MNEs. Again, a main point of this
report is that external international sourcing can be practiced without FDI (by
“global buyers” such as Nike for example).
The European System of Business Registers (ESBRs) project, which is scheduled to
deliver results by the end of 2017, envisions a fully interoperable system of business
registers (national plus the EGR). It is important to note that the ESBRs are not meant to
be a single register, but a series of compatible registers that can be linked. The European
Statistical System is built upon the idea that National Statistical Institutes will maintain
their national business registers in line with the relevant European regulations. The
ESBRs will only serve national statistical institutes and national central banks and not be
disseminated to the public. However, if an expanded EGR can be linked to a fully

38
interoperable set of ESBRs, the combined data infrastructure can become a platform to
support the fuller use of micro-data in Europe. It can serve, not only as a complete
sample frame for surveys on economic globalization and other topics, but also a basis for
linking vast quantities of European enterprise-level administrative data, and for the more
comprehensive Integrated International Data Platform (IIDP) envisioned below (see page
45).
INTERNATIONAL INPUT-OUTPUT DATABASES
It used to be safe to assume that all of an import’s value was added in the exporting
country. This leant trade statistics a great deal of analytic value and policy relevance. In
this simpler world, industrial capabilities could be judged by the quality and
technological content of exports and trade rules could be tied to gross levels of trade in
specific products or product sets. “Rules of origin” labeling requirements are based on
this assumption as well, but today, it is difficult to know what labels such as “made in
China” or “made in the EU” really mean (OECD, 2011).
Because of economic globalization and the fragmentation of work in international
sourcing networks, we simply cannot know what share of an imported product or
service’s value is added in exporting countries, and are less able to judge a country’s
level of development from the technological sophistication of its exports, following Lall
(2000). Flows of intermediate goods provide hints about the structure of GVCs (see
Feenstra, 1998; Brulhardt, 2009; and Sturgeon and Memedovic, 2010), but because we do
not generally know the ownership of imported inputs, how they are used in specific
products, or how they are combined with domestic inputs and value added, it is generally
not possible to extract concrete information about the geographic distribution and flow of
value added from trade statistics alone.
36
These data and policy gaps have triggered innovative efforts to link information in
national accounts on intermediate input use and domestic value added by sector
37
with
data on international trade in goods and services to create larger international (global and
regional) input-output (IIOs) that researchers can use to move beyond simple measures of
gross trade to estimates of trade in value added. IIOs show the international sources of
value in goods and services produced and consumed throughout the world. With
estimates of this sort, we can begin to answer the question of, “Who wins and who loses
from globalization?” from the supply side (i.e., winners and losers in terms of value
added, value capture, and employment), in addition to the demand side (i.e., winners and
losers in terms of consumer prices). Figure 8 provides a simple, generic two-country
model IIO table.
There are multiple significant efforts to create IIOs. The first (and apparently most
accurate so far) is the Asian International Input Output (AIIO) Table created by Japan
External Trade Research Organization’s Institute of Developing Economies (IDE-
JETRO), initially released in 2006. The AIIO is a regional table that links intermediate
and final demand in nine largest Asian trading countries plus the United States. The table
36
Processing data from China and Mexico are exceptions to this generalization. Links to enterprise
characteristics have been used (see Dean et al, 2007 and Koopman et al, 2008).
37
Some of IIOs are based on supply-use tables (e.g., WIOD), while some are based on IO tables (e.g.,
GTAP-based tables), and some are transitioning from IOs to SUTs (e.g., OECD/WTO)

39
also estimates imports and exports from Hong Kong, the EU (as a whole) and an
aggregate “rest of the world” category.
Figure 8. A simple, generic two-country IIO table
Intermediate use
Final Use
Total use
Country 1
Country 2
Country 1
Country 2
Sup
ply
Country 1
1’s use of its
own inputs
2’s use of inputs
from 1
1’s use of its
own final goods
2’s use of final
goods from 1
1’s total
output
Country 2
1’s use of inputs
from 2
2’s use of its own
inputs
1’s use of final
goods from 2
2’s use of its
own final goods
2’s total
output
Value added 1’s value added 2’s value added
Total supply 1’s total output 2’s total output
Source : Powers (2012)
The EORA dataset, developed at the University of Sydney, covers 160 countries at a
detail of up to 500 sectors in time series covering 2000
‐ 2007 (see Kanemoto et al, 2011).
The Purdue University’s Global Trade Analysis Project (GTAP) has produced a publicly
available IIO database that covers 120 countries/regions and 57 commodities for 2004
and 2007 (in the GTAP 8 Database). As noted below, these databases typically require
additional processing before they can be used for analysis.
The World Input-Output Database (WIOD) is a large-scale EU project under the umbrella
of the 7
th
Research Framework Program (FP7) centered at the University of Groningen in
the Netherlands that began in May of 2009 and officially ended with the launch of a
public use dataset on April 16, 2012. The dataset consists of an IIO covering 40
countries (including 27 in the EU and 13 other major developed and developing
exporters), representing approximately 85% of world trade for the period 1995-2009, and
covers 35 sectors (using the NACE Rev. 1) and 59 products (using the CPA
classification). Non-EU countries in the data set include Australia, Brazil, Canada,
China, India, Indonesia, Japan, Russia, Mexico, South Korea, Taiwan, Turkey, and the
USA, and an aggregate “rest of the world” category.
To broaden its usefulness to policy makers, WIOD is linked to several satellite accounts,
including capital and labor (in physical inputs and factor incomes), and environmental
accounts, including C0
2
emissions, energy consumption, and resource use. These linked
accounts allow researchers to use regression analysis to examine the relationship between
GVCs and employment and C0
2
emissions.
On March 15, 2012, the OECD and WTO announced a joint initiative to develop a
database of Trade in Value Added indicators (TiVA), drawing on WIOD and other
sources, as a permanent fixture in the international statistical system. The first release of
TiVA indicators was made on January 16, 2013. The TiVA database presents indicators
for 40 countries (all OECD countries, Brazil, China, India, Indonesia, Russian Federation

40
and South Africa) covering the years 2005, 2008 and 2009 and broken down by 18
industries.
38
Indicators in the database include:
Decomposition of gross exports by industry by domestic and foreign content
The services content of gross exports by exporting industry by foreign and
domestic origin
Bilateral trade balances based on flows of value added embodied in domestic final
demand
Intermediate imports embodied in exports
Whether IIO datasets are publically available or not (GTAP and WIOD are), they can be
used as building blocks for special use or elaborated data sets. For example, The United
States International Trade Commission (USITC) has combined GTAP data with more
detailed information on international trade (Koopman et al, forthcoming). In another
project, the USITC linked GTAP data to detailed micro-data from the United States to
create estimate for how outputs from small and medium-sized enterprises (SMEs) are
linked to exports by larger companies, thus revealing how global engagement spills over
to the rest of the economy (USITC, 2010). On February 28, 2013, the United Nations
Conference on Trade and Development (UNCTAD) announced that it was using the
EORA IIO to create the UNCTAD-Eora GVC Database, an IIO that will be combined
with its own datasets on transnational firms and FDI in a broader “UNCTAD FDI-TNCs-
GVC Information System.”
39
Despite the ferment in IIOs and the progress they represent, it is important to
acknowledge the lack of detail, timeliness, and accuracy that inevitably arise from
estimation and cross-border harmonization. The statisticians that develop IIOs work hard
to ensure that the Leontief type modeling and other estimation techniques used are
neutral, non-informative adjustments that are necessary given limitations in underlying
data. When national input-output data sets are linked across borders, these limitations are
compounded as industry categories are harmonized at high levels of aggregation and
additional layers of assumption and inference are added to fill in missing data. The data
gaps are particularly acute for services.
Still, IIOs represent an important achievement. They provide a framework for delivering
new, policy-relevant statistics related to economic globalization that can be used in a
broad range of research and for the creation of useful indicators. IIOs can show the
extent and character of GVCs, reveal national specializations, and link to satellite
accounts on employment and the environmental effects of economic globalization.
To sum up, bottom-up improvement of statistics related to economic globalization and
the top-down approach of IIOs go hand in hand, since quality of IIOs is limited by the
quality of the underlying data. What is needed now is support of the current efforts to
extend, improve, and institutionalize IIOs. This will include on-going work to reconcile
imports and exports using “mirror” statistics to improve the quality of the underlying
trade statistics, and identifiers that would allow IIO tables to be split according to the
characteristics of enterprises: export-oriented vs. domestic-oriented enterprises. New,
improved, and internationally harmonized data resources, such as those proposed in this
report, can be used to fill in missing and estimated data at the national level. Since this
38
See:
http://www.oecd.org/industry/industryandglobalisation/measuringtradeinvalue-addedanoecd-
wtojointinitiative.htm
39
See:
http://unctad.org/en/PublicationsLibrary/diae2013d1_en.pdf

41
may not be realistic for most countries, business surveys should be used to provide
information that can improve estimates. Sample frames for business surveys can be
based on enterprise characteristics and linked through international business registers.
This will yield a better approach than the current practice of assuming all enterprises are
the same. In other words, new and improved business statistics should be designed with
improving IIOs in mind and the managers of IIO databases as “customers.” A crucial
step will be to improve national input-output (IO) and supply-use tables.
Data Issue: Like all statistics used in the measurement of economic globalization, IO
tables should be linked to a full range of enterprise characteristics. Industries in
input-output (IO) tables typically reflect aggregations of enterprises or
establishments. But these separate units will have heterogeneous production functions
that will be lost in aggregation. Because enterprises engaged in international trade
typically source disproportionately more intermediate inputs from abroad than firms
not engaged in international trade, the impact of this aggregation will typically be to
produce biased (downward) estimates of the foreign content of an economy or
industry's exports. This calls for a new approach to the compilation of national IO
and-or supply use tables; one that provides separate information on groupings of
firms engaged in international trade, including ownership. This may require a
departure from the conventional approach to improving IO tables, focused on
developing more detailed industry breakdowns (e.g., 3-4 digit NACE breakdowns). It
may be more important develop information on the characteristics of trading firms
and ownership (e.g., 2 digit NACE with each industry broken down into sub
components that differentiate between trading and non-trading firms. In fact, there is
a need to go farther than this, since research suggests that exporters and two-way
traders have significantly different characteristics, and that foreign-owned
enterprises show additional variations (Bernard et al, 2005; Nielsen and Luppes,
2012), as shown in Figure 7. Finally, we know very little about enterprises that
engage in external international sourcing
Data Issue: Time lags are another important drawback of IIOs; the most recent data
available in any IIO is 2009.
Data Issue: Problems can arise when researchers and policy-makers using IIOs do
not understand the techniques and trade-offs that have been made, engage in
uncritical, over-interpretation of estimated data: essentially interpreting it as real
data. For example, Stehrer (2012) uses WIOD data to show the share of foreign
value added in world exports rising from 19.1 percent in 1996 to 25.7 in 2009, driven
almost entirely by intermediate goods. These are important statistics because the
import content of exports provides an excellent proxy for the overall extent and
growth rate of international sourcing in the world economy. The figures have
intuitive resonance: international sourcing is a substantial, but not yet dominant form
of economic globalization, driven by trade in intermediate goods. But given the
heavy estimations that were used in creating the WIOD tables, it is impossible to
know how much of this result is based on estimates (conditioned in part by the
subjective assumptions of the researchers that built WIOD) and how much is based
on real data.

42
TAKING MICRO-DATA MAINSTREAM
As has already been discussed, administrative micro-data from public surveys and linked
data sets can enrich our view of how domestic enterprises engage with the global
economy. Micro-data collected from MNEs, for example, when combined with data on
international trade, can provide new information about the cross-border activities of
MNEs and how they use local resources in offshore locations. Such approaches can be
difficult to replicate and extend, however, because not all researchers can access
confidential micro-data, and because the painstaking work of cleaning and matching raw
micro-data files can be very difficult for other researchers to understand and replicate.
Furthermore, administrative data sets are often non-standard, available only for individual
countries, and for limited time periods as when data collected in support of specific
policy initiatives are phased out after the programs they were intended to support come to
an end. Historic micro-data is regularly lost, either through purposeful destruction for
reasons of confidentiality or more commonly through lack of maintenance and proper
archiving, especially as IT systems storing and delivering data, change over time. As a
result, studies based on micro-data can have limited scope with regard to analyses of
multiple countries and longer-term trends.
The question, then, is how to make better use of valuable micro-data resources. Some
micro-data sets have also been assembled by data agencies, cleaned, and made available
for approved research with confidential information removed.
40
However, this is rare.
Here are few steps that can help:
Initiate programs to archive and maintain key micro-data resources.
Develop a system to identify and link enterprises across the different datasets. This
will require a unique identification numbering system managed by the business
registers and used by each of the statistics included in micro-data linking programs.
Move to a consistent use of statistical units (most typically, the enterprise).
Coordinate sampling across various surveys to ensure that a representative sample
of enterprises is included in all samples. Currently, the opposite is normally
practiced. In an effort to reduce response burden, specific enterprises are excluded
from multiple or successive surveys.
Upgrade systems of administration for statistical purposes. Tax and statistics
legislation in EU member states can be combined in a mandatory request for
business accounting information on one system, obliging enterprises to submit
electronic information monthly using software provided by member states with
design input from Eurostat.
Do not ignore the need to include information on fully domestic enterprises in
micro-datasets. To state it again, the EGR needs to be expanded to include more
enterprises in Europe — MNEs and larger domestic enterprises — and linked to the
European System of Business Registers (ESBRs).
40
For example, in the U.S., Jarmin and Miranda (2002) have assembled the Business Register into a time-
series for 1976-2002, referred to as the Longitudinal Business Database (LBD). The Synthetic LBD has
confidential information removed (see: http://www.census.gov/ces/dataproducts/synlbd/index.html).

43
Part IV: THE VISION AND THE PRIORITIES
Clearly, the assumptions behind current data regimes have changed and statistical
systems are struggling to catch up. While it will be exceedingly difficult to fill data gaps
without new data, and progress that relies only on existing data resources will always be
limited, the most efficient approach will be to develop systematic links between key
existing data, supplemented with a few additional variables, with data on enterprise
characteristics drawn from administrative sources, all tied together by enterprise
identifiers that make ownership clear, even when it extends across borders.
THE NEED FOR AN INTERNATIONALLY HARMONIZED MEASUREMENT FRAMEWORK
Economic globalization has heightened the need to develop an internationally
harmonized measurement framework for international trade and economic globalization.
An internationally harmonized framework needs to be created, based on common
concepts and definitions and use of compatible compilation methods.
41
Harmonization
can both increase coherence in national economic statistics and facilitate international
comparability. On the compilation side, practices can, and should, always evolve and be
improved, so a conceptual framework and related roadmap are the most important
elements. The hope is that this report can contribute to this framework.
By necessity, Europe is a leader in the shift from nation-based statistics to international of
statistics. However, Eurostat should work closely with multilateral agencies such as the
OECD and UNSD and key NSIs outside of Europe to develop a globally accepted and
harmonized framework for economic globalization. Because it has a legislative mandate
to harmonize statistics within Europe, Eurostat can provide an ideal test-bed for such
efforts, and provide leadership through example and mentorship for NSIs outside the
ESS. At the very least, Eurostat should have an active program to share best practices
and materials with trading partners.
The need for outreach to less developed countries is especially acute. Developing
countries tend to have few resources for economic statistics and under-developed
statistical systems. On the other hand, such countries may not be weighed down by the
legacy of outdated conceptual models and data collection regimes. Systematic programs
are needed to bring more countries into the global statistical system, and Eurostat can be
a leader in this regard. The motives are both altruistic and self-serving: the more
countries that can contribute compatible data to the global statistical regime, the more
data resources Europe will have to develop comprehensive statistics and indicators.
For example, the UNSD, IDE-JETRO, and researchers from Duke University’s Center on
Globalization, Governance, and Competitiveness (CGGC) are currently engaged in a
project with the NSI of Costa Rica. This project is especially innovative because it
combines qualitative field research with improvements in official statistics. By working
with the Costa Rican NSI, UNSD and IDE-JETRO personnel have been able to link
41
Again, to the extent possible, all definitions and methods should be made compatible with the System of
National Accounts (SNA) framework, the international statistical standard for the national accounts
adopted by the United Nations Statistical Commission (UNSC). For the latest version (2008) see
http://unstats.un.org/unsd/nationalaccount/sna2008.asp
. The European System of Accounts (ESA) can
also be used, but it has not been updated since 1995 (see:
http://stats.oecd.org/glossary/detail.asp?ID=869
).

44
almost 100% of the exporting companies to Costa Rica’s full business register. This
means that detailed statistics on exports of commodities by country of destination are
now linked to industries, to export intensity, to company size class, and to location,
including to export processing zones in Costa Rica. Work is ongoing to measure the
imports (and import share) of exporting enterprises. At the same time, a team of
researchers from CGGC is engaged in several rounds of qualitative field research at local
and foreign-owned enterprises in Cost Rica. Each element of the project, qualitative and
qualitative, is being used to put the other in context, creating a broader picture of Costa
Rica’s current position, and prospects, in regard to economic globalization. Importantly,
this work has helped Costa-Rica’s statistical system take huge and rapid strides toward
adopting the statistical standards of OECD countries.
AN INTEGRATED INTERNATIONAL DATA PLATFORM
Progress is being made to address the measurement problems associated with economic
globalization. There are ongoing efforts to ensure that international trade statistics — for
both goods and services — are collected and published at the appropriate levels of quality
and detail. There are important efforts underway to improve the sample frame for
business surveys and identify the ownership structure of enterprises accurately, to link
business registers, and to develop indicators based on enterprise characteristics. Global
sourcing surveys have undergone several rounds of field-testing, and are already
producing useful data.
While it is possible to envision a statistical system that a) incrementally improves data
resources related to internationalization (trade and FDI), b) adds new measures of
international sourcing, c) devises ways to determine the location of value added and d)
reveals ownership and the characteristics of enterprises that trade, it seems reasonable to
worry about creating a system so cumbersome and fragmented that the research and
policy-setting goals of all the stakeholders involved will be compromised. This, in fact,
describes the current situation. Cost and respondent burden, perennial concerns, both
tend to be ratcheted upward when improvements are incremental. Historically, micro-data
resources are only available to a few intrepid researchers with adequate time, funding,
motivation, expertise, and security clearance. The difficult work of linking and cleaning
administrative and other micro-data can produce important research results, but it does
not generally create official, public-use data resources that can be re-used and upgraded
systematically and over time. It is time to take a hard look at the statistical system and
develop a vision for improvements that are fundamental rather than incremental. The
recommendation here is to create an integrated international data platform (IIDP).
An integrated international data platform (IIDP) would include, among other things, full
datasets on trade and FDI, including information from new related party flags on all
international transactions; full, accurate, and up-to-date enterprise ownership information,
internationally linked enterprise IDs; administrative data sets adapted for statistical use;
and new survey information on international sourcing and other critical topics, such as
the internationalization of R&D and innovation.
While a trusted party (for example Eurostat) could be designated to house confidential
information from EU member states, and eventually trading partners outside the EU, a
more feasible approach is for countries to maintain their own micro-level databases, and
for international protocols for be developed for access and data sharing. As long as the

45
IIDP can provide access to the relevant information and proper enterprise identifiers, and
work according to agreed data definitions and access protocols, confidential data can
remain protected behind NSI “firewalls.” While it may be necessary for countries to share
detailed data on a bilateral basis concerning enterprises that operate within the same
enterprise group in both countries, the responsibility for country-level micro-data could
stay at the national level. So, in the end, an IIDP might more accurately take on the form
of a “virtual IIDP.” Countries could then make richer data sets available at international
level, including much more information regarding intra-group trade and FATS, for
example.
Ideally, however, analysis of information from the IIDP should include more flexible and
dynamic access to international data. With all the needed data in one place, or centrally
accessible, “big data” analytic concepts and software could then be used to produce
disclosable (i.e., non-confidential) statistics and sets of flexible indicators to characterize
the role of national economies, industries, and groups of workers in the global economy.
While pre-defined indicators are useful and desirable, advanced analytic software could
even provide flexible on-the-fly responses to user queries by providing disclosable tables
on products, industries, and enterprise types in both predetermined and user-determined
formats.
The IIDP would need to contain several key elements:
A full and accurate sample frame
Links to full and consistently defined administrative data
Links to improved statistics on international trade and FDI
Links to improved business surveys that collect data on domestic and international
sourcing by business function
Links to business demographics covering enterprise dynamics (births and deaths)
Unique enterprise identifiers or crosswalks to tie all of the data sources together
The vision for an IIDP is as follows. A trusted party (for example Eurostat) would
collect, or perhaps only connect, confidential statistics from a variety of sources. The
system would be housed in a secure “data space” where data could be analyzed. Since
some aspects of the data would be confidential, and governed by different disclosure
rules, analytic software would be needed to produce only disclosable statistics. Important
technical steps would include data normalization and the creation of structural meta-data
to enable the application of analytic tools that can output descriptive metadata (i.e., meta-
content) and ensure that only disclosable statistics are provided to users.
While the political and organizational barriers to data sharing may be non-trivial, there is
no insurmountable technical barrier.
The good news is that an institutional framework for the IIDP already exists in the
program on the Modernisation of European Enterprise and Trade Statistics (MEETS).
42
A Framework Partnership Agreement recently established the ESSnet on Micro Data
Linking and Data Warehousing in Statistical Production.
43
While the primary aim of
MEETS is to identify and implement more efficient ways of collecting economic data,
the broader objective is to provide Member State NSIs with the assistance needed to
develop more integrated databases and data production systems for business statistics. In
42
See
http://epp.eurostat.ec.europa.eu/statistics_explained/index.php/MEETS_programme
43
See
http://www.cros-portal.eu/content/data-warehouse

46
the first phase the ESSnet on Micro Data Linking and Data Warehousing took stock of
current best practices in building integrated business data systems and identified a set of
opportunities and benefits that a statistical data warehouse (S-DWH) could provide. In its
second and last phase the ESSnet has concentrated on developing recommendations and
guidelines for creating relevant metadata for a statistical data warehouse (S-DWH) and
on specifying the methodological and architectural requirements for a S-DWH. The
ESSnet is currently producing a Handbook on setting up a S-DWH.
Because the European Statistical System is guided by the “subsidiarity principle,” (i.e.
only goals that cannot be achieved at national level should be undertaken at the EU-
level), it is likely that national data sets will continue to be created, maintained, and
stored nationally with summary tables created and analyzed centrally. The goal, then,
should be to create a “virtual” International Statistical Data Warehouse (IS-DWH) as a
key element of a “virtual” IIDP.
If it proves successful, the IIDP could begin to bring in data from more sources, including
trading partners and private sources. For example, non-confidential information from
enterprise computing systems (e.g., Enterprise Research Planning, Logistics, Shipping,
and Inventory Management systems) could be combined with survey data and
administrative information. (For an example of the detail contained in such private
enterprise systems see Appendix C.) The technical aspects of an IIDP are challenging, to
be sure, but the bigger challenge would be to get the relevant parties to agree to establish
data links. An important point is that the collection of administrative and private data is
largely budget-neutral: most of the data already exists.
THE PRIORITIES
The main tasks identified by this report, in order of priority are:
1. Develop of a vision for a (virtual) integrated international data platform (IIDP)
that fully responds to the challenges of economic globalization.
2. Enhance R&D and analytical capacity at Eurostat to keep the European Statistical
System up to date, develop analytic tools and indicators that can respond to the
needs of policy-makers, and cooperate with international data agencies on
modernizing the global statistical system.
3. Because duplication and excessive respondent burden should be avoided at all
costs, new statistical resources related to economic globalization should be
designed with micro-data linking in mind, as should future iterations of existing
surveys.
4. Improve the unique enterprise identifier system for Europe, including a matrix for
linking country enterprise IDs.
5. Accelerate efforts to fill in the EuroGroups Register and link it to a fully
interoperable European System of Business Registers (ESBRs).
6. Develop new information about international trade in goods, in particular about
intra-group trade, by including a related party flag on all customs forms and
international transactions records.
7. Develop systematic information on international sourcing through new surveys
using the business function approach.

47
8. Continue to improve information on international trade in services, and include
related-party trade.
9. Work with international agencies and NSIs outside of Europe to share the best
practices and related surveys with Europe’s trading partners.
10. Explore the feasibility of leveraging data from private companies in the official
statistical system.

48
CONCLUDING REMARKS
The activities of the vast majority of enterprises continue to be domestic. Most
enterprises conduct all of their activities domestically, purchase inputs domestically, and
sell domestically. But this does not mean we can be complacent or that economic
globalization is insignificant from a quantitative perspective. Globally engaged
enterprises tend to be largest and most technologically advanced (Slaughter, 2009). On
top of this, the barriers to global engagement are falling quickly. For example:
The business models for global engagement have matured. They are well theorized,
well documented and well known.
Markets and supply-base capabilities have also matured around the world, providing
a broad set of potential customers and business partners.
The largest third party service providers including finance, consulting, and logistics
all have global reach, and routinely help other enterprises globalize.
Trade and market liberalization continue to rise, however unevenly.
Trade infrastructure has improved dramatically in many locations. Each continent
and many countries now have state of the art container and airfreight port facilities.
Finally, the technology to weave all of these pieces together has taken huge leaps
forward. Efficiency in spatially distributed economic activities is being driven by
computerization, low cost digital communications, and other advanced technologies,
most centrally embodied by the Internet, but also in less general technologies such as
enterprise resource planning software, database management software, computer
design software, logistics tracking, and radio frequency identification (RFID) and
other remote sensing methods.
With the pieces of the economic globalization puzzle falling into place, in terms of
business practices, one might ask why global engagement is not more pervasive than it is.
For many enterprises, it is mainly a lack of information and motivation. Conducting
business “as usual” exerts a powerful path-dependent force. If doing business at home is
acceptable, enterprises may not be interested in the risks of global engagement, both real
and perceived. While some enterprises begin exporting shortly after their founding
(Moen and Servais, 2002), and technology-based enterprises are sometimes “born global”
(Knight and Cavusgil, 2004), exporting, external international sourcing, and establishing
foreign affiliates through FDI make no sense for many, if not most enterprises. If
customers are specific and local, if supply-chains are domestic and not tolerant of
distance, or if labor markets are unique, internationalization can be the farthest thing from
the minds of busy managers. Food service, retail, government services, personal services,
specialized equipment, the production of luxury goods, and military hardware and other
government purchases are all large and important economic sectors that have been
resistant to globalization so far.
But in sector after sector there have been surprises. In financial services, call center-
based services, back office functions, and even legal research and corporate R&D, the
largest enterprises have found ways to both export and source internationally in a search
to lower costs (Dossani and Kenney, 2003, 2005). A few supermarkets, and even coffee
shops, once the realm of local and at best regional companies, have become global-scale
MNEs and huge buyers in international sourcing networks (Reardon et al, 2003; Daviron
and Ponte, 2005). Economic globalization has come with increasing scale and
concentration, especially in the retail sector, with “big box” stores selling globally
sourced household goods, home improvement products, furniture, and food (Hamilton et

49
al, 2012), driving smaller retailers into specialty niches or entirely out of business,
especially when they are located nearby and operate in the same line of business
(Haltiwanger et al, 2010). As a result the pressure on fully local enterprises has grown in
sector after sector. Some survive nicely, and some remain immune from the pressures of
economic globalization, but many have seen their customers drift away to larger, more
“trendy” or lower-cost alternatives offered by competitors with global reach.
As a result the perception of globalization’s pervasiveness has outrun the reality, but only
to a degree. There is a feeling of inevitability about the process, of the creeping
dominance of global brands, increasingly delivered through big box and Internet retailers.
In this environment many workers, justifiably or not, feel the pressure: on wages, on job
quality, and on job tenure. The consequences of economic globalization can be negative,
not only in perception but in reality, for example when anecdotes about the offshoring of
work or a neighbor’s job loss cause real physiological stress, decrease job mobility, and
undermine demands for better pay and working conditions.
But the consequences of economic globalization can also be positive. Global integration
can lower costs, increasing product variety, and improving service for consumers. While
companies can engage in international wage arbitrage, skilled workers have the
opportunity do the same. The rapid expansion of MNEs and external international
sourcing networks have brought developing and transition economies into the global
trading system with unprecedented speed, driving industrial upgrading, technological
learning, and wage and employment growth.
About ten years ago, the cover of a special issue of Business Week magazine on
international sourcing of services read, “Is your job next?” (Engardio, 2003). Such
feelings of uncertainty and anxiety have political expression. Politicians and bureaucrats
react, and sometimes set policies in response to public sentiment. Indeed, the notion that
trade barriers inevitably harm countries that erect them, enforced by the WTO and the
“Washington Consensus”, is being complicated by a new round of industrial policy and
even protectionist actions. When the statistical resources are not available to support
measured responses, responses that sometimes need to cut against the grain of public
perception, policies can become counter-productive. The solution is clear, but very
difficult: to modernize and internationalize the statistical system to provide appropriate
and timely information that can support agile, evidence-based policy-making.

50
References
Alajääskö, Pekka. 2009. “Features of International Sourcing in Europe in 2001-2006”.
Eurostat, Statistics in Focus, 73/2009, September 11.
http://epp.eurostat.ec.europa.eu/portal/page/portal/product_details/publication?p_
product_code=KS-SF-09-073
Baldwin, Carliss and Clark, Kimberly. 2000. Design Rules; Unleashing the Power of
Modularity. Cambridge, MA: MIT Press.
Baldwin, Richard. 2011. “Trade and Industrialisation after Globalisation’s 2nd
Unbundling: How Building and Joining a Supply Chain are Different and Why it
Matters.” National Bureau Of Economic Research, Working Paper 17716,
Cambridge, MA, December. http://www.nber.org/papers/w17716
Berger, Suzanne and the MIT Industrial Performance Center. 2005. How We Compete.
New York: Doubleday.
Bernard, Andrew; Jensen J. Bradford and Schott, Peter. 2005. "Importers, exporters and
multinationals: a portrait of firms in the U.S. that trade goods", NBER Working
Paper, 11404.
Bhasin, Pramod. 2011 “How I Did It: Genpact’s CEO on Building an Industry in India
from Scratch. Harvard Business Review. June.
Borga, Maria. 2005. “Trends in Employment at U.S. Multinational Companies: Evidence
from Firm-Level Data.” Brookings Trade Forum, pp. 135-163.
http://muse.jhu.edu/results?section1=author&search1=Maria%20Borga
Bradach, Jeffery and Eccles, Robert. 1989. “Price, Authority, and Trust: From Ideal
Types to Plural Forms.” Annual Review of Sociology. 15: 97-118.
Brown, Clair and Sturgeon, Timothy. Forthcoming. "The Outsourcing and Offshoring
Practices of United States Organizations." IRLE Working Paper, University of
California and Berkeley.
Brown, Sharon. 2008. “Business processes and business functions; a new way of looking
at employment”, Monthly Labor Review, December, pp. 51-70.
Brülhart, Marius. 2009. “An account of inter-industry trade, 1962-2006”, Research Paper
Series in Globalisation, Productivity, and Technology, 2008/08, Leverhulme
Centre for Research on Globalisation and Economic Policy: University of
Nottingham.
Dassbach, Carl. 1989. Global Enterprises and the World Economy: Ford, General
Motors, and IBM, the Emergence of the Transnational Enterprise. New York:
Garland Publishing.
Daviron, Benoît; and Ponte, Stefano. 2005. The coffee paradox: global markets,
commodity trade and the elusive promise of development. London: Zed Books.
Dean, Judith; Fung, K.C. and Wang Zhi. 2007. “Measuring the vertical specialization in
Chinese trade”, U.S. International Trade Commission, Office of Economics
Working Paper, No. 2007-01-A.
Desai, Mihir; Foley, Fritz; and Hines, James. 2005. "Foreign Direct Investment And The
Domestic Capital Stock," American Economic Review, 95 (2,May), 33-38.
Dicken, Peter. 2011. Global Shift: Mapping the Contours of the World Economy. Sixth
edition. London: Sage Publishing.
DiMaggio, Paul; and Powell, Walter. 1983. “The Iron Cage Revisited: Institutional
Isomorphism and Collective Rationality in Organizational Fields.” American

51
Sociological Review, 48:2, 147-160.
Dossani, Rafiq, and Kenney, Martin. 2003. “Lift and Shift; Moving the back office to
India” Work in Progress (Sept.). Information Technologies and International
Development, 1:2, pp. 21–37.
Dossani, Rafiq, and Kenney, Martin. 2005. “Moving Services Offshore: A Case Study of
an U.S. High-Technology Firm.” Report was prepared for the European Union -
U.S. Department of Labor seminar Offshoring of Services in ICT and Related
Services.
Dunning, John. 1977. “Trade, location of economic activity and the multinational
enterprise: A search for an eclectic approach.” In B. Ohlin, P. Hesselborn, & P.
Magnus (Eds.), The international allocation of economic activity, pp. 395–418.
NY: Holmes & Meier.
Engardio, Peter; Bernstein, Aaron; and Kripalani, Manjeet. 2003. “Is Your Job Next?”
Business Week, February 3, pp. 50-60.
Escaith, Hubert and Timmer, Marcel. 2012. “Global value chains, trade, jobs, and
environment: The new WIOD database.” VoxEU, May 13.
http://www.voxeu.org/article/new-world-input-output-database
Feenstra, Robert and Hamilton, Gary. 2006. Emergent Economies, Divergent Paths:
Economic Organization and International Trade in South Korea and Taiwan.
Cambridge, UK: Cambridge University Press
Feenstra, Robert. 1984. “Voluntary Export Restraint in U.S. Autos, 1980-81: Quality,
Employment, and Welfare Effects.” Chapter 2 in The Structure and Evolution of
Recent U.S. Trade Policy, Robert E. Baldwin and Anne O. Krueger, eds. NBER,
University of Chicago Press, p. 35 - 66.
Feenstra, Robert. 1998. “Integration of trade and disintegration of production in the
global economy”, Journal of Economic Perspectives, 12(4), 31-50.
Fernandez-Stark, Karina; Bamber, Penny and Gereffi, Gary. 2011. “The offshore services
value chain: Upgrading trajectories in developing countries.” Int. J. Technological
Learning, Innovation and Development 4, 1-3: 206-234.
Freeman, Richard. 2006. “The Great Doubling: America in the New Global Economy.”
Usery Lecture, April 8, Georgia State University.
emlab.berkeley.edu/users/webfac/eichengreen/e183.../great_doub.pdf
Fröbel, Folker; Jϋrgen, Heinrichs and Kreye, Otto. 1980. The New International Division
of Labor, Cambridge: Cambridge University Press.
Gereffi, Gary and Korzeniewicz, Miguel (Eds.). 1994. Commodity Chains and Global
Capitalism. Westport, CT: Praeger, pp. 95-122.
Gereffi, Gary and Sturgeon, Timothy. Forthcoming. “Global Value Chain-Oriented
Industrial Policy: The Role of Emerging Economies.” In Deborah Elms and
Patrick Low (eds.) Supply Chains in a Changing World. Published by the World
Trade Organization in collaboration with the Fung Global Institute and the
Temasek Centre for Trade and Negotiations.
Graham, John M., with Steven Davis, Douglass Lippoldt, Catherine Mann, and Jack
Triplett, 2007. “The Measure of a Nation: Quantifying Innovative Strength
through Improved Service Sector Metrics.” National Bureau of Asian Research,
Special Report No. 11, February
Haltiwanger, John; Jarmin, Ron, Krizanb, C.J. 2010, “Mom-and-Pop meet Big-Box:
Complements or substitutes?” Journal of Urban Economics, 67:1, January, 116–

52
134.
Harrison, A.E. and M.S. McMillan. 2006. “Outsourcing jobs? Multinationals and U.S.
employment.” NBER Working Paper, 12372.
Hausmann, Ricardo; Hwang, Jason and Rodrik, Dani. 2007. “What you export matters.”
Journal of Economic Growth, 12:1–25.
Henderson, Jeffery; Dicken, Peter; Hess, Martin; Coe, Neil; and Yeung, Henry Wai-
chung. 2002. “Global Production Networks and the Analysis of Economic
Development,” Review of International Political Economy, 9(3): 436–64.
Humphrey, John. 2003. “Globalization and supply chain networks: The auto industry in
Brazil and India,” Global Networks, 3(2): 121-141.
Hymer, Stephen. 1960. The International Operations of National Firms: A Study of
Direct Foreign Investment. Cambridge, Massachusetts: The MIT Press.
Jarmin, Ron and Miranda, Javier. 2002. “The longitudinal business database.” US Census
Bureau Working Paper, July 16. http://ideas.repec.org/p/cen/wpaper/02-17.htm
Jensen, J. Bradford. 2011. Global Trade in Services: Fear, Facts, and Offshoring.
Washington DC: Peterson Institute of International Economics, September 1.
Jensen, P. D. Ø. and Petersen, B. 2013. “Global Sourcing of Services: Risk, Process, and
Collaborative Architecture.” Global Strategy Journal, 3: 67–87.
doi: 10.1111/j.2042-5805.2012.01049.x
Johanson, Jan and Matsson, Lars-Gunner. 1987. “Interorganizational Relations in
Industrial Systems: a Network Approach Compared with the Transaction-Cost
Approach.” International Studies of Management and Organization. 27(1): 34-48.
Johnson, Robert and Noguera, Guillermo. 2012. “Fragmentation and Trade in Value
Added over Four Decades.” NBER Working Paper No. 18186, June.
Kanemoto. K. Lenzen M, Geschke A, Moran. 2011. “Building Eora: a Global Multi-
region Input Output Model at High Country and Sector Detail.” 19th International
Input
‐ Output Conference, Alexandria, USA, 13‐ 17 June 2011.
Kaplinsky, Raphael and Morris, Mike. 2001. Manual for Value Chain Research. Manual
prepared for the IDRC.
http://asiandrivers.open.ac.uk/documents/Value_chain_Handbook_RKMM_Nov_
2001.pdf
Kawakami, Momoko. 2011. “Inter-firm Dynamics of Notebook PC Value Chains and the
Rise of Taiwanese Original
Design Manufacturing Firms.” Chapter 1 in, Momoko
Kawakami and Timothy Sturgeon (eds), The Dynamics of Local Learning in
Global Value Chains; Experiences from East Asia. Basingstoke, UK: Palgrave
Macmillan.
Kedia B.L. and Lahiri ,S. 2007. “International outsourcing of services: a partnership
model.” Journal of International Management, 13: 22–37.
Knight, Gary and Cavusgil, Tamar. 2004. “Innovation, organizational capabilities, and
the born-global firm.” Journal of International Business Studies, 35, March, 124-
141.
Koopman, R., Z. Wang and S.-J. Wei (2008), How Much of Chinese Exports is Really
Made in China? Assessing Domestic Value-Added When Processing Trade Is
Pervasive, NBER Working Paper Series, No. 14109, Cambridge, MA.
Koopman, Robert; Wang, Zhi; and Wei, Shang-Jin. Forthcoming. “Tracing Value-Added
and Double Counting in Gross Exports.” American Economic Review.
Kravis, Irving. 1956. "’Availability’ and Other Influences on the Commodity

53
Composition of Trade," Journal of Political Economy. University of Chicago
Press, Volume 64, page 143.
Lall, Sanjaya. 2000. “The technological structure and performance of developing country
manufactured exports, 1985-98”, Oxford Development Studies, 28(3), 337-369.
Langlois, Richard., and Robertson, Paul. 1995. Firms, Markets and Economic Change.
London: Routledge.
Linden, Greg, and Samoya, Deepak 2003. “System-on-a-Chip Integration in the
Semiconductor Industry: Industry Structure and Firm Strategies.” Industrial and
Corporate Change 12 (3): 545–57.
Linden, Greg; Kraemer, Kenneth; and Dedrick, Jason. 2009. “Who Captures Value in a
Global Innovation System? The case of Apple's iPod,” Communications of the
ACM. 52(3): pp.140-144.
Linden, Greg; Kraemer, Kenneth; and Dedrick, Jason. 2011. “Innovation and Job
Creation in a Global Economy: The Case of Apple’s iPod” US Trade Commission.
Proceedings of the Joint Symposium of U.S.-China Advanced Technology Trade
and Industrial Development. Journal of International Commerce and
Economics. May, pp. 223-240. http://www.usitc.gov/journals/jice.htm
Linder, Staffan Burenstam. 1961. An Essay on Trade and Transformation. Wiley & Sons
Ltd.; Stockholm: Almqvist & Wiksell. 167 pp.
Malmberg, Anders and Maskell, Peter. 2002). “The Elusive Concept of Localization
Economies: Towards A Knowledge-based Theory of Spatial Clustering.”
Environment and Planning A, 34:3, 429-449.
Martin, Ron and Sunley, Peter. 2006. “Path dependence and regional economic evolution.”
Journal of Economic Geography, 6(4): 395–437.
Mayer, Thierry and Ottaviano, Gianmarco. 2007. The Happy Few: The
Internationalisation of European Firms; New Facts Based on Firm-Level
Evidence. Brussels, Belgium: Bruegel Blueprint Series
Moen, Øystein and Servais, Per. 2002. “Born Global or Gradual Global? Examining the
Export Behavior of Small and Medium-Sized Enterprises.” Journal of
International Marketing, 10: 3, 49-72.
National Academy of Public Administration (NAPA). 2006. “Off-shoring: How Big Is
It?” Report by a NAPA panel for the U.S. Congress and the Bureau of Economic
Analysis. October. (Technical supplement published February 2007.)
Nelson, Richard and Winter, Sidney. 1982. An Evolutionary Theory of Economic
Change. Cambridge: Harvard University Press.
Nielsen, Peter Bøegh (ed.) 2008. International Sourcing - Moving Business Functions
Abroad, Statistics Denmark, www.dst.dk/publ/InterSourcing.
Nielsen, Peter Bøegh. 2012. “International Organisation and Sourcing Survey: Danish
Results.” Eurostat Task Force meeting, Luxembourg, December 17-18.
Nielsen, Peter Bøegh and Luppes, Martin. 2012. “Globalised enterprises: a European
approach.” Presentation to the OECD-Eurostat workshop on TEC and GVCs.
OECD headquarters (Paris), 25-26 October.
OECD and Eurostat. 2005. Oslo Manual, Guidelines for collecting, and interpreting
innovation data, 3rd edition. The Measurement of Scientific and Technological
Activities. Joint publication endorsed by the OECD Committee for Scientific, and
Technological Policy (CSTP), the OECD Committee on Statistics (CSTAT), and
the Eurostat Working Party on Science, Technology and Innovation, Statistics

54
(WPSTI) http://epp.eurostat.ec.europa.eu/cache/ITY_PUBLIC/OSLO/EN/OSLO-
EN.PDF
OECD. 2011. “Global Value Chains: Preliminary Evidence and Policy Issues”
Directorate for Science, Technology and Industry. Paper presented to the
Committee on Industry, Innovation and Entrepreneurship, CIIE meeting, 31
March-1 April 2011.
Ohlin, Bertil. 1952. Interregional and international trade. Cambridge, Massachusetts:
Harvard University Press
Pine, J.P. and S. Davis (1999). Mass Customization: The New Frontier in Business
Competition, Cambridge, MA: Harvard Business School Press.
Ponte, Stefano and Gibbon, Peter. 2005. “Quality standards, conventions and the
governance of global value chains.” Economy and Society, 34(1): 1-
/
31.
Porter, Michael. (1985). Competitive Advantage, New York: Free Press.
Powers, William. 2012. “The Value of Value Added, Measuring Global Engagement with
Gross and Value-added Trade.” World Economics, 13:4, 19 - 38
Prahalad, C. and Hamel, G. 1990. “The Core Competence of the Corporation.” Harvard
Business Review. May-June (3): 79-91.
Principe, A., A. Davies, and M. Hobday (eds.). 2003. The Business of Systems Integration.
Oxford, UK.
Reardon, Thomas; Timmer, Peter; Barrett Christopher; and Berdegue Julio. 2003. “The
rise of supermarkets in Africa, Asia, and Latin America.” American Journal of
Agricultural Economics, 85; 5, 1140-1146.
Ricardo, David. 1817. On the Principles of Political Economy and Taxation. London:
John Murray
Richardson, George. 1972. “The Organization of Industry.” The Economic Journal. 84:
883-96.
Rogers, Everett. 2003. Diffusion of innovations. 5th eition, New York, NY: Free Press.
Saxenian, Anna Lee. 2005. “From Brain Drain to Brain Circulation: Transnational
Communities and Regional Upgrading in India and China.” Studies in
Comparative International Development, 40:2, 35-61.
Saxenian, Anna Lee. 2006. The New Argonauts: Regional Advantage in a Global
Economy. Cambridge, MA, Harvard University Press.
Slaughter, Matthew. 2003. “Globalization and Employment by US Multinationals: A
Framework and Facts”, mimeo, Council of Economic Advisors, March 2003.
Slaughter, Matthew. 2009. “Globalization and Productivity: Current Research Findings
and Policy Implications.” Paper prepared for the Federal Reserve Board
Academic Consultants Meeting, Microeconomic Perspectives on Productivity,
October 16.
Smith, Adam, 1993 [1776]: An Inquiry into the Nature and Causes of the Wealth of
Nations. Oxford: Oxford University Press.
Stehrer, Robert. 2012. “The World Input-Output Database (WIOD) Project) –
Construction and Selected Applications.” Presentation at the Global Value
Chains and Economic Globalisation Workshop, Eurostat, Luxembourg, 9-10 Oct.
Storper, Michael. 1995. “The Resurgence of Regional Economies, Ten Years Later: The
Region as a Nexus of Untraded Dependencies.” European Urban and Regional
Studies 2:3, 191-221.

55
Sturgeon, Timothy and Florida, Richard. 2004. “Globalization, deverticalization, and
employment in the motor vehicle industry”, in M. Kenny with R. Florida (eds.):
Locating Global Advantage: Industry Dynamics in a Globalizing Economy. Palo
Alto, CA: Stanford University Press.
Sturgeon, Timothy and Lee, Ji-Ren. 2005. “Industry Co-Evolution: Electronics Contract
Manufacturing in North American and Taiwan” Chapter two in Suzanne Berger
and Richard Lester (eds.): Global Taiwan: Building Competitive Strengths in a
New International Economy, Armonk, NY: M.E. Sharpe.
Sturgeon, Timothy and Lester, Richard. 2004. “The New Global Supply-base: New
Challenges for Local Suppliers in East Asia.” Chapter 2 in: Shahid Yusuf, Anjum
Altaf and Kaoru Nabeshima, eds., Global Production Networking and
Technological Change in East Asia. Oxford: Oxford University Press.
Sturgeon, Timothy and Memedovic, Olga. 2010. “Measuring Global Value Chains:
Intermediate Goods Trade, Structural Change and Compressed Development.”
UNIDO Working Paper. United National Industrial Development
Organization,Vienna.
Sturgeon, Timothy J., with Frank Levy, Clair Brown, J. Bradford Jensen, and David Weil.
2006. “Why We Can't Measure the Economic Effects of Services Offshoring: The
Data Gaps and How to Fill Them.” Final Report from the MIT Industrial
Performance Center's Services Offshoring Working Group, September. MIT
Industrial Performance Center working paper 06-006.
Sturgeon, Timothy, 2007. “How Globalization Drives Institutional Diversity: The
Japanese Electronics Industry’s Response to Value Chain Modularity.” Journal of
East Asian Studies, 7:(1):1–34.
Sturgeon, Timothy. 2002. “Modular Production Networks. A New American Model of
Industrial Organization,” Industrial and Corporate Change. 11(3):451-496.
Sturgeon, Timothy. 2003. “Exploring the Risks of Value Chain Modularity: Electronics
Outsourcing During the Industry Cycle of 2001-2002.” MIT IPC Working Paper
03-002, May.
Sturgeon, Timothy. 2009. “From Commodity Chains to Value Chains: Interdisciplinary
Theory-Building in an Age of Globalization.” Chapter 6 in Jennifer Bair (ed.),
Frontiers of Commodity Chain Research. Palo Alto, CA: Stanford University
Press.
UNCTAD. 2011. Non-Equity Modes of International Production and Development.
World Investment Report 2011. Geneva, Switzerland.
UNCTAD. 2013. Global Value Chains and Development; Investment and Value-added
Trade in the Global Economy. Geneva, Switzerland.
http://unctad.org/en/PublicationsLibrary/diae2013d1_en.pdf
United Nations Statistical Division. 2011. “Vision of the future of international trade
statistics.” Report from the Global Forum on Trade Statistics, Measuring Global
Trade - Do we have the right numbers? Organized jointly by UNSD and Eurostat
in collaboration with WTO and UNCTAD, 2-4 February 2011, Geneva,
Switzerland, http://unstats.un.org/unsd/trade/s_geneva2011/geneva2011.htm
USITC. 2010. Small and Medium-Sized Enterprises: Characteristics and Performance.
USITC Publication 4189. Washington, DC.
Van Der Linden, Jan A. and Oosterhaven, Jan. 1995. “European Community
Intercountry Input–Output Relations: Construction Method and Main Results for

56
1965–85.” Economic Systems Research, 7:3, 249-270.
Van Leeuwen, E.H. and Schout, J.A. 1987. “The mirror statistics puzzle in bilateral
trade flows.” Onderzoeksmemorandum, University of Groningen, Faculty of
Economics, Institute of Economic Research, Monograph 229, 45 pages.
Vernon, R. 1966. “International Investment and International Trade in the Product
Cycle.” Quarterly Journal of Economics. 80: 190-207.
Vernon, R. 1979. The Product Cycle Hypothesis in a New International Environment.
Oxford Bulletin of Economics and Statistics. 41: 255-267.
Williams, Karel 2000. “From Shareholder Value to Present-day Capitalism.” Economy
and Society. 29:1 February: 1–12

57
Appendix A. Project Advisory Committee
The project had an advisory committee, whose members have generously made time to
vet ideas and review various drafts of the report. These individuals represent a range of
data producers and users in the field of economic globalization. Since the broad statistical
community is at an early stage of developing durable solutions the statistical challenges
posed by economic globalization the goal is to contribute to an emergent consensus view
across data agencies and user communities on how to proceed. However, the
responsibility for the reports’ contents rests fully with the author.
Note: The Committee has not yet systematically vetted this report.
Nadim Ahmad, Head of Division at the OECD Statistics Directorate
Koen De Backer, Senior Economist in the Directorate of Science, Technology and
Industry, Organisation for Economic Cooperation and Development (OECD)
Hubert Escaith, Chief Statistician, World Trade Organization (WTO)
Gary Gereffi, Professor and Director of the Center on Globalization, Governance,
and Competitiveness, Duke University
Ronald Jansen, Chief, Trade Statistics Branch, United Nations Statistics Division
(UNSD)
J. Bradford Jensen, Professor of International Business and Economics at the
McDonough School of Business at Georgetown University
Peter Bøegh Nielsen, Head, Business Statistics, Danmarks Statistik
William Powers, International Economist, United States International Trade
Commission (USITC)

58
Appendix B. Definitions of Seven Business Functions and
Correspondence with Central Product Classification (CPC, ver. 2)
(Source: Nielsen, 2011.)
1. Core business function
Definition: This function is the primary activity of the enterprise and will in most cases
equate with the main activity of the enterprise. It includes production of final goods or
services intended for the market/for third parties carried out by the enterprise and yielding
income. The core business function equals in most cases the primary activity of the
enterprise. It may also include other (secondary) activities if the enterprise considers
these to comprise part of their core functions.
CPC correspondence:
88
Manufacturing services on physical inputs owned by others
854
Packaging services
87
Maintenance, repair and installation (except construction) services
89
Other manufacturing services; publishing, printing and reproduction
services; materials recovery services
Support business functions
Definition: Support business functions (ancillary activities) are carried out in order to
permit or facilitate production of goods or services intended for the market or third
parties by the enterprise. The outputs of the support business functions are not themselves
intended directly for the market or third parties. The support business functions are in the
survey divided into:
2. Distribution and logistics
Definition: This support function consists of transportation activities, warehousing and
order processing functions.
CPC correspondence:
61
Wholesale trade services
62
Retail trade services
65
Freight transport services
671
Cargo handling services
672
Storage and warehousing services
6791 Freight transport agency services and other freight transport services
68
Postal and courier services
3. Marketing, sales and after sales services including help desks and call centers
Definition: This support function consists of market research, advertising, direct
marketing services (telemarketing), exhibitions, fairs and other marketing or sales
services. Also including call-centre services and after sales services such as help-desks
and other customer supports services.
CPC correspondence:
83114 Marketing management consulting services
836
Advertising services and provision of advertising space or time

59
837
Market research and public opinion polling services
83812 Advertising and related photography services
85931 Telephone call centre services
85962 Trade show assistance and organization services
4. ICT services
Definition: This support function includes IT-services and telecommunication. IT
services consist of hardware and software consultancy, customized software data
processing and database services, maintenance and repair, web-hosting, other computer
related and information services. Packaged software and hardware are excluded.
CPC correspondence:
8313 Information technology (IT) consulting and support services
8314 Information technology (IT) design and development services
8315 Hosting and information technology (IT) infrastructure provisioning services
8316 IT infrastructure and network management services
841
Telephony and other telecommunications services
842
Internet telecommunications services
5. Administrative and management functions
Definition: This support function includes legal services, accounting, book-keeping and
auditing, business management and consultancy, HR management (e.g. training and
education, staff recruitment, provision of temporary personnel, payroll management,
health and medical services), corporate financial and insurance services. Procurement
functions are included as well.
CPC correspondence:
82
Legal and accounting services
8311 Management consulting and management services (excl 83114)
8312 Business consulting services
8319 Other management services, except construction project management
services
8592 Collection agency services
8594 Combined office administrative services
8595 Specialized office support services
6. Engineering and related technical services
Definition: This support function includes engineering and related technical consultancy,
technical testing, analysis and certification. Design services are included as well.
CPC correspondence:
833
Engineering services
8391 Specialty design services
7. Research & Development
Definition: This support function includes intramural research and experimental
development.
CPC correspondence:
81
Research and development services

60
Appendix C. Detail in private enterprise systems, an example
Actual tracking records for a notebook computer making its way from a factory in
China to the home of its ultimate customer in Medford, Massachusetts; Shipped by
FedEx, January 18-21, 2011
Delivered to customer home address, Jan 21, 2011 7:49 AM
On FedEx vehicle for delivery, MEDFORD, MA, Jan 21, 2011 7:43 AM
At local FedEx facility, MEDFORD, MA, Jan 20, 2011 5:01 PM
At destination sort facility, FRANKLIN, MA, Jan 20, 2011 12:05 PM
Departed FedEx location, NEWARK, NJ, Jan 20, 2011 1:59 AM
Arrived at FedEx location, NEWARK, NJ, Jan 19, 2011 4:07 PM
Departed FedEx location, ANCHORAGE, AK, Jan 19, 2011 1:30 PM
International shipment release, ANCHORAGE, AK, Jan 19, 2011 12:43 PM
Arrived at FedEx location, ANCHORAGE, AK, Jan 18, 2011 11:06 PM
At local FedEx facility, LANTAU ISLAND HK, Jan 18, 2011 5:14 PM
In transit, LANTAU ISLAND HK, Jan 17, 2011 11:12 PM
Left FedEx origin facility, SHENZHEN CN, Jan 18, 2011 11:50 AM
Picked up from factory: SHENZHEN CN, Jan 18, 2011 8:41 AM

61
Notes:

62
Notes:

63
Wyszukiwarka
Podobne podstrony:
Explaining welfare state survival the role of economic freedom and globalization
0262033291 The MIT Press Paths to a Green World The Political Economy of the Global Environment Apr
Robert P Smith, Peter Zheutlin Riches Among the Ruins, Adventures in the Dark Corners of the Global
0415776848 Routledge Indias Open Economy Policy Globalism Rivalry Continuity Dec 2008
Global Issues Brief Economic costs of terrorism
The globalization of economies and trade intensification lead companies to communicate with consumer
Globalizacja
CZYTANIE GLOBALNE, CZYLI „SOJUSZ METOD
Globalizacja, polityka a nowy porządek międzynarodowy
11 Zakres i główne trendy globalizacjiid 12273 ppt
Ziemskie i Globalne systemy odniesienia i ich realizacjie ppt
03 LOG M transp globalny
ISTOTNE ELEMENTY CYWILIZACJI A GLOBALIZACJA prezentacja
Globalne zmiany środkowiska
napisy do czytania globalnego(2)
więcej podobnych podstron