Measurement of flow rate, friction
Factor, and velocity Profile in Pipe
Flow
57:020 mechanics of Fluids and Transfer
Processes
Experimental Laboratory #2
Purpose
Measure
Flow rate in a pipe (smooth)
Friction factor
Velocity profile
Specify the turbulent-flow Reynolds Number
Compare the results with benchmark data
Uncertainty analysis for:
Friction factor
Velocity profile
Test Design
The facility consists of:
Closed pipe network
Fan
Reservoir
Instruments used:
3 Venturi meters
Simple water Manometer
Differential Water manometer
Pitot Probe
Digital Micrometer
(Accurate radial positioning)
Contraction Diameters
(mm):
12.7
25.4
52.9
3
Flow Coefficient, K
0.915
0.93
7
0.93
5
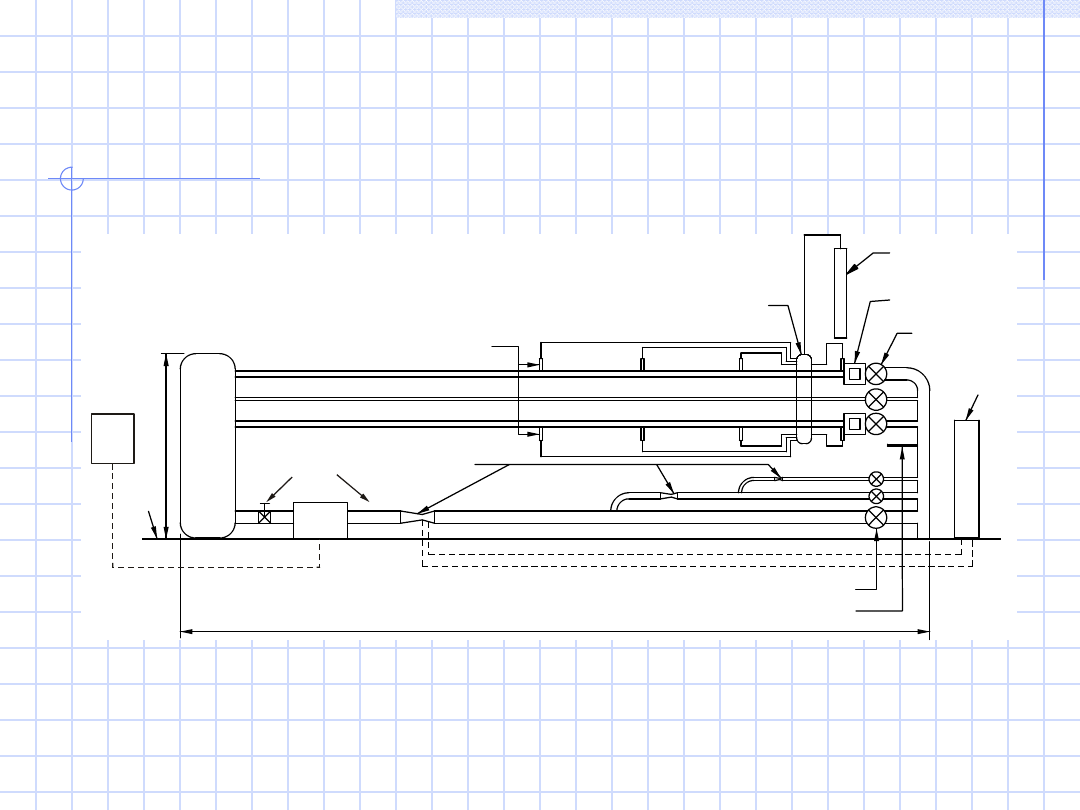
Air Flow Pipe facility
P r e s s u r e
ta p s
M o to r
c o n tr o lle r
F lo o r
6’
-6
”
R
es
er
vo
ir
2 . 0 ” s m o o th
0 . 5 ” s m o o th
2 . 0 ” r o u g h
R e lie f
v a lv e s
B lo w e r
D = 2 . 0 ”
D = 1 . 0 ”
D = 0 . 5 ”
t
t
t
3 6 ’
V e n tu r i m e te r g a te v a lv e s
T h e r m o m e te r
1
2
3
4
V a lv e m a n if o ld
S im p le
m a n o m e te r
P ito t tu b e
h o u s in g s
V a lv e s
D iff e r e n tia l
m a n o m e te r
V e n tu r i m e te r s
Test Design
(Continue)
Reservoir:
To build up pressure and force the air
to flow downstream through any of the
three straight experiment pipes.
Digital Micrometer:
Allow the measurement of the position
of the Pitot probe at different locations
along the cross section of the pipe tested
Pitot Probe:
Located in the glass-wall box
Used to measure the Stagnation
pressure and calculate the velocity
profile in pipe
Venturi meters:
Located on each pipe type
Used to measure flow rate Q along the
differential water manometer
Pressure Taps:
Located along each pipe, they are
connected to the simple water
manometer to evaluate the head
measurement
They are used to calculate the friction
factor
Manometers:
To measure the head at each pressure
Tap along the pipe and to make the Pitot-
tube measurements (simple Manometer)
To measure head drops across the
venturi meters (differential Manometer)
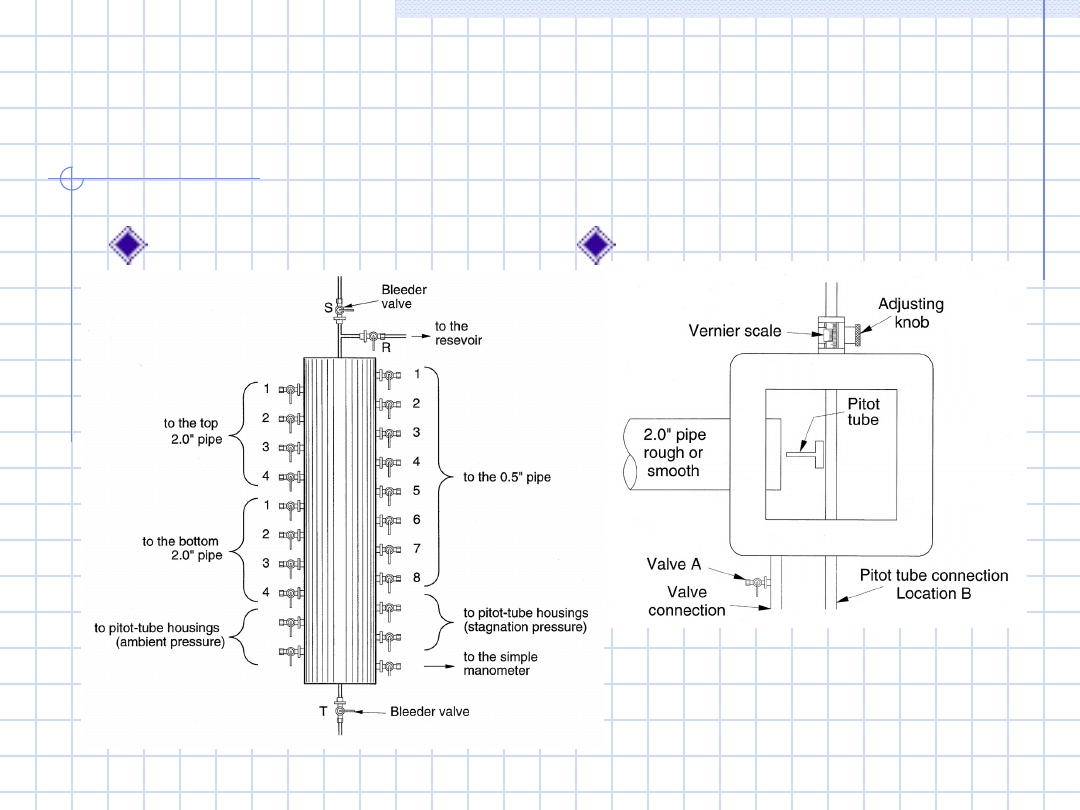
Pressure tap manifold and Pitot-tube
housing
Pressure tap manifold
Pitot-tube housing
Measurement Systems
:
The equipment used in the experiment includes:
Digital thermometer with a range of – 40 to 450 F and a
smallest reading of 0.1 F for measurement of the
environment temperature.
Digital micrometer with least significant digit 0.01 mm for
positioning the Pitot-tube inside the pipe.
Simple water manometer with a range of 2.5 ft and a least
scale division of 0.001 ft for measurement of the head at each
pressure tap along the pipes and for measurement of
velocities using the Pitot-tube arrangement .
Differential water manometer with a range 3 ft and a least
scale division of 0.001ft for measurement of the head drop
across the Venturi meters.
Measurement Systems
(continue)
For the flow rate and friction
factor, the individual
measurement are performed
for:
Ambient air temperature (A.3)
Pipe air temperature (A.5)
Pipe pressure head
Venturi meter pressure head drop
The experimental Results
are:
Manometer water density
Air density
Kinematic viscosity
Flow rate
Reynolds number
Friction factor
Data reduction equations
are:
)
(
o
w
w
T
f
)
(
o
air
air
T
f
)
(
o
air
air
T
f
air
w
DM
t
Z
g
KA
Q
2
air
e
D
Q
R
4
j
i
SM
SM
air
w
Z
Z
LQ
D
g
f
2
5
2
8
Measurement Systems
(continue)
For the velocity profile, the individual measurement systems
are for:
the ambient temperature
pipe air temperature
pitot stagnation and static pressure heads.
The experimental results are for:
manometer water density (A.3)
Air density (A.5)
Velocity profile (below)
Data reduction equation:
(using the Bernoulli equation along the manometer
equation)
static
stag
SM
SM
a
w
Z
r
Z
g
r
u
)
(
2
)
(
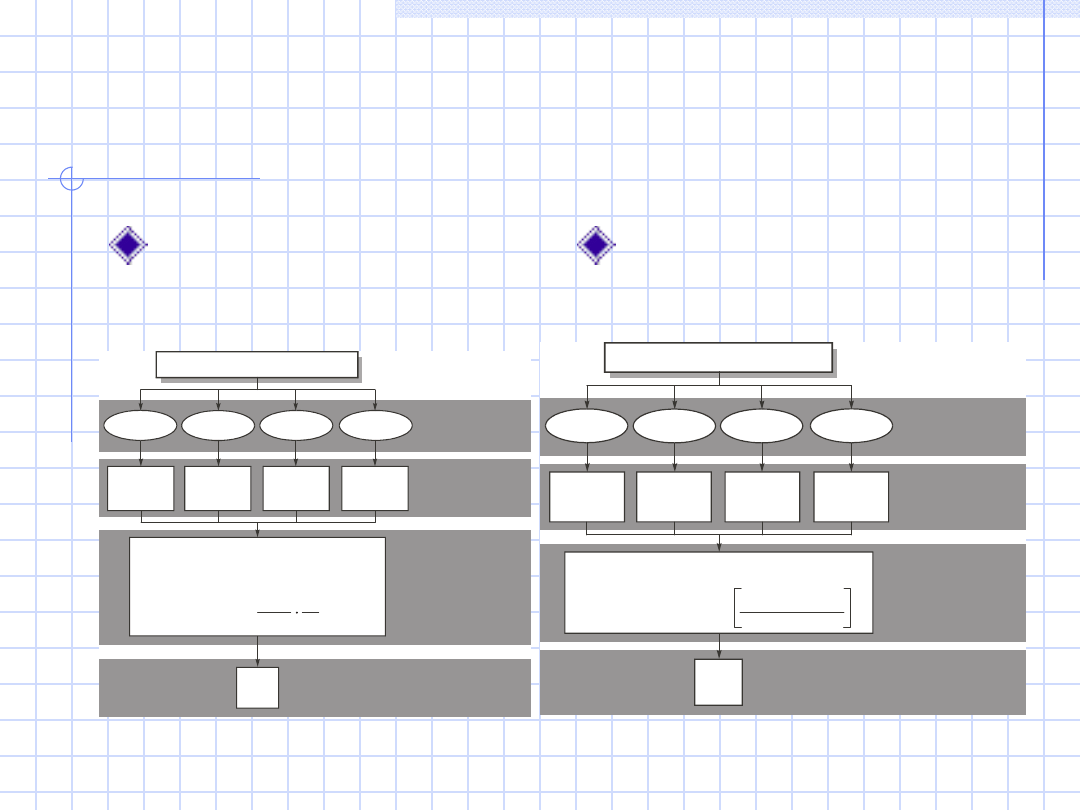
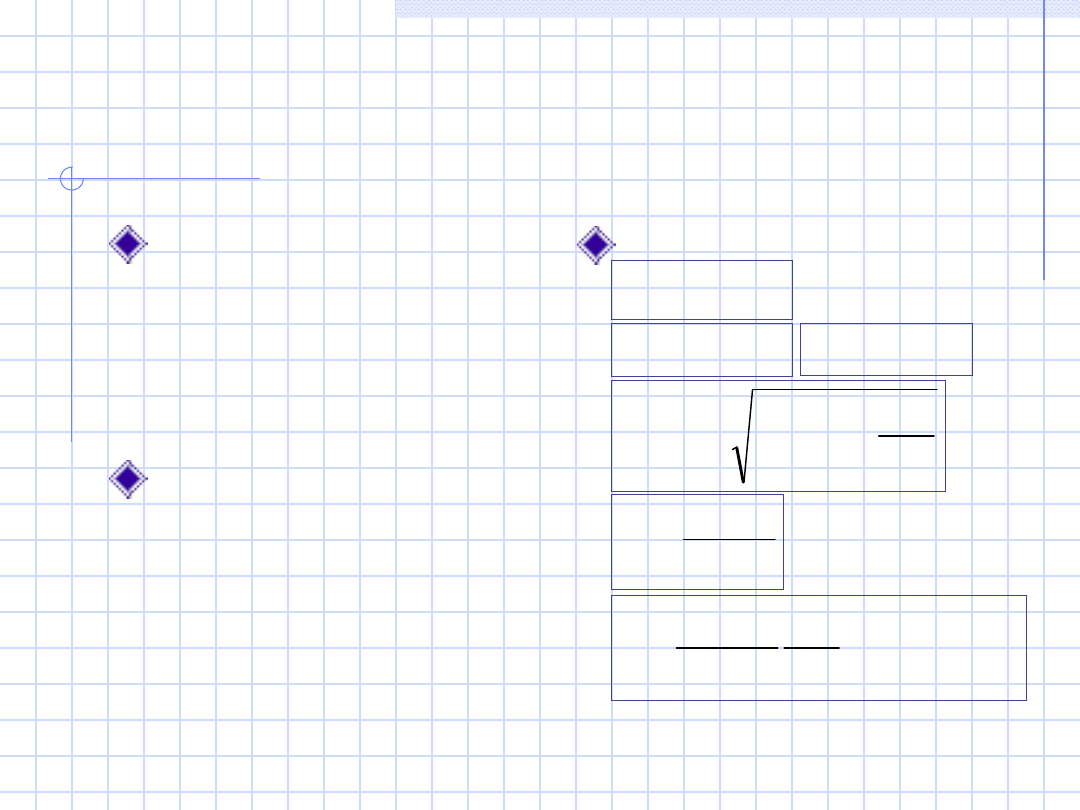
Flow rate, Friction factor and velocity
profile measurement systems
Block diagram of the
experimental determination of
the Friction
Block diagram of the Velocity
measurement
E X P E R IM E N T A L
R E S U L T S
E X P E R IM E N T A L E R R O R S O U R C E S
IN D IV ID U A L
M E A S U R E M E N T
S Y S T E M S
M E A S U R E M E N T
O F IN D IV ID U A L
V A R IA B L E S
D A T A R E D U C T IO N
E Q U A T IO N S
T E M P E R A T U R E
W A T E R
T E M P E R A T U R E
A IR
f
B , P
V E N T U R I
P R E S S U R E
P IP E
P R E S S U R E
f = F ( , , z , Q =
)
a
a
w
g
D
8 L Q
Q = F ( z )
w
w
T
T
B
T
, P
z
z
B , P
f
f
S M
S M
w
w
D M
S M
2
2
5
a
T
T
B
T
, P
a
a
z
S M
z
z
B , P
D M
D M
z
D M
= F (T )
( )
w
= F (T )
a
z
S M i
- z
S M j
w
a
E X P E R IM E N T A L
R E S U L T
w
w
T
T
B
T
, P
S T A G N A T IO N
P R E S S U R E
S T A T IC
P R E S S U R E
E X P E R IM E N T A L E R R O R S O U R C E S
IN D IV ID U A L
M E A S U R E M E N T
S Y S T E M S
M E A S U R E M E N T
O F IN D IV ID U A L
V A R IA B L E S
D A T A R E D U C T IO N
E Q U A T IO N S
z
B
, P
S M
B , P
u
u
u
= F ( T )
u = F ( , , z , z )
2 ( )
g
½
=
T E M P E R A T U R E
W A T E R
T E M P E R A T U R E
A IR
w
a
s ta g
a
T
T
B
T
, P
a
z
w
w
w
S M
s t a g
z
S M
s t a g
z
B
, P
S M
s ta t
z
S M
s t a t
z
S M
s t a t
= F ( T )
a
a
a
S M
s ta g
S M
s ta t
z
S M
s ta g
- z
S M
s ta t
w
a
Data Acquisition and reduction
The procedures for data acquisition and reduction are described as follow:
1.
Use the appropriate Venturi meter, (2” smooth pipe) measure the head
drop
2.
Take reading for ambient air (manometer water) and pipe air
temperatures.
3.
To obtain velocity data, measure in the appropriate Pitot-tube box, the
ambient head and stagnation heads across the full diameter. Measure
the stagnation heads at radial intervals. The recommended radial
spacing for one half of the diameter is 0, 5, 10, 15, 20, 23, and 24 mm.
4.
Maintaining the discharge, measure the head along the pipe by means
of the simple water manometer connected to the pressure taps located
along the pipe being studied (10 times for uncertainty analysis)
5.
Repeat step 2
6.
Execute data reduction for data analysis and uncertainty analysis using
equation above
Uncertainty Analysis
The data reduction equation for the friction factor is:
However here we will only consider bias limits for Z
SM i
and Z
SM j .
The total
uncertainty for the friction is:
The Bias Limit, B
f
and the precision limit, P
f
, for the result are given by:
)
,
,
,
,
,
,
,
(
j
i
SM
SM
a
w
Z
Z
Q
L
D
g
F
f
2
2
2
f
f
f
P
B
U
2
2
2
2
1
2
2
2
j
SM
SMj
i
SM
i
SM
Z
Z
Z
Z
j
i
i
i
f
B
B
B
B
M
tS
P
f
f
Uncertainty Analysis
(continue)
Data Reduction equation for the velocity profile is as follow:
2
2
2
u
u
u
P
B
U
2
2
2
2
1
2
2
2
stat
SM
stat
SM
SMstagn
stagn
SM
Z
Z
Z
Z
j
i
i
i
u
B
B
B
B
M
tS
P
u
u
)
,
,
,
,
(
static
stagnation
SM
SM
a
w
Z
Z
g
F
f
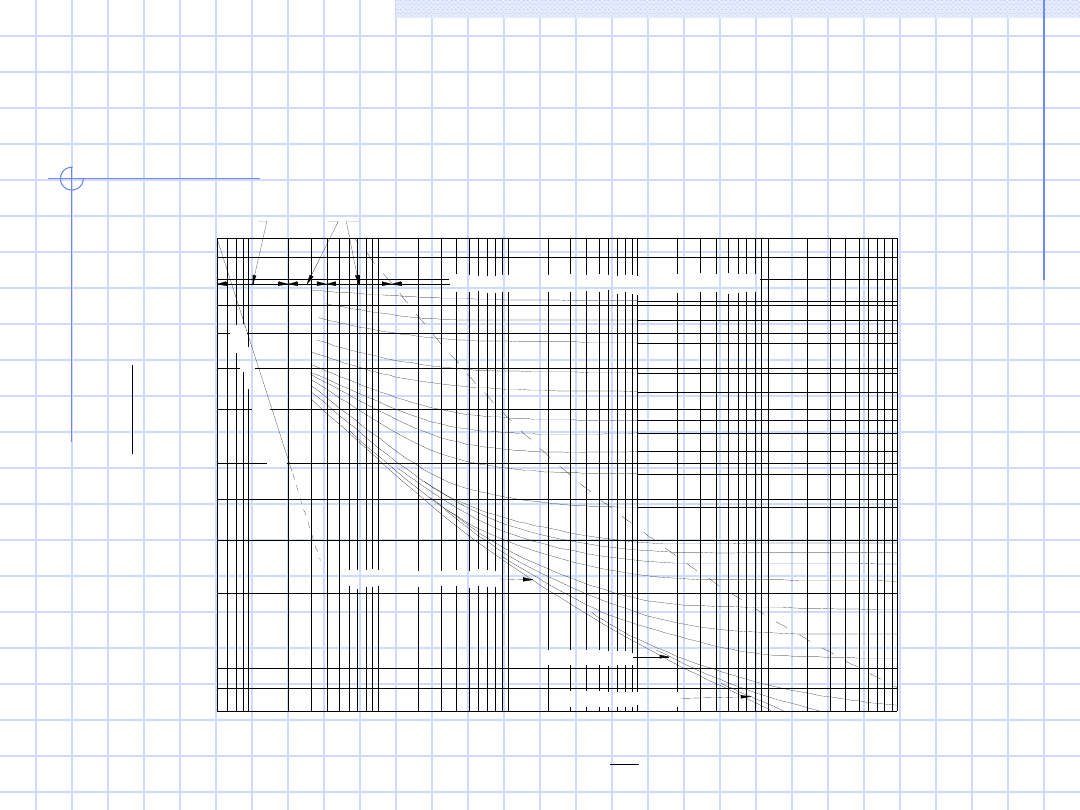
Moody Chart for pipe friction with
smooth and rough walls
1 0
1 0
4
1 0
1 0
1 0
1 0
5
6
7
8
3
0 . 0 0 8
0 . 0 0 9
0 . 0 1 5
0 . 0 2 5
0 . 0 2 0
0 . 0 1 0
0 . 0 3 0
0 . 0 4 0
0 . 0 5 0
0 . 0 6 0
0 . 0 7 0
0 . 0 8 0
0 . 0 9 0
0 . 1 0
R e y n o ld s N u m b e r , R e =
V D
F
ri
ct
io
n
F
a
ct
o
r
f
=
h
f
(L
/D
)V
/(
2
g
)
2
0 . 0 0 0 0 1
0 . 0 0 0 0 5
0 . 0 0 0 1
0 . 0 0 0 2
0 . 0 0 0 4
0 . 0 0 0 6
0 . 0 0 0 8
0 . 0 0 1
0 . 0 5
0 . 0 4
0 . 0 3
0 . 0 2
0 . 0 1
0 . 0 1 5
0 . 0 0 8
0 . 0 0 6
0 . 0 0 4
0 . 0 0 2
R
e
la
tiv
e
R
o
u
g
h
n
e
ss
,
/D
L a m i n a r
F l o w
C r i ti c a l
Z o n e
T r a n s i ti o n
Z o n e
La
m
in
a
r F
lo
w
f =
6
4/R
e
/D = 0 . 0 0 0 0 0 5
/D = 0 . 0 0 0 0 0 1
C o m p l e te T u r b u l e n c e , H y d r a u l i c a l l y R o u g h
H y d r a u l i c a l l y S m o o th
k
k
k
Document Outline
- Slide 1
- Slide 2
- Slide 3
- Slide 4
- Slide 5
- Slide 6
- Slide 7
- Slide 8
- Slide 9
- Slide 10
- Slide 11
- Slide 12
- Slide 13
- Slide 14
Wyszukiwarka
Podobne podstrony:
2002 04 41
2002 07 19
2013 04 19 Poststrukturalizm i postmodernizm wykład
2002 04 30
SERWIS 2010.04.19
Matematyka dyskretna 2002 04 Rachunek prawdopodobieństwa
2002 04 06
2002 04 34
2002 04 10
2002 04 07
2002 04 12
2002 04 28
2002 04 33
2002 04 07 wycena akcji, FCFF, FCFF, dźwignie finansowe, progi rentowności
2002 11 19
04 19 belki i ramy zadanie 19id Nieznany (2)
2012 04 19 czesc 1
2002 04 39
więcej podobnych podstron