
A New Definition of Pharmaceutical Quality: Assembly of a Risk
Simulation Platform to Investigate the Impact of Manufacturing/
Product Variability on Clinical Performance
STEVEN M. SHORT,
1
ROBERT P. COGDILL,
2
FRANK D’AMICO,
3
JAMES K. DRENNEN III,
1
CARL A. ANDERSON
1
1
Duquesne University Graduate School of Pharmaceutical Sciences, 410A Mellon Hall, 600 Forbes Avenue, Pittsburgh,
Pennsylvania 15282
2
College of Engineering, University of Nebraska-Lincoln, 114K Othmer Hall, Lincoln, Nebraska 68588-0642
3
Duquesne University McAnulty Graduate School of Liberal Arts, 215 College Hall, 600 Forbes Avenue, Pittsburgh,
Pennsylvania 15282
Received 17 February 2010; revised 8 April 2010; accepted 18 April 2010
Published online 22 June 2010 in Wiley Online Library (wileyonlinelibrary.com). DOI 10.1002/jps.22219
ABSTRACT: The absence of a unanimous, industry-specific definition of quality is, to a certain
degree, impeding the progress of ongoing efforts to ‘‘modernize’’ the pharmaceutical industry.
This work was predicated on requests by Dr. Woodcock (FDA) to re-define pharmaceutical
quality in terms of risk by linking production characteristics to clinical attributes. A risk
simulation platform that integrates population statistics, drug delivery system characteristics,
dosing guidelines, patient compliance estimates, production metrics, and pharmacokinetic,
pharmacodynamic, and
in vitro–in vivo correlation models to investigate the impact of man-
ufacturing variability on clinical performance of a model extended-release theophylline solid
oral dosage system was developed. Manufacturing was characterized by inter- and intra-batch
content uniformity and dissolution variability metrics, while clinical performance was described
by a probabilistic pharmacodynamic model that expressed the probability of inefficacy and
toxicity as a function of plasma concentrations. Least-squares regression revealed that both
patient compliance variables, percent of doses taken and dosing time variability, significantly
impacted efficacy and toxicity. Additionally, intra-batch content uniformity variability elicited a
significant change in risk scores for the two adverse events and, therefore, was identified as a
critical quality attribute. The proposed methodology demonstrates that pharmaceutical quality
can be recast to explicitly reflect clinical performance.
ß
2010 Wiley-Liss, Inc. and the American
Pharmacists Association J Pharm Sci 99:5046–5059, 2010
Keywords:
Monte Carlo; simulations; content uniformity; dissolution; toxicity; risk
assessment; quality; pharmaceutical quality; quality by design; theophylline
INTRODUCTION
By and large, the pharmaceutical industry lags
behind other manufacturing sectors in terms of asse-
ssed product quality. A study published in 2007 based
on available benchmarks reported that pharmaceu-
tical manufacturers operate on a level of
35,000
defective units per 1,000,000 produced,
1
in contrast to
other sectors, which operate at Six Sigma production
(i.e., 3.4 defects for every 1,000,000 units when 1.5s
shift is applied). It is conceivable, however, that this is
more a function of out-of-date methods of assessing
quality, rather than widespread failures of pharma-
ceutical products to achieve customer (patient)
satisfaction.
Taking a measure of responsibility for the current
state, the Food and Drug Administration (FDA)
launched the Current Good Manufacturing Practices
(CGMPs) for the 21st Century campaign in 2002 to, in
their words, ‘‘modernize’’ the pharmaceutical indus-
try.
2
Their efforts commenced internally, and a new,
risk-based regulatory architecture was created to
refocus resources where they were needed most: areas
that pose the greatest risk to the public. In turn,
pharmaceutical companies were encouraged (i.e., if
they were not already doing so) to adopt risk- and
science-based approaches for drug discovery and
development. Numerous initiatives, reports, and gui-
dances followed (e.g., Process Analytical Technology,
Correspondence to: Carl A. Anderson (Telephone: 412-396-1102;
Fax: 412-396-4660; E-mail: andersonca@duq.edu)
Journal of Pharmaceutical Sciences, Vol. 99, 5046–5059 (2010)
ß
2010 Wiley-Liss, Inc. and the American Pharmacists Association
5046
JOURNAL OF PHARMACEUTICAL SCIENCES, VOL. 99, NO. 12, DECEMBER 2010
Quality by Design), many of which promote innova-
tion and offer examples as to how the associated
changes fit within the contemporary regulatory
environment. These documents underscore the need
for collective change (by both regulatory agencies
and pharmaceutical companies alike) and emphasize
several benefits that manufactures can reap from
innovation.
‘‘Quality’’ is explicitly or implicitly addressed in all
of these documents. To date, the exact definition of
quality in the pharmaceutical industry is unresolved,
which is restrictive given that one of the primary
objectives of the modernization initiative is to spur
innovation to ultimately enhance pharmaceutical
product quality. In 2004, Dr. Janet Woodcock, Dire-
ctor of the Center for Drug Evaluation and Research
(CDER) at the FDA, proposed re-defining pharma-
ceutical quality with regards to risk by linking
production characteristics to clinical attributes. ‘‘Risk
is the concept that can connect the desired clinical
attributes—clinical performance as labeled, absence
of contamination, and availability—to attributes
measured during production. Good pharmaceutical
quality represents an acceptably low risk of failing to
achieve the desired clinical attributes.’’
3
It is well understood that the clinical performance
of any therapeutic regimen is dependent on a number
of factors. For example, patient compliance drama-
tically influences safety and efficacy profiles. Conse-
quently, researchers and clinicians invest time and
energy to understand and control compliance rates.
Manufacturing of drug products also imposes a cert-
ain degree of risk of not achieving the desired clinical
outcomes. Despite its influence, little (if any) effort
is devoted to quantifying the risk associated with
manufacturing processes. If quality is to be re-defined
in terms of risk, probabilistic relationships between
production and clinical attributes must be established.
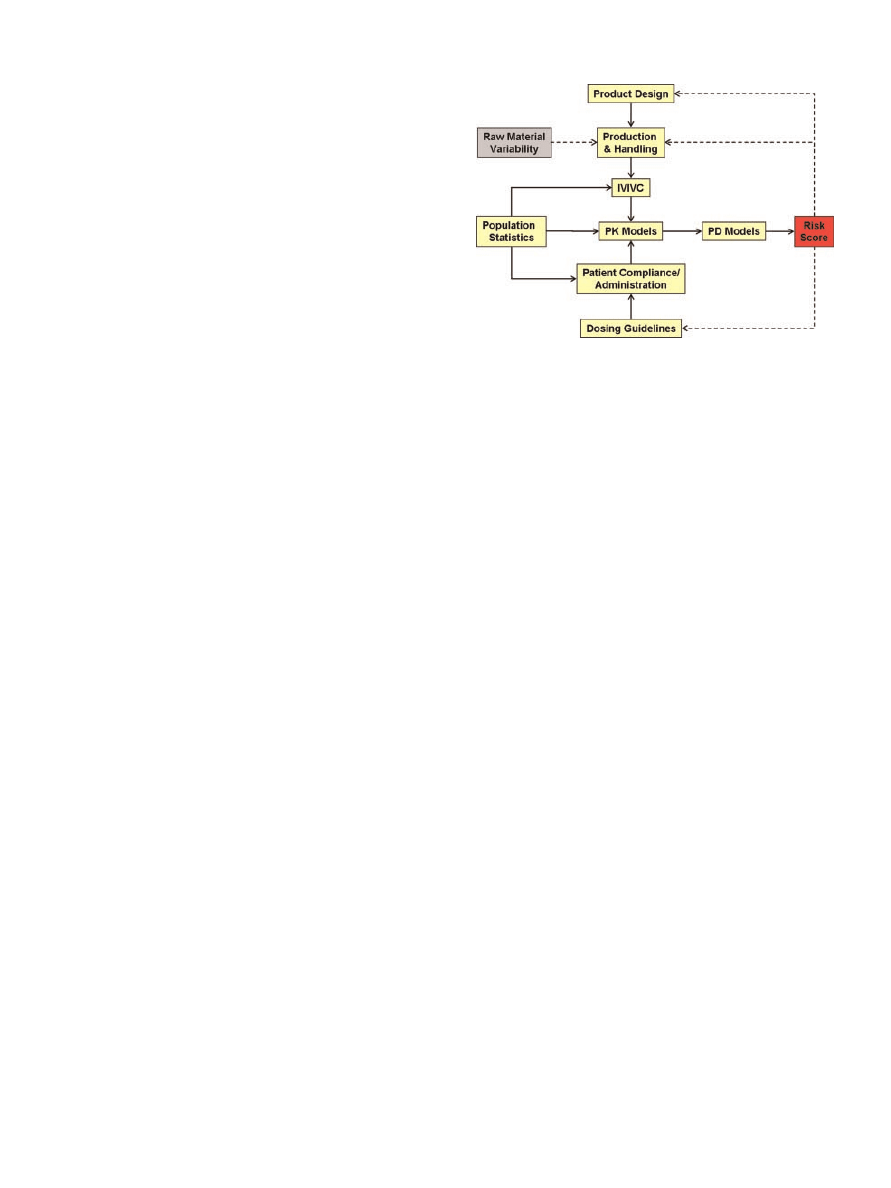
Cogdill and Drennen
4
described an approach for
relating manufacturing characteristics and clinical
performance of a drug product. They proposed the
combination of probabilistic risk assessment (PRA)
and Monte Carlo simulation (MCS) to relate elements
such as raw material quality, product design, popu-
lation statistics, dosing guidelines, and patient
compliance estimates with pharmacokinetic (PK),
pharmacodynamic (PD), and
in vitro–in vivo correla-
tion (IVIVC) models to remold quality in terms of risk
(Fig. 1). Their objective was to translate manufactur-
ing and drug product attributes into probabilistic risk
scores for toxicity and inefficacy. With these esti-
mates, product and process design could then focus on
minimizing the risk of adverse clinical outcomes.
The purpose of the current work is to illustrate one
potential method of relating manufacturing characte-
ristics of a drug delivery system to clinical perfor-
mance. The objectives are to (1) develop an approach
for harnessing MCS and PRA in order to estimate
the risks of inefficacy and toxicity and (2) estimate
the conditional risk of production characteristics on
clinical performance for a model theophylline solid
oral dosage system.
MATERIALS AND METHODS
The components of the simulation platform (summar-
ized in Fig. 1) were linked to generate risk scores,
which express the probability of observing an
inefficacious or toxic event given a set of conditions.
The following subsections describe each of the
elements in greater detail and state all underlying
assumptions that were necessary to achieve the
aforementioned objectives. Additionally, the final
segments explicate the overall methodology of the
risk simulations and how the resultant inefficacy and
toxicity data were analyzed.
Population Statistics: Patient Simulation
MCS has been shown to be an effective method for
generating hypothetical patient populations in situa-
tions where it is unreasonable and/or unethical to
utilize humans.
5,6
For the work herein, MCS was
used to generate asthmatic patients ranging in age
from 10 to 90 years; patients outside of this range
were not modeled due to the lack of data pertaining
to the targeted factors. A detailed account of the
methodology and data used to generate the 100,000-
patient population has been provided elsewhere.
7
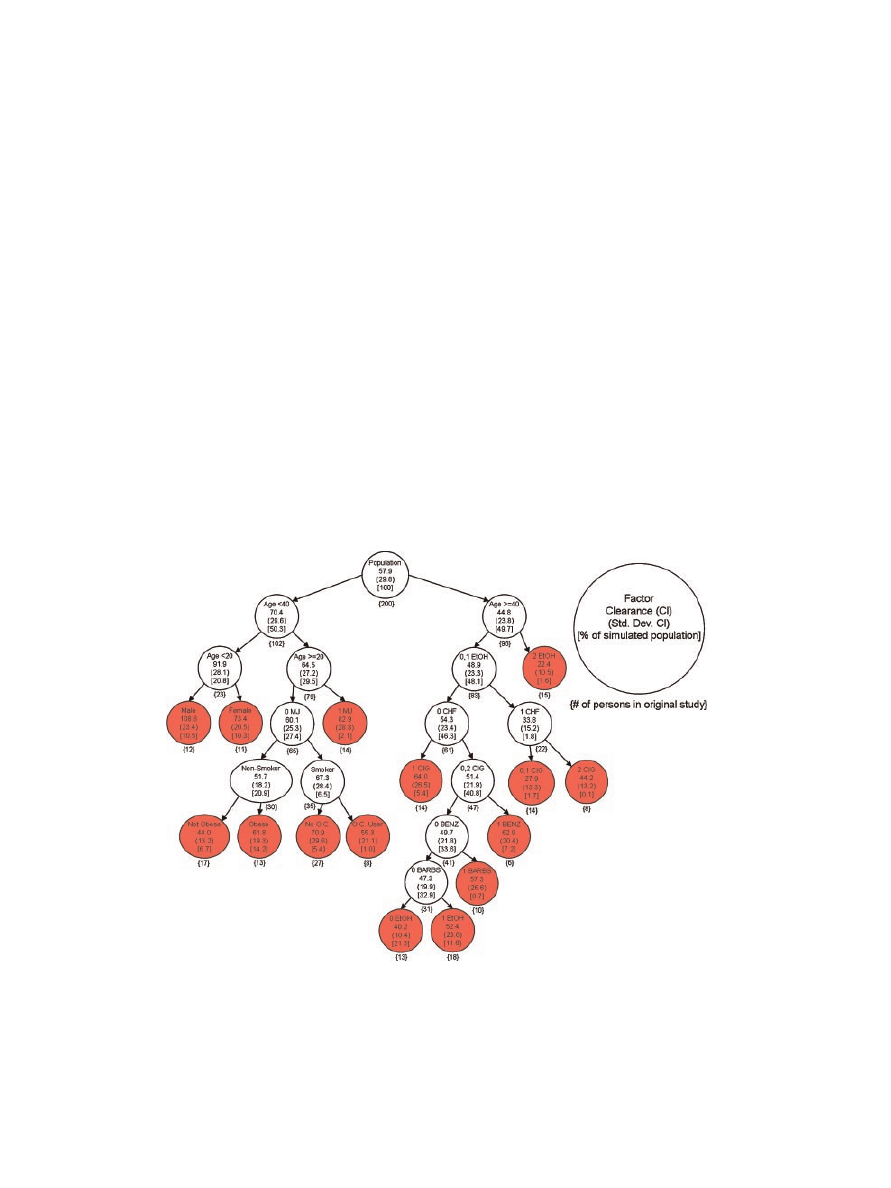
The
most significant factors affecting the disposition of
theophylline, as determined by Jusko et al.
8
were
Figure 1. Schematic of the various model components
that comprise the risk simulation platform. Figure adapted
from Cogdill and Drennen.
4
Solid arrows represent compo-
nents that are currently linked in the platform, whereas
dotted arrows signify components/concepts that have yet to
be incorporated.
DOI 10.1002/jps
JOURNAL OF PHARMACEUTICAL SCIENCES, VOL. 99, NO. 12, DECEMBER 2010
A NEW DEFINITION OF PHARMACEUTICAL QUALITY
5047
specified to effectively represent inter-patient varia-
bility. The factors included age, gender, weight, body
mass index, congestive heart failure, concomitant
drug therapies, alcohol consumption, cigarette smok-
ing, marijuana use, and intake of oral contraceptives.
All modeling and MCS simulations were performed
using routines written in-house (Matlab, version
7.1, The MathWorks, Natick, MA and PLS_Toolbox,
version 3.0, Eigenvector Research, Inc., Manson,
WA).
Once all of the factors were accounted for, theophyl-
line clearance was individualized for each patient
according to the clearance cascade adapted from
Jusko et al.
8
(Fig. 2). The terminal node on the
clearance cascade was determined for each patient
based on the individualized factors that predispose
theophylline disposition. The percentage of the total
100,000-patient population that fell within each node
is reported in Figure 2. Once it was determined which
node best described a given patient, the mean and
standard deviation of that particular node (Fig. 2)
were used to generate a normal distribution, from
which a single value, representing the individual
patient’s theophylline clearance, was extracted.
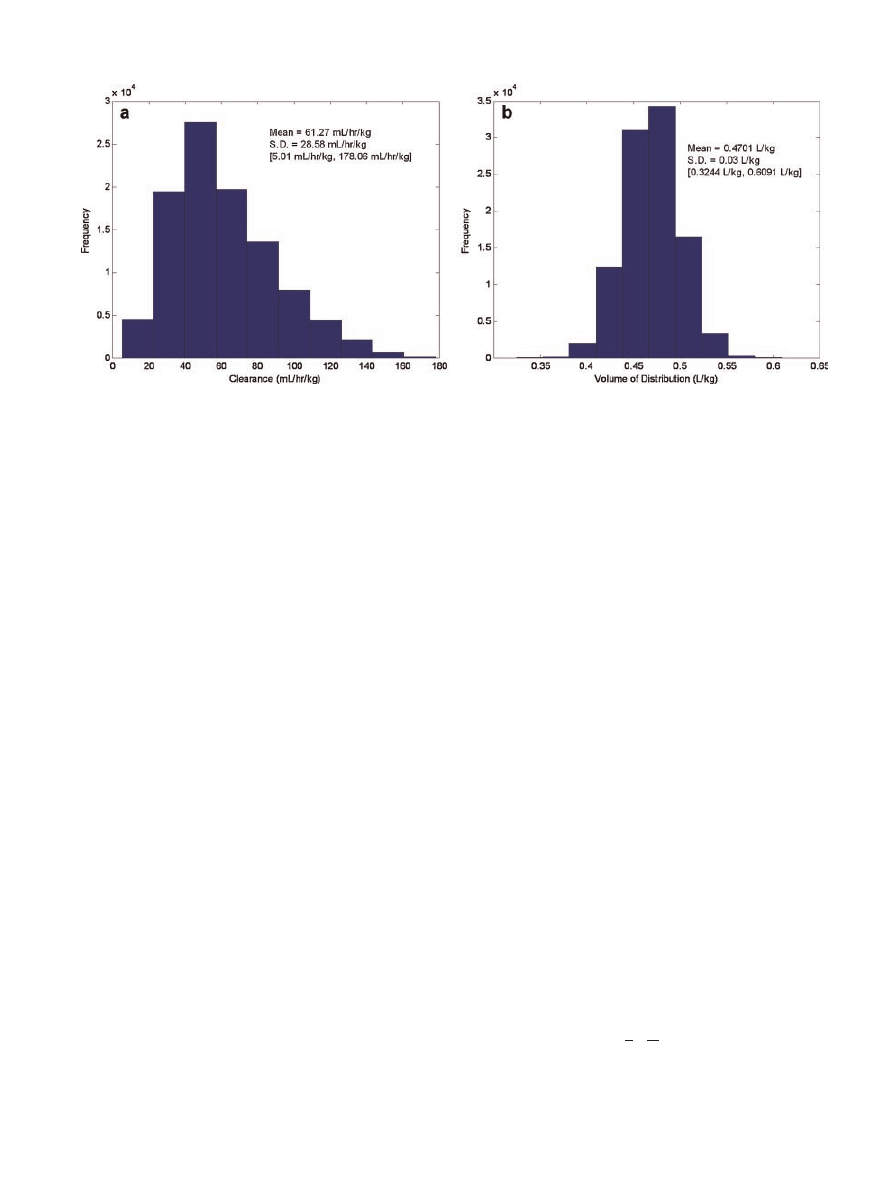
Clearance estimates were restricted to 5–180 mL/h/
kg. The distribution of clearance for the 100,000-
patient population based on the factors studied is
summarized in Figure 3. Theophylline clearance was
assumed to be constant throughout the course of
treatment.
Volume of distribution was assigned by randomly
sampling a normal distribution defined by a mean
volume of distribution of 0.47 L/kg and a standard
deviation of 0.03 L/kg. While previous studies have
assumed one (constant) average volume of distri-
bution for all patients (e.g., 0.45 L/kg),
8,9
the authors
considered this to be more representative of the
variability that would be encountered in actual
patients. The volume of distribution values for the
100,000-patient population are shown in Figure 3.
Analogous to clearance, the volume of distribution
was assumed to be constant for each patient during
the course of simulated therapy. The application of
invariant clearances and volumes of distribution is
commensurate with previous published studies.
8–10
Product Design: Model Solid Oral Dosage Form
A solid oral theophylline dosage system that was
previously formulated and processed at Duquesne
University (Pittsburgh, PA) and compacted at a local
Figure 2.
Clearance cascade detailing the average theophylline clearance for indivi-
duals classified according to numerous factors. Figure was adapted from Jusko et al.
8
Both the number of individuals in the original study by Jusko et al. and the percentage of
the 100,000 simulated population that fell within each node are indicated. All terminal
nodes are shaded. 0, 1, and 2 signifies the extensiveness of a given factor as delineated in
the original study. MJ, Marijuana; OC, oral contraceptive; EtOH, alcohol; CHF, con-
gestive heart failure; CIG, cigarette smoker; BENZ, benzodiazepines; BARBS, barbi-
turates.
JOURNAL OF PHARMACEUTICAL SCIENCES, VOL. 99, NO. 12, DECEMBER 2010
DOI 10.1002/jps
5048
SHORT ET AL.
pharmaceutical company was utilized for the esti-
mations of manufacturing variability and clinical
performance. The experimental details regarding
these tablets have been described elsewhere.
11
Briefly, three separate manufacturing routes (i.e.,
direct compression, roller compaction, and wet
granulation) were used to produce 300 mg standard
round bi-convex 3/8 in. diameter tablets on an 18-
station high-speed rotary tablet press (model HT-
AP1855-U/I, Elizabeth Hata, North Huntingdon, PA).
Eighteen distinct batches were manufactured using
the direct compression and roller compaction routes,
whereas 12 batches were produced via wet granula-
tion. For the direct compression and roller compaction
(Chilsonator, model IR 220, The Fitzpatrick Com-
pany, Elmhurst, IL) manufacturing methods, various
combinations of anhydrous theophylline (BASF),
lactose monohydrate (316 Fast Flo, Foremost Farms,
Baraboo, WI), microcrystalline cellulose (Avicel PH-
102, FMC Biopolymer, Philadelphia, PA), and mag-
nesium stearate (Spectrum Chemical, New Bruns-
wick, NJ) were processed and tableted. Tablets
produced using the wet granules (planetary mixer,
model 838F, Hobart, Troy, OH) consisted of anhy-
drous theophylline, lactose monohydrate, magnesium
stearate, and corn starch (Spectrum Chemical); a
starch paste was used as the binding agent. For all
three manufacturing methods, the compaction pres-
sure was adjusted to yield crushing strengths of 8, 11,
or 14 kp. The nominal amount of theophylline was
either 90 or 133 mg.
USP apparatus 2 dissolution testing was performed
using a Distek dissolution system (model 2100B) at a
paddle speed of 50 revolutions per minute (RPM). The
dissolution system was equipped with Hewlett-
Packard (Palo Alto, CA) UV–Vis spectrometer (model
8453) and a closed-loop automated sampler (Distek,
Inc., North Brunswick, NJ). All dissolution testing
was performed using deionized, de-aerated water as
the medium in 900 mL Peak
TM
glass vessels at
37
0.18C. The absorbance of theophylline was
detected at 272 nm in 10 mm pathlength quartz flow
cells following the construction of a standard curve. In
total, 12 tablets per batch for each unique manufac-
turing route were assessed.
The Weibull function is often used to describe
empirical dissolution data.
12
Dissolution profiles (i.e.,
percent theophylline released) of tablets produced via
the direct compression, roller compaction, and wet
granulation methods were modeled using the two-
parameter Weibull function described by Eq. (1):
f V
ð Þ ¼ 1 e
ðV=aÞ
b
(1)
where
V is the vector of dissolution time points to
be modeled (
v
i
0), b is the Weibull slope or shape
parameter (b > 0), and a is the Weibull scale
parameter (a > 0). For dissolution modeling, the time
constant (a) is often represented as
T
63.2
, the time at
which 63.2% of the drug is released. Eq. (1) describes
the cumulative distribution function (CDF), or the
cumulative probability of occurrence for a given
random variable (
V). Similarly, the derivative of
the CDF describes the probability density function
(PDF), which is the probability distribution of a
continuous random variable. The PDF is expressed by
the equation:
f
0
V
ð Þ ¼
b
a
V
a
b
1
e
ðV=aÞ
b
(2)
where
V, b, and a are as previously defined. A random
variable is said to be Weibull distributed if its CDF or
Figure 3. Frequency histograms of clearance (a) and volume of distribution (b) for the
100,000 simulated patients. The mean, standard deviation (SD), and range [ , ] of each
parameter are also provided.
DOI 10.1002/jps
JOURNAL OF PHARMACEUTICAL SCIENCES, VOL. 99, NO. 12, DECEMBER 2010
A NEW DEFINITION OF PHARMACEUTICAL QUALITY
5049

PDF are adequately represented by Eqs. (1) or (2) (or
the equivalent one- or three-parameter functions).
Once the dissolution profiles are fit using a Weibull
function, the PDF (Eq. 2) can be used to approximate
the dissolution rate. Each dissolution curve was
modeled by its reduction to a shape and a scale
parameter.
Content uniformity testing was also performed
on dissolved tablets using a UV–Vis spectrometer
(Hewlett-Packard, model 8453). Tablets were pulver-
ized and dissolved in deionized water. The absorbance
of theophylline was detected at 272 nm in 10 mm
pathlength cuvettes at 258C using a standard curve
independent of the one implemented for dissolution
testing. Uniformity of tablets produced from all three
manufacturing routes was assessed. In total, 10
tablets per batch for each unique manufacturing
routine were analyzed.
Dissolution time constants and content uniformity
estimates were segregated by batch to generate esti-
mates of manufacturing variability. Intra-batch
refers to the standard deviation of mean-centered
observations within a batch, whereas inter-batch
denotes the standard deviation of the mean observa-
tions across all batches (e.g., content uniformity,
dissolution time constant).
IVIVC, PK, and PD Models
The remaining components of the risk simulation
platform (delineated by solid arrows in Fig. 1) were
compiled and described elsewhere.
7
Briefly, the
(
in vitro) release and (in vivo) absorption profiles of
several novel, self-prepared, sustained-release (SR)
theophylline formulations in addition to a commercial
SR theophylline product (i.e., Theotrim), each admi-
nistered to six healthy volunteers in a crossover
study, were fit using a power law to determine the
IVIVC function.
13
The resultant nonlinear function
for transforming
in vitro release to in vivo absorption
was determined to be
R
B
¼ 0:465R
0:672
D
(3)
where
R
B
is the
in vivo absorption rate, R
D
is the
in vitro dissolution release rate, and 0.465 and 0.672
are the scale factor and power law parameter,
respectively. The coefficient of determination for this
function was 0.943.
Researchers have advocated the use of linear,
one-compartment models for the analyses of theo-
phylline delivery systems.
10,14–21
First-order phar-
macokinetics, via a one-compartment open model,
were assumed to adequately describe theophylline
plasma concentrations following administration of
the solid oral dosage form. Since multiple dosages
were administered throughout the course of therapy,
the principle of superposition was applied.
22
The
superposition principle assumes that the pharmaco-
kinetics of the drug are not dose-dependent and that
the drug is eliminated by first-order kinetics, which
are reasonable assumptions for the administration of
theophylline.
9,10,14–21
The change in theophylline
plasma concentration as a function of time was mod-
eled using the equation
d
C
p
d
t
¼
DSA
V
d
W
ba
b
t
b
1
e
ðt=aÞ
b
i
P
Cl
1000
V
d
C
p
(4)
where
C
p
is the theophylline plasma concentration
(mg/L),
t is the time (h), S is the optional scaling
factor,
D is the dose (mg), V
d
is the volume of dist-
ribution (L/kg),
W is the patient’s total body weight
(kg), b is the Weibull shape parameter, a is the
Weibull time constant (h),
A is the IVIVC scale factor,
P is the IVIVC power law parameter, and Cl is clear-
ance (mL/kg/h). All simulations were performed with
S at a constant value of 1.0. The output is mg/L/h of
theophylline.
Analogous to the work of Buchwald,
23
theophylline
input was modeled using sigmoidal lag time and cut-
off coefficients where absorption was assumed to be
100% of the maximum rate after 0.5 h (i.e., lag time)
and the absorption potential was reduced to 50% after
8 h (i.e., cut-off) to simulated time-dependent phe-
nomena. These coefficients were used to adjust the
input (
I) of theophylline through the following series
of equations
I
¼
DSA
V
d
W
ba
b
t
b
1
e
ðt=aÞ
b
h
i
P
(4a)
lagtime
¼
1
1
þ e
t0:5
ð
Þð15=0:5Þ
(4b)
cut-off
¼ 1
1
1
þ e
t8
ð
Þ
(4c)
d
C
p
d
t
¼ I lagtime cut-off
ð
Þ
Cl
1000
V
d
C
p
(4d)
Eq. (4d) is analogous to the original PK model (Eq. 4)
with the exception of the lag time and cut-off terms. A
numerical solution to Eq. (4d) was obtained for each
simulation time point using a Matlab-based differ-
ential equation solver.
Ideally, more than one PD model is useful for a
risk assessment tool such as the one described herein.
For example, access to several PD models that char-
acterize the probability of efficacy, the probability
of multiple adverse events (e.g., headache, vomiting,
and seizure) and the covariance between these obser-
vations is optimal. Said models, however, will not be
available during the initial stages of risk assessment.
Furthermore, efficacy may be characterized by vari-
ous responses (e.g., forced expiratory volume, number
of asthmatic attacks, quality of life), further obscur-
ing the dose–response relationship and thus, the
JOURNAL OF PHARMACEUTICAL SCIENCES, VOL. 99, NO. 12, DECEMBER 2010
DOI 10.1002/jps
5050
SHORT ET AL.

probability of a given outcome. Therefore, it was
necessary to assume an underlying probabilistic
PD model, which can be replaced, augmented, or
combined with additional models as the level of
understanding increases.
A probabilistic-based PD model detailing the gen-
eral efficacy and toxicity of theophylline was not
readily available. Therefore, the authors chose to
implement a model for a hypothetical drug, which
also had a therapeutic range of 10–20 mg/L (labeled
Figure 1.7 in the original reference).
24
Data points
were estimated using a tracing program (written
in-house) and were fitted using a sigmoid function.
The PD model originally described the probability (%)
of efficacy and toxicity as a function of drug concent-
ration. The estimated sigmoid functions for efficacy
and toxicity are provided in Eqs. (5a) and (5b),
respectively
^
P
E
¼
74:77
1
þ e
Z0:96
ð
Þ9:70
½
þ 3:83
(5a)
^
P
T
¼
74:29
1
þ e
Z1:40
ð
Þ19:40
½
þ 3:77
(5b)
where ^
P
E
and ^
P
T
are the predicted probabilities (%)
for efficacy and toxicity, respectively, and
Z is the
vector of log-transformed theophylline plasma con-
centrations (mg/L). The PD model was adapted to
describe the probability (%) of inefficacy and toxicity
as a function of theophylline plasma concentration.
Inefficacy estimates were generated by subtracting
the efficacy probabilities from 100%. No specific
distinctions were made between various inefficacious
or toxic events; the likelihoods of observing, for
example, a headache or a seizure were identically
weighted.
Dosing
Each patient was subjected to an iterative dosing
scheme where the initial dose (
D) was estimated
using the equation:
D
¼
C
T
Cl
ð1=1000ÞWQ
F
(6)
where
C
T
is the target plasma concentration (i.e., the
median concentration of the therapeutic window,
defined as 10–20 mg/L), Cl is the individual’s theo-
phylline clearance as predicted by the Jusko et al.
8
model (mL/h/kg),
W is the patient’s weight (kg), Q is
the time interval between doses (i.e., 12 h), and
F is
the fraction of dose absorbed systemically. A constant
value of 0.8 was assumed for
F, which is comparable
to values reported for other oral theophylline formul-
ations.
15
Based on the nominal amount of theophyl-
line assumed to be in each tablet (i.e., 100 mg), the
number of tablets necessary to yield the initial dose
was estimated (the number of units was rounded to
the nearest integer). Following a period of time
assumed to be sufficient to reach steady state (i.e., five
doses), the patient’s plasma concentration was esti-
mated using Eq. (4d). If the dose was found to be
inadequate, it was incrementally adjusted until the
iterative dosing scheme converged on a satisfactory
dosage. If, however, the dose was adequate to yield a
plasma concentration between the minimum effective
concentration (MEC) and the minimum toxic con-
centration (MTC), treatment was initiated and the
patient was administered the said dose for the durat-
ion of the trial period. Data from the dose adjustment
iterations were not included in calculation of risk
scores.
Simulation of Risk Scores
All risk simulations employed a MCS routine
independent of that used to generate the patients.
Furthermore, the patient population was generated
prior to the deployment of the risk simulation plat-
form. The simulation platform was constructed such
that the user is able to specify the age range of the
population to be tested (age is a covariate for all other
patient factors). The user is also able to specify
patient compliance and manufacturing variability
estimates, as well as details concerning the drug and
its corresponding therapy. These were estimated or
assumed for the model theophylline solid oral dosage
system tested herein (Tab. 1).
Given that one of the principal objectives of this
work was to estimate the conditional risk of process/
product variation on clinical performance, the simu-
lator was assembled such that the user could allow
or prohibit the estimates of certain factors to be sam-
pled according to their underlying distributions.
These factors included the inter- and intra-batch
relative standard deviation (RSD) of the dissolution
time constants, the inter- and intra-batch RSD of
content uniformity, the rate of patient compliance,
and the standard deviation of the dosing interval.
Table 1. Summary of the Manufacturing Variability
Metrics and the Treatment Parameters Used During
Simulation
Manufacturing Metrics
Intra-batch RSD of dissolution time constant
0.06
Inter-batch RSD of dissolution time constant
0.03
RSD of intra-batch content uniformity
0.03
RSD of inter-batch content uniformity
0.01
Simulation Parameters
Length of therapy (days)
30
Time interval between doses (h)
12
Standard deviation of dosing interval (h)
1
Therapeutic window (mg/L)
[10–20]
Rate of compliance (% of doses taken)
90
Fraction of dose absorbed
0.8
Dissolution time constant (h)
5.0
Nominal theophylline amount (mg)
100.0
DOI 10.1002/jps
JOURNAL OF PHARMACEUTICAL SCIENCES, VOL. 99, NO. 12, DECEMBER 2010
A NEW DEFINITION OF PHARMACEUTICAL QUALITY
5051

Thus, the user was required to set variability ‘‘flags’’
prior to the start of a simulation that turned the
factors ‘‘on’’ or ‘‘off’’ to assess their effect on risk. If a
factor was turned off, its estimate was consecutively
set to the same value, whereas if it was allowed to
vary, the estimate was influenced by the level of
variability or rate of adherence. For example, the
scenario where each tablet contains the same amount
of active (as per the label claim) represents the
highest degree of ‘‘quality’’ (minimal variability) in
terms of content uniformity. That is, the inter- and
intra-batch dosage variability flags were set to ‘‘off.’’
A total of six variability flags were to be set by the
user: inter- and intra-batch dosage variability, inter-
and intra- batch dissolution variability, patient
compliance variability, and dosing interval variabil-
ity. All, none, or a combination of these variability
flags may be turned on during the course of a given
simulation. When the dosing time interval was
subject to variation, each dosing time was altered
by the addition of a pseudo-random number drawn
from a normal distribution with zero mean and unit
standard deviation; the random number was multi-
plied by the standard deviation of the dosing interval
(Tab. 1) before it was added to the particular dosing
time. Otherwise, doses were administered at their
scheduled times. For simulations where patient com-
pliance was variable, compliance was modeled using a
binomial distribution where the success probability
was set to the assumed patient compliance (% of doses
taken); a value of 0 denoted a missed dose. Patients
were prohibited from missing two consecutive doses.
Noncompliance was prohibited during the patient-
specific iterative dosing scheme. Otherwise, all doses
were modeled as if taken.
The remaining four variability flags pertain to the
dosage form itself. For instances where inter-batch
dosage variability was initiated, the initial dose
administered to a patient (
D
0
) was randomly selected
from a normal distribution, with a mean set to
D
(Eq. 6), and a standard deviation set to the inter-batch
RSD of content uniformity (Tab. 1) multiplied by
D.
This estimate was the mean nominal dosage for that
patient throughout the course of treatment. Simi-
larly, the inter-batch dissolution variability flag alte-
red the dissolution time constant; a
0
was randomly
selected from a normal distribution with a mean
equal to the nominal time constant (a) and a standard
deviation set as the inter-batch RSD of the dissolution
time constant multiplied by the nominal a (Tab. 1).
Again, a
0
was held constant for the duration of
therapy. When intra-batch dosage variability was
prompted, each dose administered to a given patient
was adjusted from the nominal amount (either
D or
D
0
, depending on whether or not inter-batch dosage
variability was triggered) to reflect the level of
variability around the mean for the current batch.
This was accomplished by randomly selecting the
current dose from a normal distribution of mean
D or
D
0
and standard deviation of
D or D
0
multiplied by
the intra-batch RSD of content uniformity (Tab. 1).
Likewise, the intra-batch dissolution variability flag
altered the dissolution time constant for each dose; it
was randomly selected from a normal distribution
with a mean equal to the nominal time constant (a or
a
0
, depending on whether or not inter-batch dissol-
ution variability was triggered) and a standard
deviation set as the intra-batch RSD of the dissolution
time constant multiplied by a or a
0
. All, none, or a
combination of the four variability flags pertaining to
the dosage form itself could be turned on during the
patient-specific iterative dosing scheme. Otherwise,
the dose estimated using Eq. (6) was successively
administered assuming a constant dissolution time
constant. The simulation assumed that the 1-month
drug supply (for each patient) was drawn from a
single batch.
The final parameter addressed was b. The Weibull
shape parameter was estimated for each dose using
linear relationships describing the approximate med-
ian and maximum values of b as a function of a.
Specifically, b was randomly selected from a normal
distribution. The mean of the normal distribution
was set as the median value of b and the standard
deviation was set to the standard deviation of b, which
was estimated using the 99.9% confidence interval for
a normal distribution and the difference between the
maximum and median shape parameters for a given
time constant. The minimum allowable value for
b
was 1.01.
With all of the parameters set, the risk simulator
commenced by first excluding those patients not
meeting the age criteria, that is, if the criteria differed
from 10 to 90 years. Each patient was randomly
selected from the subpopulation and dosed accordingly.
Once the appropriate dose was determined for each
patient, he/she was administered treatment. Through-
out the course of the therapy, a patient’s theophylline
plasma concentration was monitored by integrating
Eq. (4d). Plasma concentrations were estimated six
times per hour. These data were stored and super-
imposed over the course of treatment. A frequency
histogram summarizing theophylline plasma levels
was generated for each patient; responses were seg-
regated (i.e., binned) into 0.25 mg/L intervals.
Probabilistic estimates of observing inefficacious
and toxic events were predetermined for theophylline
concentrations ranging from 0 to 100 mg/L at 0.25 mg/
L increments using the PD sigmoid functions (Eqs. 5a
and 5b). Using these concentration-based likelihoods,
risk estimates (or scores) were generated after each
patient was treated. First, the plasma concentration
histograms were aggregated (i.e., data within each
concentration bin were amassed for all patients
JOURNAL OF PHARMACEUTICAL SCIENCES, VOL. 99, NO. 12, DECEMBER 2010
DOI 10.1002/jps
5052
SHORT ET AL.
tested). Next, the aggregated plasma concentration
data was transformed into a CDF. Provided that both
the PD functions and the pooled CDF were generated
using the same concentration axis, plots of the ineffi-
cacy risk scores versus the aggregated CDF data
and the toxicity risk scores versus the aggregated
CDF data were generated. These plots were used to
interpret the percentage of the population that had a
risk score at or below a given value (i.e., the likelihood
of observing an adverse event within a sample popu-
lation given the observed plasma concentrations).
Example plots for inefficacy and toxicity are shown in
Figure 4a and b, respectively. These plots illustrate
that 95% of the sample population had an inefficacy
risk score
25.62% and a toxicity risk score of 8.01%
for the given trial simulation. In other words, 95% of
the population was treated such that there was a
maximum likelihood of 25.62% and 8.01% for obser-
ving an inefficacious or toxic event, respectively.
Rather than reporting multiple risk scores for both
inefficacy and toxicity, it was desirable to summarize
the risk to a sample population with a single risk score
for each adverse event. Thus, the empirical CDF/PD
function plots were interpolated to yield a single risk
score corresponding to a CDF probability of 0.95 for
both inefficacy and toxicity. A risk score summarizing
those tested was generated for each addition of a
patient. The number of iterations conducted was not
fixed; rather, the risk simulator continued to test
additional patients until the risk scores for inefficacy
and toxicity both stabilized below an oscillation
threshold. Stability of risk assessments was assessed
by calculating the absolute fractional change of the
median risk score (D) observed by adding one addi-
tional patient to the sample population using the
equation:
D
¼
abs median RS
i
n
i
¼1
median RS
i
n
1
i
¼1
median RS
i
n
i
¼1
(7)
where RS indicates the risk score for the
ith observation
and
n represents the number of patients assessed.
Patients were consecutively tested until the varia-
bility of the risk estimates for both inefficacy and
toxicity were below the threshold of 10
4
. Further-
more, the absolute change was required to retain a
value below the threshold for 250 consecutive
patients before the simulator converged on the risk
estimates; these criteria were required for both
inefficacy and toxicity. By this method, two risk
scores, one for inefficacy and one for toxicity, were
generated for each simulation trial.
Experimental Design
A six-factor full factorial design was generated to
assess the effects of manufacturing variability and
patient compliance on clinical performance. Two
levels for each factor were tested, corresponding to
the presence or absence of variability (i.e., factor on or
off, respectively). The six factors assessed were the
inter- and intra-batch RSD of the dissolution time
constants, the inter- and intra-batch RSD of content
uniformity, the rate of patient compliance, and the
standard deviation of the dosing interval. A value of
1 signified the presence of variability, whereas
0 represented its absence. Each row in the design
represented an independent risk simulation trial. The
full factorial experimental design was performed in
Figure 4. Plots of inefficacy (a) and toxicity (b) risk scores versus the fraction of
observations for the sample population tested. These data were interpolated (solid lines)
to determine the 95th percentile for inefficacy and toxicity.
DOI 10.1002/jps
JOURNAL OF PHARMACEUTICAL SCIENCES, VOL. 99, NO. 12, DECEMBER 2010
A NEW DEFINITION OF PHARMACEUTICAL QUALITY
5053
triplicate, which required a total of 192 simulations.
The simulation run order for each replicate of the
design matrix was randomized. The age range for
patient inclusion was not altered from that of the
general population.
Statistical Analyses
The resultant experimental design data were ana-
lyzed using standard least-squares regression and an
effects screening approach to determine the factors
that had a significant influence on the risk to ineffi-
cacy and toxicity. This approach calculated the type
III sums of squares. The inputs were coded as nominal
and the responses were coded as continuous. A full
factorial model was initially generated to consider all
potential interactions. Standard least-squares regres-
sion was also used to determine the final models for
inefficacy and toxicity; both the inputs and responses
were coded continuous. The significance level (a, not
to be confused with the Weibull scale parameter) for
all analyses was 0.05. All statistical analyses were
conducted in Matlab or JMP (version 8.0.1, SAS
Institute, Inc., Cary, NC). The risk scores for ineffi-
cacy and toxicity were analyzed independently.
RESULTS AND DISCUSSION
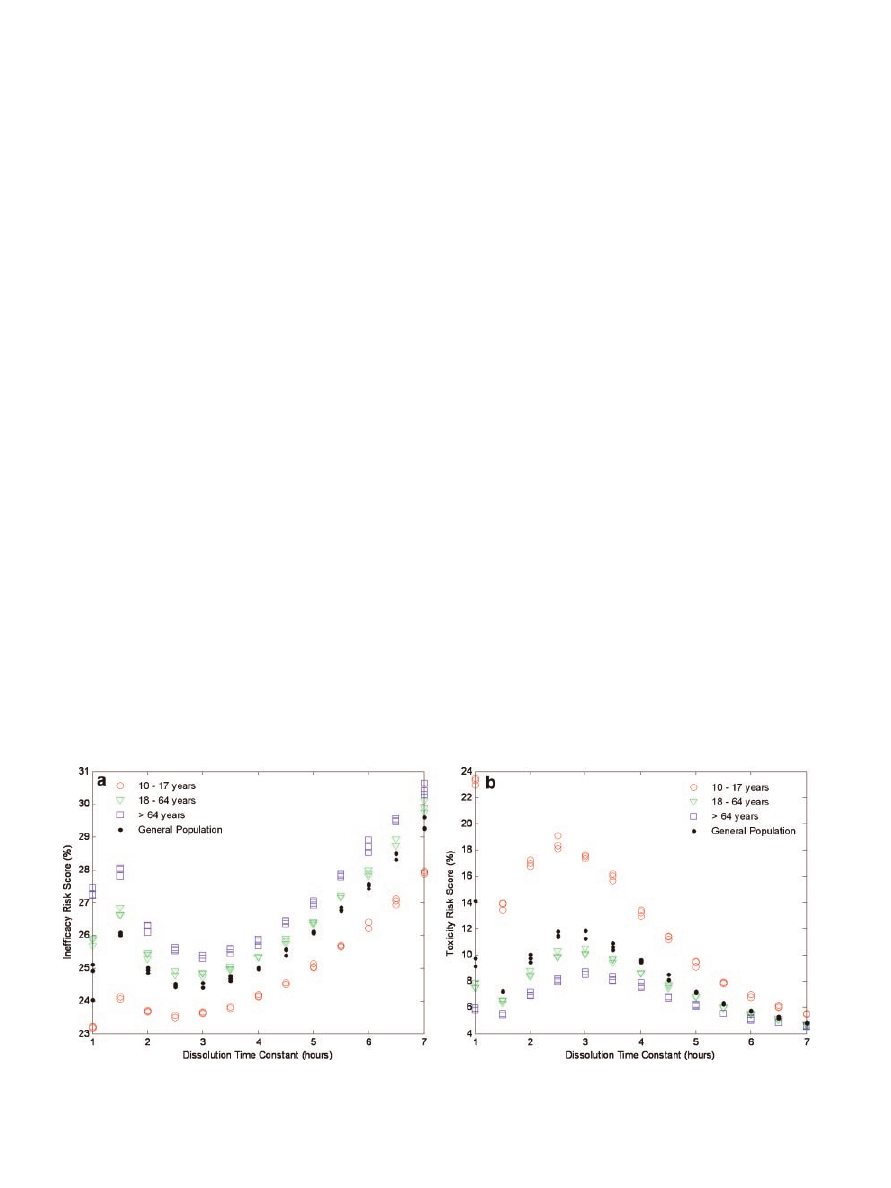
Dissolution Time Constant Optimization
The theophylline tablets produced from the three
manufacturing routes resulted in various dissolution
profiles. Thus, it was necessary to select an appro-
priate dissolution time constant that characterized
the release of theophylline for the model dosage form
prior to determining the conditional risk of product
quality on clinical performance. Dissolution time
constants ranging from 1 to 7 h were assessed at 0.5-h
intervals since the majority of the tablets modeled
yielded dissolution time constants in this range.
Variability in the six manufacturing and patient
compliance factors was prohibited during these trials.
Each time constant was assessed in triplicate and the
risk scores for inefficacy and toxicity are shown in
Figure 5a and b, respectively. Ultimately, a dissolu-
tion time constant that minimized the risk to
inefficacy and toxicity was desirable. Due to the local
inverse relationship between inefficacy and toxicity
(Fig. 5), the minimum risk for inefficacy occurred at a
time constant where risk of toxicity was the greatest.
Therefore, a time constant of 5.0 h was selected to
characterize the model theophylline dosage form as
this value favorably reduced the likelihood of toxic
events observed at shorter time constants and con-
currently minimized the increase in inefficacious
events observed at longer time constants. These risk
scores effectively represent the baseline risk from
which variations in clinical performance were asse-
ssed. The remaining simulations were run using the
parameter values indicated in Table 1 according to
the experimental design.
Experimental Design Analyses
The following screening and modeling efforts utilized
standard least-squares regression. The general app-
roach to linear modeling assumes that the response is
continuous over the range of negative infinity to
positive infinity. This assumption can be particularly
problematic for proportional responses (e.g., prob-
abilities), since, due to model error, the predictions
can be outside of the anticipated range (e.g., 0–1 or
0–100). Therefore, the estimates and standard errors
were examined for consistency and accuracy to
Figure 5.
Plots of inefficacy (a) and toxicity (b) risk scores versus various dissolution
time constants tested in different age-restricted sample populations.
JOURNAL OF PHARMACEUTICAL SCIENCES, VOL. 99, NO. 12, DECEMBER 2010
DOI 10.1002/jps
5054
SHORT ET AL.

substantiate the use of linear regression. The validity
of the other assumptions of linear regression (e.g.,
homoscedasticity, linearity, and normality) was also
verified. Additionally, predictor variables were ana-
lyzed for multicollinearity.
The resultant inefficacy and toxicity risk scores
for the 2
2 2 2 2 2 full factorial experimental
design are summarized in Table 2. The mean, median,
and standard deviation for the number of patients
needed to establish convergence for the 192 trial
simulations were 830, 807, and 203, respectively.
Risk scores for both inefficacy and toxicity were
approximately unimodally distributed; the assump-
tion of normality, therefore, is not unreasonable.
Accordingly, transformations were deemed to be
unnecessary. Simple linear regression revealed that
the scores for inefficacy and toxicity were negatively
correlated (
r
¼ 0.997). The inverse relationship was
a direct result of the PD model and the dosing
regimen; 95% of the patients were dosed such that the
CDF was consistently interpolated at theophylline
concentrations of 20–25 mg/L (the probabilities for
inefficacy and toxicity are linearly related with a
correlation coefficient of
0.976 over 20–25 mg/L).
Given their inverse relationship, the discussion is
predominately focused on toxicity. The corresponding
inverse statistical relationships for inefficacy were
confirmed.
Least-squares regression was used to determine
which factors had a significant impact on the risk of
an adverse event. Table 2 illustrates that the ranges
of risk scores were narrow for both adverse events.
Nevertheless, the full factorial screening revealed
that three main effects, intra-batch RSD of content
uniformity, rate of patient compliance, and standard
deviation of the dosing interval, significantly influ-
enced the probability of experiencing a toxic event. In
addition to these main effects, the first-order inter-
action between the rate of patient compliance and
the standard deviation of the dosing interval was
identified as significant. Two other higher order
interactions were significant; however, they were
determined to be spurious based on the insignificance
of the other main effects that comprised the interac-
tion terms. It is important to note that the same three
main effects were found to be significant for ineffi-
cacy. The interaction between the rate of patient
compliance and the standard deviation of the dosing
interval, however, was not strong enough to signifi-
cantly alter the likelihood of an inefficacious event.
This demonstrates the sensitivity of the risk simula-
tion platform to asymmetric risk, a phenomenon that
would go undetected with a standard ‘‘quality’’ metric
such as process capability (Cpk), which does not take
into account whether the deviation is positive or
negative with respect to the mean, nor its ultimate
impact on clinical outcomes. Two additional higher
order interactions were also significant for inefficacy;
they were determined to be spurious as well.
Following the full factorial screening exercise, a
2nd degree fractional screening was carried out to re-
assess the main effects and first-order interactions.
Analogous to the previous screening study, three
main effects, intra-batch RSD of content uniformity,
rate of patient compliance, and standard deviation
of the dosing interval, as well as the first-order
interaction between the rate of patient compliance
and the standard deviation of the dosing interval,
significantly influenced the probability of toxicity.
Likewise, intra-batch RSD of content uniformity, rate
of patient compliance, and standard deviation of the
dosing interval significantly influenced the probabil-
ity of inefficacy.
Subsequently, standard least-squares regression
was used to compare several potential linear models.
Ultimately, the final model for inefficacy included
three main effects, intra-batch RSD of content uni-
formity, rate of patient compliance, and standard
deviation of the dosing interval, while the model for
toxicity included these three main effects and the
first-order interaction between the rate of patient
compliance and the standard deviation of the dosing
interval. Intra-batch RSD of content uniformity and
standard deviation of the dosing interval functioned
to increase the probability of toxicity, whereas patient
Table 2. Summary Statistics for the 6-Factor Full
Factorial Experimental Design
Percentile
Metric
Probability (%)
Inefficacy
a
100.0%
Maximum
26.46
99.5%
26.46
97.5%
26.37
90.0%
26.28
75.0%
Quartile
26.14
50.0%
Median
25.98
25.0%
Quartile
25.79
10.0%
25.63
2.5%
25.54
0.5%
25.47
0.0%
Minimum
25.47
Toxicity
b
100.0%
Maximum
8.34
99.5%
8.34
97.5%
8.18
90.0%
8.00
75.0%
Quartile
7.70
50.0%
Median
7.37
25.0%
Quartile
7.14
10.0%
6.93
2.5%
6.82
0.5%
6.71
0.0%
Minimum
6.71
a
Metric—mean (%): 25.96; SD (%): 0.24; SEM (%): 0.017; upper 95%,
mean (%): 26.00; lower 95%, mean (%): 25.93; number of observations: 192.
b
Metric—mean (%): 7.43; SD (%): 0.39; SEM (%): 0.028; upper 95%, mean
(%): 7.48; lower 95%, mean (%): 7.37; number of observations: 192.
DOI 10.1002/jps
JOURNAL OF PHARMACEUTICAL SCIENCES, VOL. 99, NO. 12, DECEMBER 2010
A NEW DEFINITION OF PHARMACEUTICAL QUALITY
5055

compliance decreased the likelihood of experiencing a
toxic event.
Studentized residuals were, where appropriate,
analyzed to verify that the assumptions of linear
regression were valid for these data. Abnormal
patterns were not observed in any of the residual
plots (not shown), which further substantiated the use
of linear regression. The studentized residuals were
also used to identify potential outliers. No observations
were removed for either model. The experimental
design was replicated to assess lack of fit. Testing of
both models revealed that the null hypothesis, which
stated that the model fit these data, could not be
rejected. The predicted versus measured plots for the
two clinical outcomes (not shown) also illustrated
the appropriateness of the straight-line model.
The final models for inefficacy and toxicity revealed
that both patient compliance variables, percent of
doses taken and dosing time variability, and intra-
batch content uniformity significantly impacted
inefficacy and toxicity. With respect to inefficacy,
the whole model fit (3 degrees of freedom) had an
adjusted
R
2
of 0.87. The percent of doses taken, dosing
time variability, and intra-batch content uniformity
were all highly significant. With respect to toxicity,
the whole model fit (4 degrees of freedom) had an
adjusted
R
2
of 0.86. The percent of doses taken, dosing
time variability, intra-batch content uniformity, and
the interaction between the rate of patient compli-
ance and the standard deviation of the dosing interval
were all highly significant.
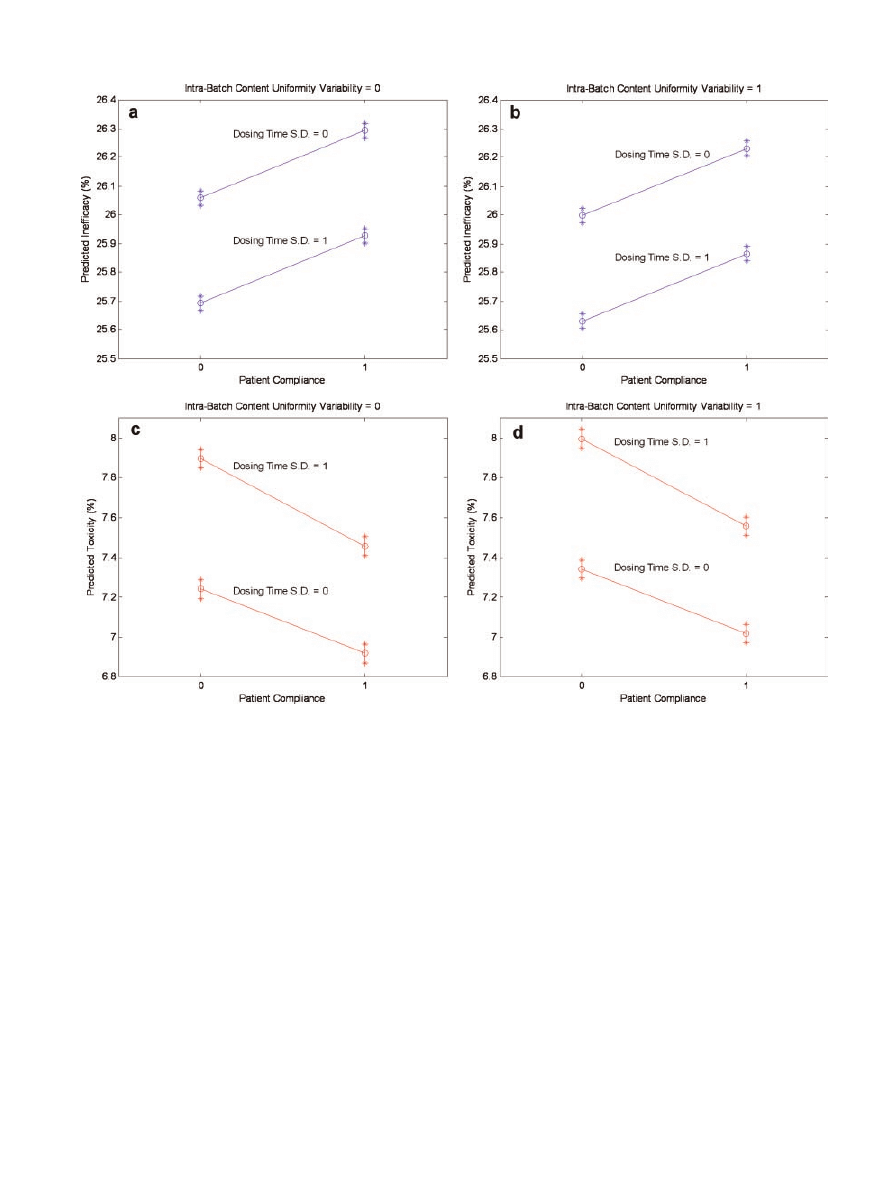
To further scrutinize the final models, the 95%
confidence intervals for the expected mean value were
grouped by all possible combinations of the indepen-
dent variables (tabular data not provided). Examina-
tion of the mean 95% confidence intervals revealed
that no two intervals overlapped across all possible
input combinations. This was the case for both ineffi-
cacy and toxicity. Lack of overlap further underscored
the significant change in risk scores induced by intra-
batch RSD of content uniformity, rate of patient
compliance, and standard deviation of the dosing
interval. These data were also used to generate plots
of the predicted probabilities for inefficacy and
toxicity adjusted for intra-batch content uniformity
variability, patient compliance, and the standard
deviation of the dosing interval (Fig. 6). The inter-
action between the rate of patient compliance and the
standard deviation of the dosing interval for the
toxicity model is demonstrated by the nonparallel
nature of the lines in subplots c and d; subplots a and
b substantiate the lack of interaction for the inefficacy
model.
Due to the overpowering variance explained by
patient compliance and dosing time variability, a
second 4-factor full factorial experimental design was
executed to evaluate the effects of manufacturing
variability when patient compliance was 100% and all
doses were administered precisely at the scheduled
dosing times. This was done to ensure that the two
patient factors (at the levels assessed) did not mask
subtle, yet important, manufacturing effects. The
mean, median, and standard deviation for the num-
ber of patients needed to establish convergence for the
48 trial simulations were 847, 822, and 192, res-
pectively. The results were not statistically different
from those of the 6-factor design. Both experimental
designs ultimately revealed that intra-batch content
uniformity was the only manufacturing factor asse-
ssed that significantly influenced the probability of an
adverse event. Risk simulation, therefore, identified
intra-batch content uniformity as a critical quality
attribute (CQA). While the other factors are not to be
disregarded (beyond the range evaluated), it would be
unreasonable to invest a large sum of resources into
further reducing the precision of manufacturing such
that dissolution variability consistently passed strict
specifications seeing as how the current level of vari-
ability did not significantly alter clinical performance.
It is important to note that the conditional risk,
regardless of whether or not patients are compliant, is
dependent upon the manufacturing estimates tested.
For example, assume that the RSD of content uni-
formity (both inter- and intra-batch) is comparable to
the estimates assessed (Tab. 1), but, due to poor
control during tableting, the estimates for dissolution
time variability are worse. Lack of control during
tableting could result in highly variable compression
pressures, which, in turn, would sequentially yield
erratic (1) radial tensile strengths, (2) dissolution
profiles, and (3) exposure–response profiles. These
changes would undoubtedly affect the portion of
variability explained by the inter- and intra-batch
dissolution time constant factors.
The conditional risk is also expected to vary from
product to product. While dissolution variability (at
the level tested) did not significantly impact clinical
performance for the model solid oral dosage system, it
may very well significantly influence, for example, an
immediate release tablet. For instance, moderate
dissolution variability could result in subtherapeutic
levels at the critical time period following adminis-
tration (e.g., 30 min), which would most likely result
in clinical inefficacy. These effects were not as pro-
nounced in the model system, most likely because the
factors were assessed once patients were at steady
state. Dissolution variability, therefore, was not large
enough to induce an adverse event. Although dissol-
ution was found to be insignificant, it should be
acknowledged that wider levels of variability (e.g.,
‘‘catastrophic’’ failure) were not evaluated.
In addition to product dependence, risk to clinical
performance is also dependent on the production
method. A substantial change in the manufacturing
JOURNAL OF PHARMACEUTICAL SCIENCES, VOL. 99, NO. 12, DECEMBER 2010
DOI 10.1002/jps
5056
SHORT ET AL.
route, such as from direct compression to wet gran-
ulation, is likely to considerably alter drug dissolu-
tion, and, therefore, clinical performance if the
change is not optimized with respect to the desired
quality target product profile (QTPP).
25
The adjust-
ment, however, does not need to be so dramatic to
have an effect on the patient. A switch in the blending
protocol from a v-blender to a bin blender is likely to
affect the inter- and intra-batch content uniformity if
the process critical control parameters (PCCPs) are
not optimized with regard to the QTPP. Likewise, a
formulation modification from wet to dry addition of
the granulating binder has the potential to alter drug
dissolution, and ultimately, inefficacy or toxicity. For
these very reasons, changes in the manufacturing
protocol should be investigated with regard to their
impact on clinical performance. This can be accom-
plished by directly linking the process to clinical
performance via a design space. These results satisfy
objectives (1) and (2) as stated in the Introduction
Section.
Additional Discussion: Prospective Impact
One of the objectives of the Critical Path Initiative is
to accelerate the time-to-market of innovative, safe,
and effective medical products by changing the app-
roach to product development. Sponsors are encour-
aged to utilize innovative techniques to investigate the
manufacturability, safety, and efficacy of candidate
molecules, and/or drug products.
26
This objective can
Figure 6. Plots of the predicted mean probabilities for inefficacy (a and b) and toxicity
(c and d) adjusted for the effects of intra-batch content uniformity variability, patient
compliance, and dosing time standard deviation. Asterisks denote the upper and lower
values of the mean confidence intervals whereas the open circles represent the mid-point
of the intervals.
DOI 10.1002/jps
JOURNAL OF PHARMACEUTICAL SCIENCES, VOL. 99, NO. 12, DECEMBER 2010
A NEW DEFINITION OF PHARMACEUTICAL QUALITY
5057

certainly be expanded to include approaches that
examine the impact that changes, such as those ins-
tituted through comparability protocols,
27
have on
the manufacturability, safety, and efficacy of curre-
ntly marketed products. The multivariate risk
simulation platform used in this work provides the
opportunity to simultaneously study the effects of
manufacturing, compliance, and physiologic and pat-
hophysiologic states on the safety and efficacy of drug
delivery systems. This is true for new chemical
entities and previously marketed drugs alike.
The utility of the risk simulation platform has
largely been couched on harnessing explicit patient
and product knowledge to evaluate clinical perfor-
mance (i.e., quality) as it relates to pharmaceutical
production. Simulation has been shown to play an
important role in clinical trials.
28–31
A risk simulation
approach such as this one also has the potential to
contribute greatly in this area. Despite the fact that
conditional risk was investigated using the general
population, the risk simulation platform can also
delineate subpopulations that display disparate risk
levels (Fig. 5). This supports the selection of parti-
cipants for inclusion in clinical trials, with the
ultimate objective of reducing the likelihood of the
drug being toxic or ineffective. Although drugs that
are capable of being safely and effectively adminis-
tered to the general population are desirable, certain
patient factors often preclude individuals from taking
a given medication. These subpopulations must be
quickly identified so as to allow safe treatment. The
gamut of patient factors that interact to affect drug
action will not always be available initially; however,
data from drugs of the same class or defensible
estimates can be used as starting points. Subsequent
clinical trial data can then be integrated within the
simulation platform to better understand the condi-
tions that predispose patients to adverse clinical
outcomes. Once validated, these data can then be
used to carefully market the product.
The inter-relationship of the risk simulation com-
ponents was utilized none other than to generate risk
scores. These links are illustrated by the solid arrows
in Figure 1. The risk scores, however, can be harne-
ssed to oversee and/or optimize certain components
(dotted arrows). For example, the dosing guidelines
(whether for the general population or select sub-
populations) can be adjusted to minimize the risk of
adverse events. Furthermore, feedforward and feed-
back manufacturing controls can be instituted (via
process and control models) to control PCCPs such
that the desired level of clinical performance is
attainted. Similarly, raw material variability can be
integrated such that the process can be adjusted to
compensate for risk imparted by incoming constitu-
ents. Future work will use the risk simulation
platform to generate a design space for the model
solid oral dosage system that is bounded by risk
scores. Once the design space has been created,
control models can be developed to ensure that
production is maintained at a level of acceptable risk.
CONCLUSIONS
A risk simulation platform that integrated population
statistics, drug delivery system characteristics, dos-
ing guidelines, patient compliance estimates, produc-
tion metrics, and PK, PD, and IVIVC models to
investigate the impact of manufacturing variability
on clinical performance of a model theophylline solid
oral dosage system was developed. This work was
predicated on requests to re-define pharmaceutical
quality in terms of risk by linking production chara-
cteristics to clinical attributes. Manufacturing preci-
sion was characterized by inter- and intra-batch
content uniformity and dissolution variability metri-
cs, while clinical performance was described by a
probabilistic PD model that expressed the probability
of inefficacy and toxicity as a function of theophylline
plasma concentrations. At the levels assessed, both
patient compliance variables, percent of doses taken
and dosing time variability, significantly impacted
risk of inefficacy and toxicity. In addition to these
factors, intra-batch content uniformity variability
elicited a significant change in risk scores for the two
adverse events, and, therefore, was identified as a
CQA. This article demonstrates how pharmaceutical
quality can be recast to explicitly communicate risk as
it relates to clinical performance. Future research will
focus on constructing a design space that directly
links critical process parameters to quantitative
estimates of inefficacy and toxicity risk.
ACKNOWLEDGMENTS
The authors wish to gratefully acknowledge the sup-
port of this work by FDA under contract HHSF
223200910010I.
REFERENCES
1. Cogdill RP, Knight TP, Anderson CA, Drennen JK III. 2007.
The financial returns of investments in process analytical
technology and lean manufacturing: Benchmarks and case
study. J Pharm Innov 2:38–50.
2. 2004. Pharmaceutical CGMPs for the 21st Century—A risk-
based approach final report. Rockville: U.S. Department of
Health and Human Services, Food and Drug Administration.
3. Woodcock J. 2004. The concept of pharmaceutical quality.
Am Pharm Rev 7:10–15.
4. Cogdill RP, Drennen JK. 2008. Risk-based quality by design
(QbD): A Taguchi perspective on the assessment of product
quality, and the quantitative linkage of drug product para-
meters and clinical performance. J Pharm Innov 3:23–29.
JOURNAL OF PHARMACEUTICAL SCIENCES, VOL. 99, NO. 12, DECEMBER 2010
DOI 10.1002/jps
5058
SHORT ET AL.

5. Bonate PL. 2001. A brief introduction to Monte Carlo simula-
tion. Clin Pharmacokinet 40:15–22.
6. Ahmad AM, Boudinot FD, Barr WH, Reed RC, Garnett WR.
2005. The use of Monte Carlo simulations to study the effect of
poor compliance on the steady state concentrations of Valproic
Acid following administration of enteric-coated and extended
release Divalproex Sodium formulations. Biopharm Drug Dis-
pos 26:417–425.
7. Short SM. 2009. Performance-based quality specifications: The
link between product development and clinical outcomes. PhD
Dissertation. Pharmaceutical Sciences, Pittsburgh: Duquesne
University. p 322.
8. Jusko WJ, Gardner MJ, Mangione A, Schentag JJ, Koup JR,
Vance JW. 1979. Factors affecting theophylline clearances:
Age, tobacco, marijuana, cirrhosis, congestive heart failure,
obesity, oral contraceptives, benzodiazepines, barbiturates,
and ethanol. J Pharm Sci 68:1358–1366.
9. Gilman TM, Muir KT, Jung RC, Walberg CB. 1985. Estimation
of theophylline clearance during intravenous aminophylline
infusions. J Pharm Sci 74:508–514.
10. Powell JR, Vozeh S, Hopewell P, Costello J, Sheiner LB, Riegel-
man S. 1978. Theophylline disposition in acutely ill hospitalized
patients. The effect of smoking, heart failure, severe airway
obstruction, and pneumonia. Am Rev Respir Dis 118:229–
238.
11. Voytilla RJ. 2007. Non-destructive prediction of drug release
from tablets using near-infrared spectroscopy. MS Thesis.
Graduate School of Pharmaceutical Sciences, Pittsburgh:
Duquesne University. p 212.
12. Umesh B. 1992. Pharmaceutical dissolution testing. New York:
Marcel Dekker. p 437.
13. Hussein Z, Friedman M. 1990. Release and absorption char-
acteristics of novel theophylline sustained-release formula-
tions: In vitro-in vivo correlation. Pharm Res 7:1167–
1171.
14. Yamazaki M, Fukutomi O, Kondo N, Kato Z, Nakashima Y,
Shinoda S, Agata H, Kondo T, Imaeda N, Orii T. 1994. The
design of oral sustained-release theophylline dosing after con-
version from intravenous to oral therapy. Int J Clin Pharmacol
Ther 32:625–631.
15. Weinberger MM. 1984. Theophylline QID, TID, BID and now
QD? A report on 24-hour dosing with slow-release theophylline
formulations with emphasis on analyses of data used to obtain
Food and Drug Administration approval for Theo-24. Pharma-
cotherapy 4:181–198.
16. Sabnis S, Adeyeye CM. 1998. Controlled-release hydrophilic
tablets for individualized theophylline therapy. Drug Dev Ind
Pharm 25:187–196.
17. Ohnishi A, Kato M, Kojima J, Ushiama H, Yoneko M, Kawai H.
2003. Differential pharmacokinetics of theophylline in elderly
patients. Drugs Aging 20:71–84.
18. Mitenko PA, Ogilvie RI. 1973. Rational intravenous doses of
theophylline. N Engl J Med 289:600–603.
19. Weinberger M, Hendeles L, Bighley L. 1978. The relation of
product formulation to absorption of oral Theophylline. N Engl
J Med 299:852–857.
20. Takayama K, Morva A, Fujikawa M, Hattori Y, Obata Y, Nagai
T. 2000. Formula optimization of theophylline controlled-
release tablet based on artificial neural networks. J Control
Release 68:175–186.
21. Chiou WL, Gadalla MAF, Peng GW. 1978. Method for the
rapid estimation of the total body drug clearance and
adjustment of dosage regimens in patients during a con-
stant-rate intravenous infusion. J Pharmacokinet Bio-
pharm 6:135–151.
22. Shargel L, Yu ABC. 1999. Applied biopharmaceutics and phar-
macokinetics, 4th edition. Stamford: Appleton & Lange. p 768.
23. Buchwald P. 2003. Direct, differential-equation-based in-vitro-
in-vivo correlation (IVIVC) method. J Pharm Pharmacol
55:495–504.
24. DiPiro JT, Spruill WJ, Blouin RA, Pruemer JM. 2002. Concepts
in clinical pharmacokinetics, 3rd edition. Bethesda: American
Society of Health-System Pharmacists, Inc. p 279.
25. 2008. Pharmaceutical Development Q8(R1). ICH Harmonised
Tripartite Guideline.
26. 2004. Innovation/stagnation: Challenge and opportunity on the
critical path to new medical products. Rockville: U.S. Depart-
ment of Health and Human Services, Food and Drug Admin-
istration.
27. 2003. Comparability protocols— Protein drug products and
biological products — Chemistry, manufacturing, and con-
trols information DRAFT GUIDANCE. Rockville: U.S.
Department of Health and Human Services, Food and Drug
Administration,
Center
for
Biologics
Evaluation
and
Research, Center for Drug Evaluation and Research, Center
for Veterinary Medicine.
28. Bonate PL. 2000. Clinical trial simulation in drug development.
Pharm Res 17:252–256.
29. Grass GM, Sinko PJ. 2002. Physiologically-based pharmacoki-
netic simulation modelling. Adv Drug Deliv Rev 54:433–451.
30. Holford NHG, Kimko HC, Monteleone JPR, Peck CC. 2000.
Simulation of clinical trials. Annu Rev Pharmacol Toxicol
40:209–234.
31. Poland B, Wada R. 2001. Combining drug-disease and economic
modelling to inform drug development decisions. Drug Discov
Today 6:1165–1170.
DOI 10.1002/jps
JOURNAL OF PHARMACEUTICAL SCIENCES, VOL. 99, NO. 12, DECEMBER 2010
A NEW DEFINITION OF PHARMACEUTICAL QUALITY
5059
Wyszukiwarka
Podobne podstrony:
jps 21681
jps 21579
jps 22023
jps 22081
jps 22139
Viofor JPS jest aparatem do magnetostymulacji, FIZJOTERAPIA
jps 21484
jps 21792
jps 21755
jps 22267
jps, kryminologia
jps 22075
jps 21904
jps 21667
jps 21681
jps 21828
jps 21704
jps 22346
jps 21947
więcej podobnych podstron