
Ministry of Higher Education
& Oman Accreditation Council
Training Module 08
v2
Process Mapping
Using Flowcharting/Blueprinting
Workshop Handout
© Martin Carroll
Last updated: 25 September 2006

© Ministry of Higher Education and Oman Accreditation Council
Training Module 08v2 Process Mapping
Last updated 26 September 2006
Page 2 of 9
Training Module Version Control Table
Version
Author
Date
Summary of Main Changes
1
M Carroll
25-09-2006
• New Training Module Handout.
• Scope of ADRI coverage extended to include Improvement
• Corrections to Flowcharts in slides 10-13
• Addition to slide 22.
•
•
•
•
TABLE OF CONTENTS
1
Module Aims ........................................................................................................3
1.1
Intended Participants .....................................................................................3
1.2
Learning Outcomes........................................................................................3
2
Module Slides.......................................................................................................3
2.1
Summary of the Presentation.........................................................................3
2.2
Workshop Activity...........................................................................................8
3
Additional Materials.............................................................................................8
3.1
Further Resources on Process Mapping........................................................9
3.2
Discussion Board Details ...............................................................................9
This Training Module is part of the Training Program open to staff of public and
private higher education institutions, the Oman Accreditation Council, the Ministry of
Higher Education and the Ministry of Manpower. The Training Program is a joint
initiative of the Directorate General, Private Universities and Colleges and the Oman
Accreditation Council. It aims to raise the capacity and capability of the higher
education sector in issues and practices related to assuring and improving quality.

© Ministry of Higher Education and Oman Accreditation Council
Training Module 08v2 Process Mapping
Last updated 26 September 2006
Page 3 of 9
1
MODULE AIMS
1.1 Intended Participants
This Training Module is for anyone in higher education involved in designing
processes, preparing manuals or reviewing processes. Specifically, this is
likely to include:
• Managers of higher education providers;
• Directors in Government higher education.
1.2 Learning Outcomes
Documents are an essential tool in higher education and higher education
management. By the end of this module, participants should:
• Understand the concepts, tools and techniques of process mapping.
• Map out a process using flowcharts.
• Use flowcharting to operationally analyse a process.
• Strategically analyse the flowcharted processes according to
stakeholder perspectives, using the ‘blueprinting’ technique.
2
MODULE SLIDES
2.1 Summary of the Presentation
Note that a version designed for use in presentations is available online and
free of charge (
www.oac.gov.om/enhancement/training
). It contains slides that
are not included in this printed version (such as model answers to the
workshop questions).
A
PP
R
O
A
C
H
R
ES
U
LT
S
D
EP
LO
YM
EN
T
IM
PR
O
VE
M
EN
T
Process Mapping and ADRI
Process Mapping and ADRI
Why is Process Mapping Important?
• Gives us a total and transparent view of the
process.
• Provides a clear and logical way of thinking
about our process.
• Provides a way of communicating our process
to others.
• Highlights potential ‘fail’ and ‘delay’ points.
• Highlights precisely how stakeholders are
operationally involved.
• Identifies how we can strategically seek
feedback for process improvement purposes.
Slide 1
Slide 2
© Ministry of Higher Education and Oman Accreditation Council
Training Module 08v2 Process Mapping
Last updated 26 September 2006
Page 4 of 9
Why is Process Mapping Important?
• Gives us a total and transparent view of the
process.
• Provides a clear and logical way of thinking
about our process.
• Provides a way of communicating our process
to others.
• Highlights potential ‘fail’ and ‘delay’ points.
• Highlights precisely how stakeholders are
operationally involved.
• Identifies how we can strategically seek
feedback for process improvement purposes.
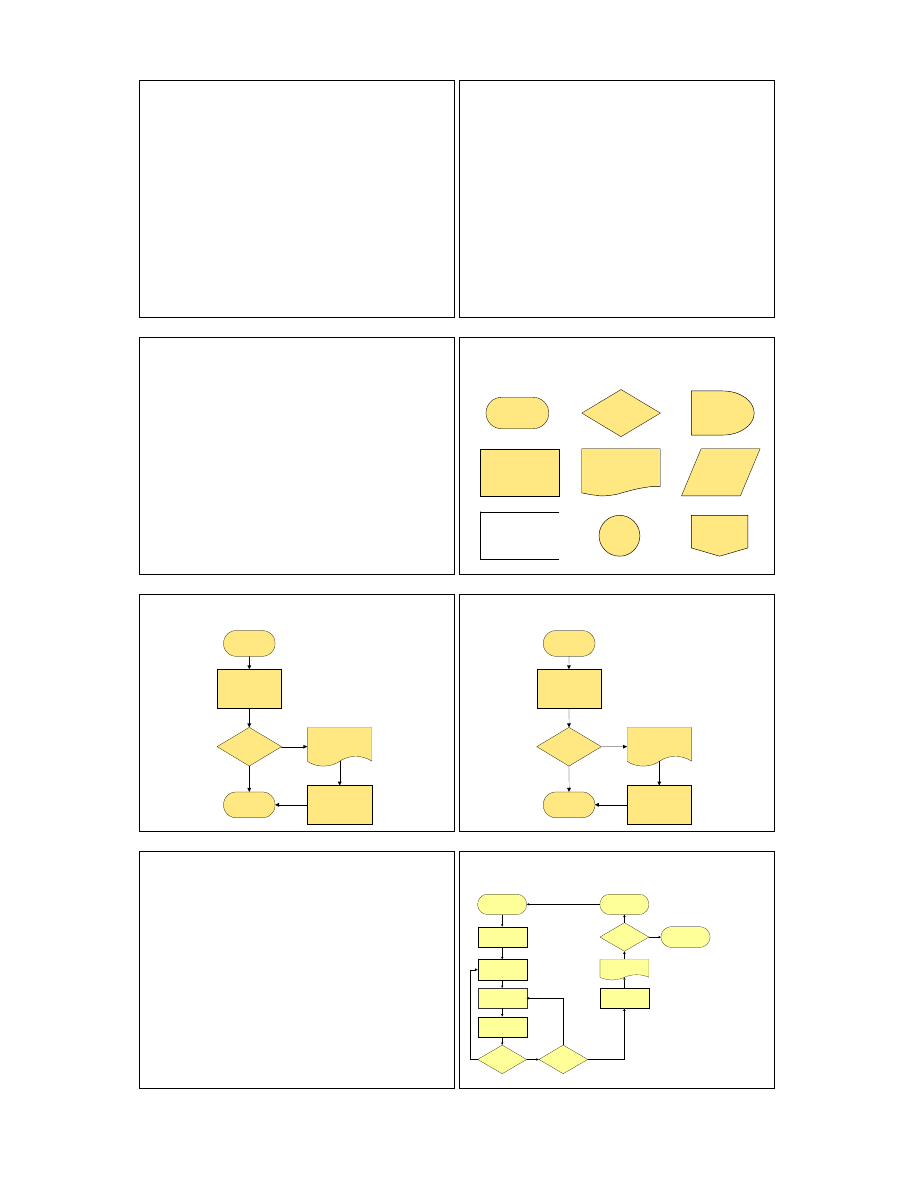
Flowcharting
• A graphical approach to mapping a process.
• Identifies distinct elements in the process.
• Classifies these elements into processes,
decisions, delays, data etc...
• Orders the elements sequentially.
Slide 3
Slide 4
Flowc
harting
Symbols
• Each element is represented by a symbol.
• There are different standards for flowchart
symbols. Main one is ISO 5807:1985.
• There are many, many different symbols (and
many different types of flowcharts).
• The core symbols tend to be constant.
• But there are really no strict rules.
• Symbols can be tailored for your own use.
Common Flowchart Symbols
Decision
Data
Start/End
Document
Delay
Link
(on page)
Link
(Off-page)
Process
Comment
Slide 5
Slide 6
Basic Flowchart Example
Decision
Action
Document
Yes
End
No
Action
Start
Basic Flowchart Example
2. Do
you have
mail?
1. Go to
Post Office
3. Letters
Yes
End
mail check
No
4. Read mail
Start
mail check
Numbering the steps is
helpful in case you want
to annotate the flowchart,
thereby providing more
information.
Slide 7
Slide 8
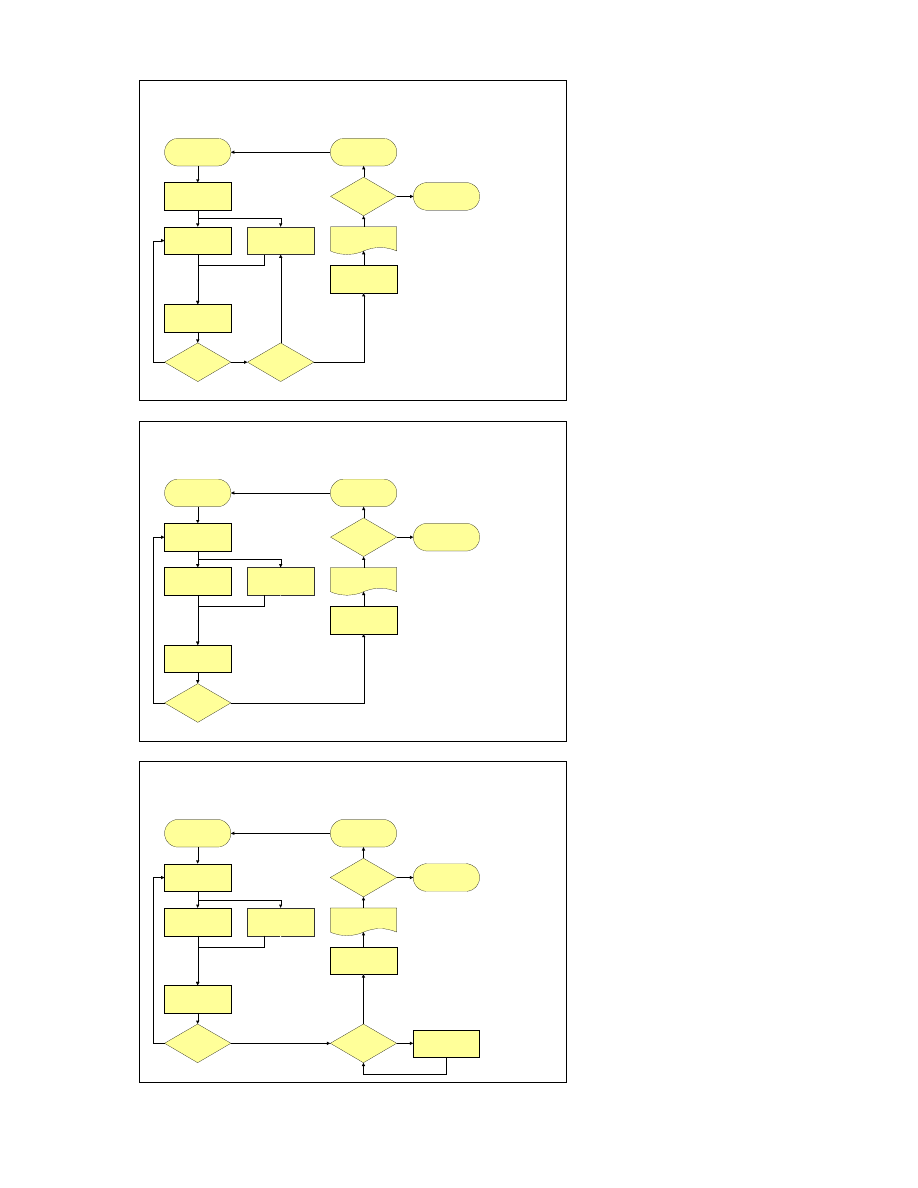
Improving Processes via Flowcharts
• Flowcharts can help identify unhelpful
waiting times.
• And process redundancy.
• And can help us decide precisely how to
plan for effective quality control.
Improving Processes via Flowcharts
2. Draft text for
the brochure
4. Seek approvals
Start Media
Article Project
Well Done!
End Media
Article Project
5. Text
permission
granted?
9. Brochure
acceptable?
8. Brochure
7. Get brochure
published
6. Get
brochure
edited
End Media
Article Project
1. Plan the
brochure
7. Make
improvements
3. Source
and format
photographs
No
Yes
Bad luck! Try again.
No
Yes
OK
Errors
6. Photo
permission
granted?
Yes
No
No
How could this
process be
improved?
Slide 9
Slide 10
© Ministry of Higher Education and Oman Accreditation Council
Training Module 08v2 Process Mapping
Last updated 26 September 2006
Page 5 of 9
Improving Processes via Flowcharts
2. Draft text for
the brochure
4. Seek approvals
Start Media
Article Project
Well Done!
End Media
Article Project
5. Text
permission
granted?
9. Brochure
acceptable?
8. Brochure
7. Get brochure
published
6. Get
brochure
edited
End Media
Article Project
1. Plan the
brochure
7. Make
improvements
3. Source
and format
photographs
No
Yes
Bad luck! Try again.
No
Yes
OK
Errors
6. Photo
permission
granted?
Yes
No
No
Speed could be
improved by
doing some steps
in parallel.
Slide 11
Improving Processes via Flowcharts
2. Draft text for
the brochure
4. Seek single
approval
Start Media
Article Project
Well Done!
End Media
Article Project
5. Permission
granted?
8. Brochure
acceptable?
7. Brochure
6. Get brochure
published
6. Get
brochure
edited
End Media
Article Project
1. Plan the
brochure
7. Make
improvements
3. Source
and format
photographs
No
Yes
Bad luck! Try again.
No
Yes
OK
Errors
6. Photo
permission
granted?
Yes
No
No
Duplicated steps
could be removed
or merged.
Slide 12
Improving Processes via Flowcharts
2. Draft text for
the brochure
4. Seek single
approval
Start Media
Article Project
Well Done!
End Media
Article Project
5. Permission
granted?
10. Brochure
acceptable?
9. Brochure
8. Get brochure
published
6. Get
brochure
edited
End Media
Article Project
1. Plan the
brochure
7. Make
improvements
3. Source
and format
photographs
No
Yes
Bad luck! Try again.
No
Yes
OK
Errors
6. Photo
permission
granted?
Yes
No
No
Introducing
appropriate quality
control could help
improve the final
result.
Slide 13
© Ministry of Higher Education and Oman Accreditation Council
Training Module 08v2 Process Mapping
Last updated 26 September 2006
Page 6 of 9
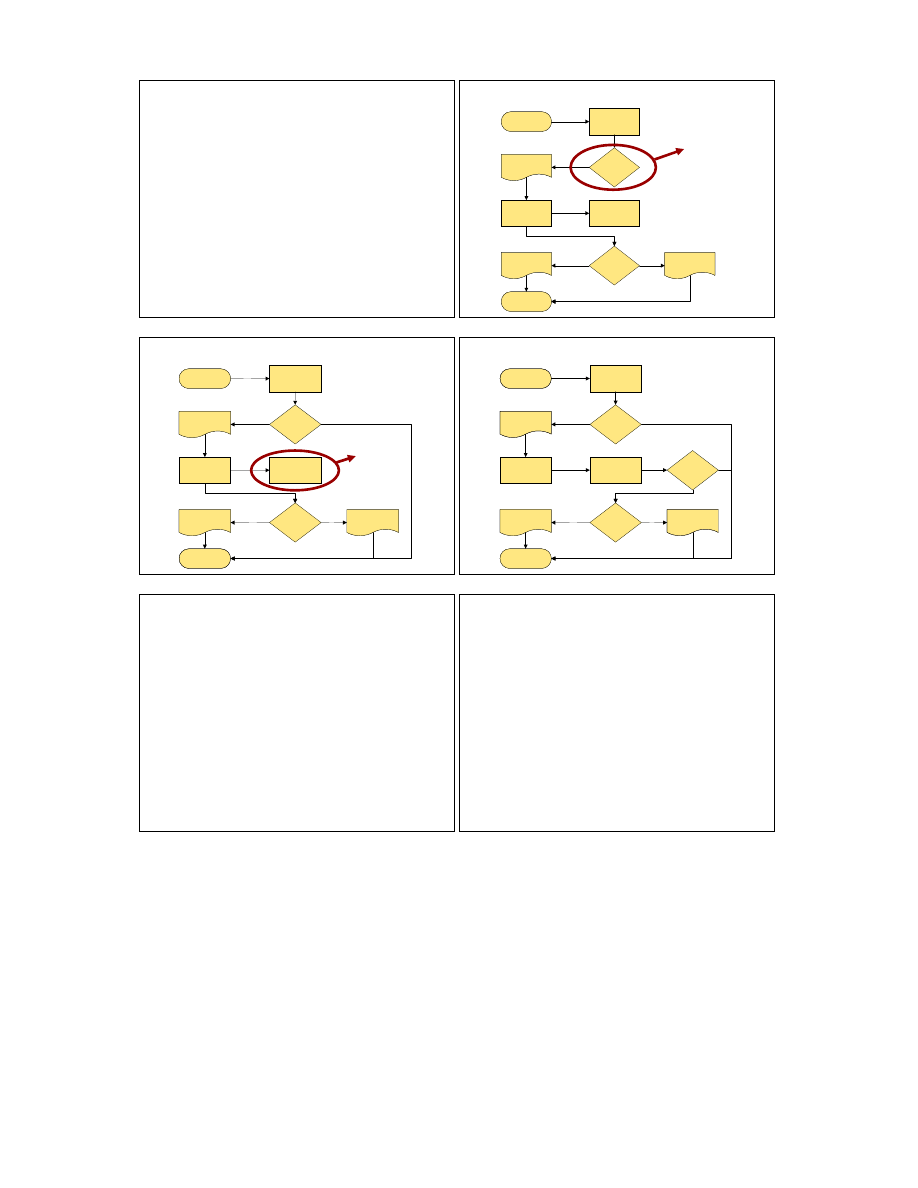
Orphans
• The steps in a process should link together.
• No process should have a line in with no
line out (or vice versa).
• Test question for processes: “then what?”
• No decision should have only a single out
option.
• Test question for decisions: “or what?”
• Can you find two orphans in the following
example?
Examples of Orphans
Start Job Offer
Committee
considers
applications
Conduct
interviews
Applicant
successful?
Conduct
referee checks
Applicant
shortlisted?
Job Offer
Letter
End Job Offer
Job Rejection
Letter
Interview Offer
Letter
Yes
Yes
No
Or what?
Slide 14
Slide 15
Examples of Orphans
Start Job Offer
Committee
considers
applications
Conduct
interviews
Applicant
successful?
Conduct
referee checks
Applicant
shortlisted?
Job Offer
Letter
End Job Offer
Job Rejection
Letter
Interview Offer
Letter
Yes
Yes
No
No
Then
what?
Examples of Orphans
Start Job Offer
Committee
considers
applications
Conduct
interviews
Applicant
successful?
Conduct
referee checks
Applicant
shortlisted?
Job Offer
Letter
End Job Offer
Job Rejection
Letter
Interview Offer
Letter
Ref
check
OK?
Yes
Yes
Yes
No
No
No
Slide 16
Slide 17
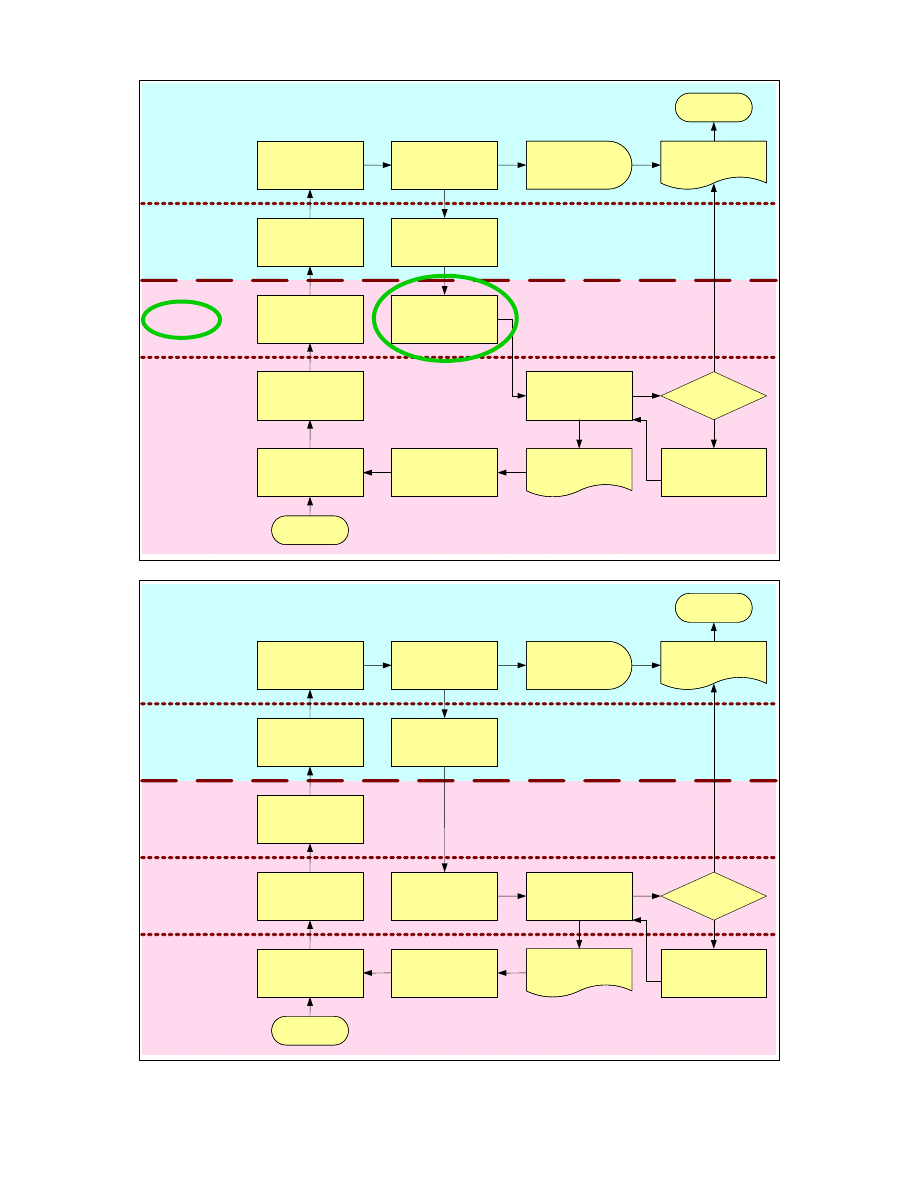
Blueprinting
• We use stakeholder feedback to help improve
our processes.
• But we have many different groups of
stakeholders, and most stakeholder groups only
see certain parts of the process.
• But wrong or ill-informed advice can be worse
than no advice.
• So let’s structure our process maps to identify
stakeholder ‘zones of visibility’, and use those
zones to priorities/target our QA efforts.
Blueprinting
• The ‘line of visibility’ distinguishes between
those parts of the process that the client does
and does not witness.
• ‘Lines of interaction’ distinguish between those
parts of the process that various stakeholders do
and do not have responsibility for, even though
they may witness them.
Slide 18
Slide 19
© Ministry of Higher Education and Oman Accreditation Council
Training Module 08v2 Process Mapping
Last updated 26 September 2006
Page 7 of 9
HEP
STUDENTS
Line of Visibility
Front line of interaction
Invigilators
Invigilators
Teachers
Back line of interaction
Start Exam
Process
Dean appoints
teacher and
allocates resources
Students submit
papers and leave
Teacher prepares
exam paper
Invigilators
monitor conduct
Exam is marked
End Exam
Process
Results considered
by Exams
Committee
Students sit exam
Students wait
for results
Invigilators collect
papers and
return to Dept.
Results
approved?
Invigilators
prepare room
Appropriate
corrective action
taken
Course Reviewed
Yes
No
Exams Committee
Report (once results
are confirmed)
Students’ results
issued
Slide 20
HEP
STUDENTS
Line of Visibility
Front line of interaction
Back line of interaction
Invigilators
Invigilators
Management
Teachers
Back line of interaction
Start Exam
Process
Dean appoints
teacher and
allocates resources
Students submit
papers and leave
Teacher prepares
exam paper
Invigilators
monitor conduct
Exam is marked
End Exam
Process
Results considered
by Exams
Committee
Students sit exam
Students wait
for results
Invigilators collect
papers and
return to Dept.
Results
approved?
Invigilators
prepare room
Appropriate
corrective action
taken
Course Reviewed
Yes
No
Exams Committee
Report (once results
are confirmed)
Students’ results
issued
Slide 21
© Ministry of Higher Education and Oman Accreditation Council
Training Module 08v2 Process Mapping
Last updated 26 September 2006
Page 8 of 9
How much detail?
• Macro process maps useful for strategising, but
not helpful for process improvement.
• For process analysis and improvement
purposes, more detailed flowcharts are better.
• Stay focused on the process client.
• Even as you get more detailed, keep the
overall process objective in mind.
• You can insert additional detail in the symbols
(e.g. names; time frames) or in supplementary
notes, using the numbers on the symbols.
Process Mapping
A tool for quality improvement
Thank you and congratulations on
completing this training module!
Slide 22
Slide 23
2.2 Workshop Activity
The following slide outlines the workshop activity. For further information on
the workshop, see the online PowerPoint presentation for this Training Module
(
http://www.oac.gov.om/enhancement/training/08/
).
1. Form into groups. Consider the steps involved in
your Group’s process; identify the stakeholders.
2. Map those steps into a flow chart (using the OHP
transparencies). Include the front line of interaction.
3. One person will report back to the full workshop.
4. There are 30 minutes for this activity and 20 minutes
for the feedback session
5. There are model answers attached here. These are
examples and not the only right answers.
Workshop Activity
Instructions
Group 1
Curriculum
Review
Group 2
Performance
Appraisal
Group 3
Organising
Meetings
Group 4
IT Helpdesk
3
ADDITIONAL MATERIALS
These additional references are supplied for general educative purposes only.
Their inclusion here does not imply any endorsement or warranty by the
authors of this training module.

© Ministry of Higher Education and Oman Accreditation Council
Training Module 08v2 Process Mapping
Last updated 26 September 2006
Page 9 of 9
Note that web references provided below may not remain active for long! If
you want to check them out, it is better to do so quickly!
If you intend to search flowcharting on the web, note that spelling varies
between ‘flow chart’ and ‘flowchart’.
3.1 Further Resources on Process Mapping
• Wikipedia, a community-authored online encyclopedia, is often a useful
course of information on topics. They have a concise overview of the
theoretical history behind Flowcharting, known as Unified Modeling
Language:
http://en.wikipedia.org/wiki/Unified_Modelling_Language
.
• American National Standards Institute (ANSI) x3.5:1970 provides another
standard for flowcharting. This was withdrawn by the Federal Information
Processing Standards Publications in 1988, owing the standards not
having kept up with industry practice. But ANSI x3.5 is still widely cited
today by software retailers and consultants.
• iSixSigma
provides
extensive
and
detailed
online
resources:
http://www.isixsigma.com/tt/process_mapping/
.
• Most standard software applications have a basic flowcharting component
built into them (such as MS PowerPoint, and MS Word). However, if you
want to do higher quality flowcharting there are several specialized
software applications, such as Microsoft Visio, ABC, EDraw and
SmartDraw. Microsoft Visio is perhaps the most common and comes as
part of the Microsoft Office Pro suite.
• There is an online tutorial for flowcharting which, for now, is free of charge
at
http://home.att.net/~dexter.a.hansen/flowchart/flowchart.htm
.
• SmartDraw has a tutorial also, which can be found at the following website:
http://www.smartdraw.com/tutorials/flowcharts/whatis.htm
.
• For more on Blueprinting, see George, W.R., Gibson, B.E. (1991),
"Blueprinting: a tool for managing quality in services", in Brown, S.W.,
Gummesson, E., Edvardsson, B., Gustavsson, B. (Eds),Service Quality:
Multidisciplinary and Multinational Perspectives, Lexington Books,
Lexington, MA, pp.73-91.
3.2 Discussion Board Details
The online discussion board for this Training Module is not yet operational.
Wyszukiwarka
Podobne podstrony:
Mapping Evenki land, safonova, santha
RT6?tivation mapping
Exposure Data mapping in Raung Volcano, umk, notatki, zadania
clock flowchart
7 Step Project Mapping With Mind Manager Whitepaper
ADHD Diagnostic Flowchart
Productivity 101 Mapping Your Mind
Mind mapping
41 Użycie Displacement Mapping z Properties Surface
Mind Mapping
1 3 1 3 Lab Mapping the Internet
Mapping Evenki land, safonova, santha
Mind Mapping
Traktor Mapping Prep 02
Mapping of temperature distribution in pharmaceutical microwave vacuum drying
Zdrowie Kaczmarek Mapping
mind mapping projekt
CONCEPTUALIZING AND MAPPING GEOCULTURAL SPACE
więcej podobnych podstron