
155
FAR INFRARED SPECTROSCOPY OF STAR-FORMING GALAXIES: EXPECTATIONS FOR
THE HERSCHEL SPACE OBSERVATORY
Sangeeta Malhotra
The Johns Hopkins University
Abstract
ISO has enabled far-infrared spectroscopy of a vari-
ety of galaxies. Using the [CII] (158
µm) and [OI](63µm)
lines, we can characterize the physical conditions in the
star-forming ISM. These observations also form the basis
of our expectations for what the Herschel Space Obser-
vatory will observe for high redshift galaxies. While [CII]
is suppressed in ULIRGs and normal galaxies with high
dust temperatures, it is stronger than expected in metal
poor galaxies by factors of a few. Young galaxies at high
redshifts might be expected to be both metal poor and
actively star-forming, leading to contrary expectations for
the [CII] line strength. The best prediction for [CII] de-
tection is derived by using the observed proportionality
between [CII] and mid-IR emission from PAHs. Using the
observed [CII]/7
µm ratio and number counts from ISO
deep surveys we predict that HSO will be able to detect
100 sources/square-degree in the [CII] line.
Key words: Galaxies: formation – Stars: formation – Mis-
sions: FIRST
1. Introduction
Herschel Space Observatory (HSO) will have the wave-
length coverage and sensitivity to detect high redshift galax-
ies at the peak of their dust continuum emission. The three
instruments onboard HSO will also carry out spectroscopy
in the far-infrared and sub-millimeter. From the FIR lines
of
C
+
and O, we can derive physical conditions in the
star-forming ISM at these redshifts. From optical obser-
vations it seems that star-formation peaks at z=1-2 (e.g.
Madau et al. 1996). It would be interesting to investigate
the properties of the ISM in star-forming galaxies at these
redshifts, and thus learn the causes and consequences of
higher star-formation.
In this paper I use ISO observations of the fine struc-
ture lines in nearby galaxies to (a) summarize what we
have learned about the ISM of galaxies from ISO and (b)
do feasibility calculations about what HSO will see at high
redshifts.
2. The [CII] (
158
µm) line
[CII] (158
µm) line is the dominant coolant of the neutral
ISM in all but the hottest galaxies. For most of the ob-
served galaxies 0.1-1% of the FIR continuum emerges in
this single line. Not coincidentally, it is the best studied
line in this wavelength regime. It has been observed for
normal galaxies (Stacey et al. 1991, Malhotra et al. 1997,
1999, 2001, Leech et al. 1999, Pierini et al. 1999), irregu-
lar/dwarfs (Smith et al. 1997, Bergvall et al. 2000, Hunter
et al. 2001, Madden et al. 2001), Ellipticals (Malhotra et
al. 2000, Unger et al. 2000) and luminous and ultralumi-
nous infra-red galaxies (Luhman et al. 1998, Fischer et al.
2001). So now we have a low redshift “basis set” of various
types of galaxies to draw upon.
The deficiency in [CII]/FIR in ULIRGs and normal
galaxies (Malhotra et al. 1997, Luhman et al. 1998) came
as a surprise to many. The decrease in [CII]/FIR correlates
best with the IRAS colors of galaxies F
ν
(60
µm)/F
ν
(100
µm)
(Figure 1; Malhotra et al. 2001). It also correlates, but less
strongly, with other quantities like FIR/Blue colors and
Infrared luminosity. Since F
ν
(60
µm)/F
ν
(100
µm), FIR/Blue
and FIR luminosity correlate with each other, we cannot
say which correlation with [CII]/FIR is primary and which
ones are secondary. Luminous and ultraluminous galaxies
from the sample of Luhman et al. 1998follow the same
trends. Two high redshift quasars BRI 1202-0752 (z=4.69)
and BRI 1335-0415 (z=4.41) have measured upper limits
on the [CII] flux and also follow the same trendd (Benford
1999).
3. Irregular galaxies
While FIR colors F
ν
(60
µm)/F
ν
(100
µm) show the strongest
correlation with L
[CII]
/L
FIR
, there seems to be a second
parameter, which is apparent from Figure 1. Irregular
galaxies have a higher L
[CII]
/L
FIR
and Ellipticals have
lower L
[CII]
/L
FIR
ratio. It is not yet clear whether this
has to do with the lower metallicity affecting the chem-
istry of the ISM directly or because low metallicity stellar
populations produce a harder radiation field. Hunter et al.
2001 and Madden et al. 2001 discuss in detail how both
L
[CII]
/L
FIR
and [CII]/MIR emission is higher for irregular
galaxies.
Even more dramatic is the fact that [OIII] (88
µm) line
from HII regions is very bright in 2 of our irregular galax-
Proc. Symposium ‘The Promise of the Herschel Space Observatory’ 12–15 December 2000, Toledo, Spain
ESA SP-460, July 2001, eds. G.L. Pilbratt, J. Cernicharo, A.M. Heras, T. Prusti, & R. Harris
156
Sangeeta Malhotra
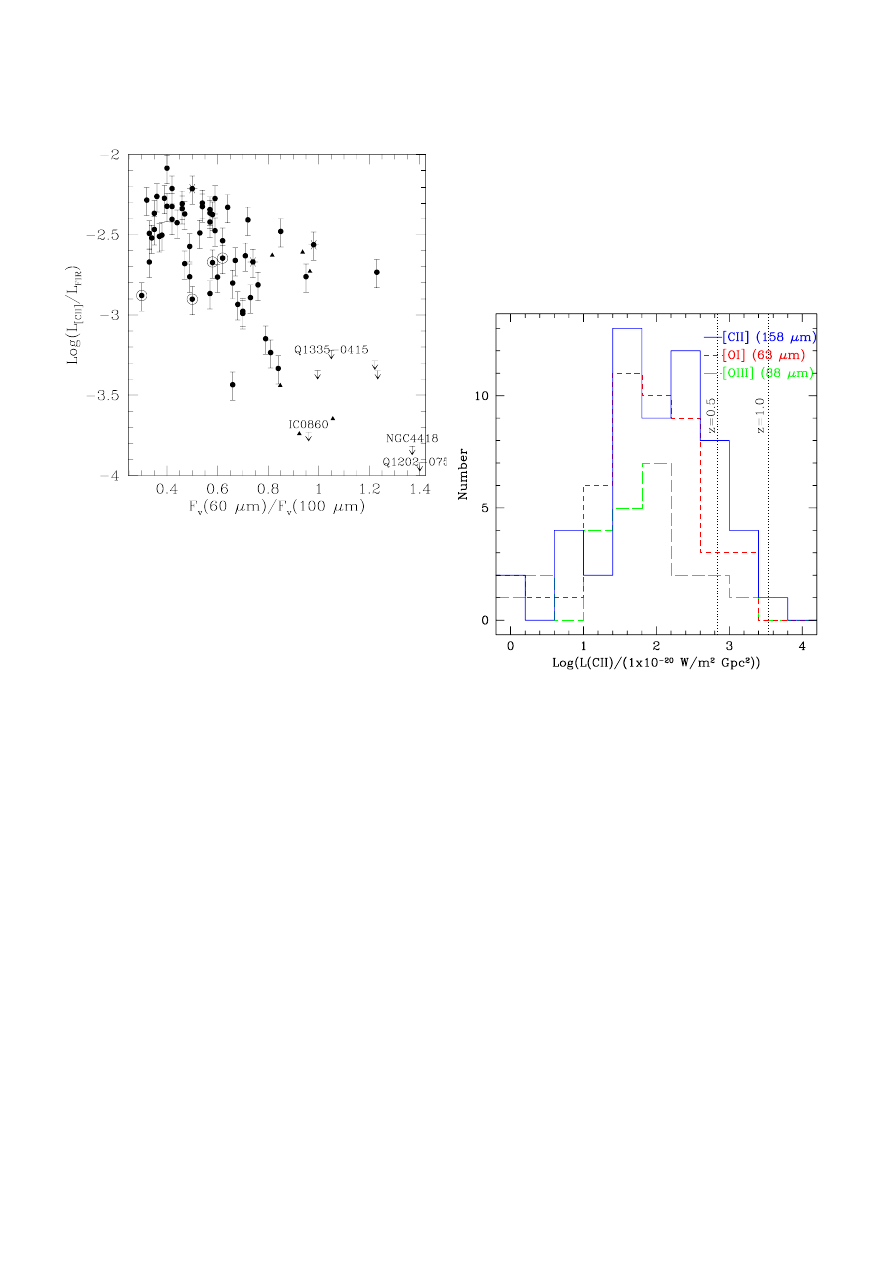
Figure 1.
The ratio of [CII] to far-infrared continuum,
L
[CII]
/L
FIR
, is plotted against the ratio of flux in the IRAS
60
µm and 100µm bands, F
ν
(60
µm)/F
ν
(100
µm). Filled circles
are normal galaxies from the ISO-Key Project sample. Irregu-
lar galaxies are denoted with the star sign and ellipticals with
bulls eye symbols. Triangles are luminous and ultraluminous
galaxies from the sample of Luhman et al. (1998). There is a
trend for galaxies with higher F
ν
(60
µm)/F
ν
(100
µm) (indicat-
ing warmer dust) to have lower L
[CII]
/L
FIR
, for normal as well
as ULIRGs. Two normal galaxies in a sample of 60 have no
detected [CII], and they are identified with labels and shown
as upper limit symbols; other upper limits come from Luh-
man et al. (1998). Rank correlation tests show that L
[CII]
/L
FIR
and F
ν
(60
µm)/F
ν
(100
µm) are correlated at the 4.4σ level.
L
[CII]
/L
FIR
upper limits for two high redshift sources also follow
this trend (Benford 1999).
ies. In IC 4662 and NGC 1569 [OIII]/FIR is fully 1% (Mal-
hotra et al. 2001). This is promising for detection of [OIII]
at high redshifts, but it also means that we cannot reliably
assume that that the brightest (and sometimes the only)
line detected is [CII].
NGC 1569 and IC 4662 are dwarf galaxies and hence
not very luminous. We would not be able to see thier coun-
terparts at z=1 or even z=0.5. The [OIII] (88
µm) line from
the metal poor irregular Haro 11 (Bergvall et al. 2000)
would be observable at z=1, even as the [CII] line falls
short.
4. FIR spectroscopy at high redshifts
In figure 2 we compare the luminosity distribution of three
prominent FIR lines in the ISO key-project sample. These
lines are [CII] (158
µm), [OI] (63 µm) and [OIII] (88 µm).
This is not a luminosity function, since our sample is not
volume limited, but serves to compare the luminosity dis-
tribution among the three brightest lines. We see that in
spite of the [CII] deficiency which cuts off the high lu-
minosity tail of the distribution, [CII] is clearly the more
luminous of these three lines, and therefore offers the best
prospects for being widely detected.
Figure 2. The luminosity distribution of the three prominent
FIR lines [CII] (158
µm), [OI] (63 µm) and [OIII] (88 µm).
The sample here is the ISO Key-Project on normal galaxies.
Since this sample was designed to span the possible galaxy prop-
erties rather than be a representative or a volume limited sam-
ple, this figure does not show the luminosity function in any of
the lines. However it is instructive to see the relative luminos-
ity distribution in the lines and to note that [CII] is still the
most luminous and likely to be detected at redshifts 0.5-1. The
x-axis shows the log of the fluxes (in units of 1
× 10
−20
W/m
2
)
of these galaxies if they were at a distance of 1 Gpc
The [CII] deficiency in the most active and luminous
galaxies flattens the luminosity function of the line rela-
tive to continuum. Since the most luminous objects (e.g.
ULIRGs) are deficient in [CII] the prospects for detect-
ing them at redshifts
≈ 4 and higher are dim. Observa-
tions of known high redshift objects with JCMT and CSO
have only yielded upper limits (van der Werf et al. 1998,
Benford 1999). These upper limits are consistent with the
trend seen between L
[CII]
/L
FIR
and F
ν
(60
µm)/F
ν
(100
µm)
(Figure 1). It seems that the correlation between
L
[CII]
/L
FIR
and F
ν
(60
µm)/F
ν
(100
µm) is stronger than
between L
[CII]
/L
FIR
and luminosity (Malhotra et al. 2001).
In principle, a cool but luminous source would be de-

Far Infrared Spectroscopy of Star-Forming Galaxies: Expectations for the Herschel Space Observatory
157
tectable at high redshifts. In practice, however, luminous
sources also tend to have warm FIR colors. The [CII] de-
ficiency in high redshift galaxies may be somewhat mit-
igated if starburst galaxies are metal poor, since metal
poor galaxies have [CII]/FIR higher by a factor of a few.
But this effect is not expected to be large.
4.1. Source density of high-z [CII] targets
While the [CII]/FIR behaviour is complicated and corre-
lates best with F
ν
(60
µm)/F
ν
(100
µm), we can exploit the
[CII]/MIR constancy to predict the number of galaxies
that are observable with Herschel Space Observatory.
Helou et al. 2001 point out that the ratio of [CII] flux
and the flux in the mid-infrared band at 7
µm remains
constant with FIR colors and shows a smaller scatter than
does L
[CII]
/L
FIR
. The physical interpretation of the cor-
relation between [CII] and 7
µm flux is simple. The mid-
infrared flux in the 6.75 band of ISO-CAM is dominated by
emission from Polycyclic Aromatic Hydrocarbons (PAHs).
We interpret the stable [CII]/F
7µm
ratio as evidence that
gas heating is dominated by the PAHs or small grains
which are also AFE carriers.
Another interpretation of the constancy of [CII]/F
7µm
is that PAHs/very small grains and
C
+
are co-extensive in
PDR regions. The decrease in both [CII]/FIR (Malhotra
et al. 1997, 2001) and F
7µm
/FIR with F60/F100 (Helou et
al. 2001, Lu et al. 2001) are then due to a smaller fraction
of FIR arising from the PDR phase.
Regardless of the right explanation/interpretation of
the proportionality between [CII] and PAH emission, we
can use it to predict what the Herschel Space Observatory
will be able to observe.
From the ISO key-project sample we derive
[
CII] = (F
7µm
/1mJy) × 10
−17.2
W/m
2
A sensitivity of 6
×10
−18
W/m
2
(HIFI) in the [CII] line
then translates to rest-frame 7 micron flux of 1 mJy. Deep
observations with ISOCAM (Elbaz et al. 1999) show that
the surface density of sources with 15
µm fluxes ≥ 1mJy
is roughly 100 per square-degree.
There are two caveats we need to keep in mind when
using the deep counts in the mid-IR to predict the num-
ber of galaxies which will have detectable [CII] flux. The
first is that the flux in the mid-infrared is dominated by
spectral features due to aromatic molecules, which means
that as we get to higher redshifts K-corrections for fluxes
measured in any broad-band filter are substantial and not
always of the same sign (Xu et al. 1998). The other con-
cern has to do with metal poor galaxies. They show a
deficiency in PAH features in the mid-IR (Thuan et al.
1999), but also show higher [CII]/MIR and [CII]/FIR by
factors of 2-3. In these galaxies presumably most of the
heating is due to the very small grain component of dust,
Figure 3. The ratio of [CII] flux and 7
µm flux is un-
varying with FIR colors and shows a smaller scatter than
L
[CII]
/L
FIR
(
σ([CII]/F
7µm
) = 0
.22. The [CII] flux is in units
of 10
−14
W/m
2
and the 7
µm flux is in mJy.
which emit in the mid-IR but do not produce aromatic
features.
5. Physical conditions in the PDRs
We derive the average physical conditions in the neutral
gas in galaxies, by comparing the observed line to contin-
uum ratio (L
[CII]
+ L
[OI]
)
/L
FIR
and F
ν
(60
µm)/F
ν
(100
µm)
with PDR models (e.g. Kaufman et al. 1999). The main
results of this study are (Malhotra et al. 2001):
(1) The derived temperatures at the PDR surfaces
range from 270-900 K, and the pressures range from 6
×
10
4
− 1.5 × 10
7
Kcm
−3
. The lower value of the pressure
range is roughly twice the local solar neighborhood value
and the upper end is comparable to pressures in HII re-
gions in starburst galaxies (Heckman, Armus & Miley
1990) which also corresponds to the pressure and sur-
face brightness at which starbursts saturate (Meurer et
al. 1997).
(2) The average FUV flux
G
0
and gas density
n scale
as G
0
∝ n
1.4
. This correlation is most naturally explained
as arising from Str¨
omgren sphere scalings if much of the
line and continuum luminosity arises near star-forming
regions. From simple Str¨
omgren sphere calculations (cf.
Spitzer 1978) we can derive that the FUV flux at the neu-
tral surface just outside the Str¨
omgren sphere should scale
as G
0
∝ n
4/3
, which is consistent (within errors) to the
scaling seen in Figure 4. The
G
0
,
n and P which we derive

158
for given galaxy represent a luminosity weighted average
value and mostly represents dense GMCs which lie close
to the OB stars.
(3) The range of
G
0
,
n and P which we derive for the
different galaxies can reflect several interesting differences
in their star formation processes and histories. If global
star formation is episodic then high G
0
and
n imply that
the galaxy is observed shortly after a burst because the
OB stars have not moved far from their natal clouds. Al-
ternatively, the differences in
G
0
,
n and P may reflect
differences from galaxy to galaxy in the properties of the
GMCs which form the OB stars. Larger GMCs may keep
their OB stars embedded for a longer fraction of their life-
time, resulting in higher average
G
0
and
n. Or the GMCs
could be the same size but denser, so that the higher den-
sity ambient gas would lead to smaller Stromgren spheres
and higher
G
0
at the edges of the spheres.
Figure 4. This figure shows the derived far-UV flux G
0
and gas
density
n solution for the ISO key-project galaxies based on
comparison of FIR line data and PDR models of Kaufman et
al. 2001. A least square fit is made to the
G
0
vs.
n relation
assuming equal error in both axes. The best fit slope is 1.4,
i.e. G
0
∝ n
1.4
, which is consistent with PDRs surrounding
ionization bounded expanding HII regions.
6. Conclusions
It seems unlikely that spectroscopy with HSO will be used
to find redshifts of infrared bright galaxies with unknown
or obscured optical counterparts simply because scanning
the possible redshift range would be time consuming. But
once the redshifts are known, one can use the observations
of [CII] and [OI](63
µm) lines to derive the physical con-
ditions in PDRs. Or if photometric redshifts using mid to
far-infrared colors can be refined enough, one could search
for fine structure lines to get the precise redshifts.
FIR spectroscopy of modest redshift (
z 1) galaxies
would be feasible with the HSO. This would be valuable
to understand the higher global rates of star-formation in
this epoch at roughly half the age of the universe. With
ISO we have been able to characterize the ISM in star-
forming local galaxies, so we do have a comparison set.
Acknowledgements
I wouldlike to thank my collaborators on the ISO Key Project
- George Helou, Michael Kaufman, DavidHollenbach, Danny
Dale, Alexandra Contursi and Gordon Stacey. SM’s research
funding is provided by NASA through Hubble Fellowship grant
# HF-01111.01-98A from the Space Telescope Science Insti-
tute, which is operatedby the Association of Universities for
Research in Astronomy, Inc., under NASA contract NAS5-
26555.
References
Benford, D.J., 1999, PhD Thesis, California Institute of Tech-
nology.
Bergvall, N., Masegosa, J., ¨
Ostlin, G., & Cernicharo, J. 2000,
A&A, 359, 41
Elbaz, D. et al. 1999, A & A, 351, L37
Heckman, T. M., Armus, L. & Miley, G. K. 1990, AJS, 74, 833
Helou, G., Malhotra, S., Hollenbach, D. J., Dale, D. A., &
Contursi, A. 2001, ApJ, 548, L73
Hunter et al. 2001, to appear on ApJ (astro-ph/0012354)
Kaufman, M., Wolfire, M.G., Hollenbach, D., Luhman, M 1999,
ApJ, in press.
Leech, K. J. et al. 1999, MNRAS, 310, 317
Luhman, M.L., et al. 1998, ApJ, 504, L11.
Madau, P., Ferguson, H. C., Dickinson, M. E., Giavalisco, M.,
Steidel, C. C., & Fruchter, A. 1996, MNRAS, 283, 1388
Malhotra, S. et al. 1997, ApJ, 491, L27
Malhotra, S. et al. 1999, in Universe as seen by ISO, ed: Cox,
P., Kessler, M.
Malhotra, S. et al. 2000, ApJ, 543, 634.
Malhotra, S. et al. 2001, Submittedto ApJ.
Meurer, G. R., Heckman, T. M., Lehnert, M. D., Leitherer, C.
& Lowenthal, J. 1997, AJ, 114, 54
Pierini, D., Leech, K. J., Tuffs, R. J., & Volk, H. J. 1999, MN-
RAS, 303, L29
Smith, B. J. & Madden, S. C. 1997, AJ, 114, 138
Spitzer, L. 1978, Physical Processes in the Interstellar medium,
John Wiley & Sons.
Stacey, G.J., Geis, N., Genzel, R., Lugten, J.B., Poglitsch, A.,
Sternberg, A., Townes, C.H. 1991, ApJ, 373, 423.
Thuan, T. X., Sauvage, M., & Madden, S. 1999, ApJ, 516, 783
Unger, S. J. et al. 2000, A&A, 355, 885
van der Werf, P. P. 1999, ASP Conf. Ser. 156: Highly Red-
shiftedRadio Lines, 91
Xu, C. et al. 1998, ApJ, 508, 576
Wyszukiwarka
Podobne podstrony:
Metallicity Effects on the ISM of Dwarf Galaxies The Promise of the Herschel Space Observatory
Smarzewska, Sylwia; Ciesielski, Witold Application of a Graphene Oxide–Carbon Paste Electrode for t
The importance of the archives of Venice, Bologna and Modena for the Crimean studies 2017 [Firat Yaş
Hillary Clinton and the Order of Illuminati in her quest for the Office of the President(updated)
Translation of documents and legal acts for the EU abridged
Exclusive Hillary Clinton and the Order of Illuminati in her quest for the Office of the President
Genesis for the New Space Age Secret Development of the Round Wing Plane the Extra Terrestrials Ins
Of Corpses and Gold Materials for the Study of the Vetala and the Ro langs by Michael Walter Tibet
Eurocode 3 Part 1 12 2007 UK NA Design of Steel Structures Additional Rules for the Extension of
Hillary Clinton and the Order of Illuminati in her quest for the Office of the President(2)
Tables of Tables plasmonic resonant frequencies for the following metals
Eurocode 3 Part 1 12 2007 Design of Steel Structures Additional Rules for the Extension of EN 199
Far Infrared Energy Distributions of Active Galaxies in the Local Universe and Beyond From ISO to H
Far infrared and microwave drying of peach (Jun Wang, Kuichuan Sheng)
Practical Analysis Techniques of Polymer Fillers by Fourier Transform Infrared Spectroscopy (FTIR)
An Infrared Study of the L1551 Star Formation Region What We Have Learnt from ISO and the Promise f
Accelerated drying of welsh onion by far infrared radiation under vacuum (S Mongpraneet, T Abe , T T
Far infrared and microwave drying of peach (Jun Wang, Kuichuan Sheng)
więcej podobnych podstron