Page 1 of 8
(page number not for citation purposes)
BMC Genetics
Research article
Genetic structure of four socio-culturally diversified caste
populations of southwest India and their affinity with related Indian
and global groups
Revathi Rajkumar and VK Kashyap*
Address: DNA Typing Unit, Central Forensic Science Laboratory, 30 Gorachand Road, Kolkata, India-700014
Email: Revathi Rajkumar - revathi_77@rediffmail.com; VK Kashyap* - vkk2k@hotmail.com
* Corresponding author
Abstract
Background: A large number of microsatellites have been extensively used to comprehend the
genetic diversity of different global groups. This paper entails polymorphism at 15 STR in four
predominant and endogamous populations representing Karnataka, located on the southwest coast
of India. The populations residing in this region are believed to have received gene flow from south
Indian populations and world migrants, hence, we carried out a detailed study on populations
inhabiting this region to understand their genetic structure, diversity related to geography and
linguistic affiliation and relatedness to other Indian and global migrant populations.
Results: Various statistical analyses were performed on the microsatellite data to accomplish the
objectives of the paper. The heretozygosity was moderately high and similar across the loci, with
low average G
ST
value. Iyengar and Lyngayat were placed above the regression line in the R-matrix
analysis as opposed to the Gowda and Muslim. AMOVA indicated that majority of variation was
confined to individuals within a population, with geographic grouping demonstrating lesser genetic
differentiation as compared to linguistic clustering. D
A
distances show the genetic affinity among
the southern populations, with Iyengar, Lyngayat and Vanniyar displaying some affinity with
northern Brahmins and global migrant groups from East Asia and Europe.
Conclusion: The microsatellite study divulges a common ancestry for the four diverse populations
of Karnataka, with the overall genetic differentiation among them being largely confined to intra-
population variation. The practice of consanguineous marriages might have attributed to the
relatively lower gene flow displayed by Gowda and Muslim as compared to Iyengar and Lyngayat.
The various statistical analyses strongly suggest that the studied populations could not be
differentiated on the basis of caste or spatial location, although, linguistic affinity was reflected
among the southern populations, distinguishing them from the northern groups. Our study also
indicates a heterogeneous origin for Lyngayat and Iyengar owing to their genetic proximity with
southern populations and northern Brahmins. The high-ranking communities, in particular, Iyengar,
Lyngayat, Vanniyar and northern Brahmins might have experienced genetic admixture from East
Asian and European ethnic groups.
Published: 19 August 2004
BMC Genetics 2004, 5:23
doi:10.1186/1471-2156-5-23
Received: 17 January 2004
Accepted: 19 August 2004
This article is available from: http://www.biomedcentral.com/1471-2156/5/23
© 2004 Rajkumar and Kashyap; licensee BioMed Central Ltd.
This is an open-access article distributed under the terms of the Creative Commons Attribution License (http://creativecommons.org/licenses/by/2.0),
which permits unrestricted use, distribution, and reproduction in any medium, provided the original work is properly cited.

BMC Genetics 2004, 5:23
http://www.biomedcentral.com/1471-2156/5/23
Page 2 of 8
(page number not for citation purposes)
Background
The Indian subcontinent is regarded as a natural genetic
laboratory, owing to the co-existence and interaction of
socio-culturally, linguistically, ethnically and genetically
diversified endogamous populations in a geographical
terrain. It is believed that the earliest humans leaving
Africa for Eurasia might have taken a coastal route across
Saudi Arabia, through Iraq, Iran, to Pakistan and finally
entered India along the coastlines [1]. A second wave of
migration (~10,000 years ago) brought in Proto-Dravid-
ian Neolithic farmers from Afghanistan, who were later
displaced southwards by a large influx of Indo-European
speakers ~3500 years ago in to the subcontinent [2,3]. The
origin and settlement of the Indian people still remains
intriguing, fascinating scientists to explore the impact of
these past and modern migrations on the genetic diversity
and structure of contemporary populations [4-6].
Anthropologically, southern and northern populations
are distinct and these differences are further substantiated
by (i) the presence of Neolithic sites in this region suggests
that Neolithic people of southern India came from north
by land and the west-coast by sea [7], (ii) the southern
megaliths resemble closely with those of the Mediterra-
nean and western-Europe, while those from northern
India are similar to megaliths found in Iran and Baluch-
isthan [8], and (iii) the predominance of Dravidian lan-
guage in this region as opposed to their secluded
occurrence in central Asia and other parts of India, sug-
gests that the Dravidian languages might have originated
within India [9]. It is, thus, of considerable genetic interest
to understand the genetic structuring and relationships of
southern populations.
The present study was carried out on one of the largest
southern states, Karnataka, positioned on the southwest
coast of India, with a dwelling of about 50 million people.
This expanse has been a rich source of prehistoric discov-
eries dating back to the Paleolithic era that are akin to
those seen in Europe [7]. Karnataka has received continu-
ous gene flow from different caste and linguistic groups
residing in the adjoining areas of Maharashtra, Andhra
Pradesh and Tamil Nadu [10], resulting in the congrega-
tion of a large number of diverse endogamous groups
within this region. Its large coastline of about 400 Km also
attracted the Portugese, Dutch and French traders, who
were seeking more profitable ventures on the southern
coast at large [2]. Southwest India is, thus, one of the most
disparate terrains, with extensive colonization in the past
and justifies an in-depth genetic study.
A few studies utilizing classical markers have been carried
out on southern populations [5,11,12], including few
communities of Karnataka [13,14]. However, sound infer-
ences relating to their genetic structuring and diversity
could not be drawn due to low discriminatory power of
these markers. Recently, microsatellite markers have
gained immense popularity in precisely defining popula-
tion structure, diversity, affinities, gene flow and other
crucial aspects associated with population genetics [15-
21] because of the relative expediency, with which a large
number of loci and alleles can be typed, facilitating the
accumulation of vast data sets that can be readily analyzed
with an extensive array of statistical tools [22,23]. These
markers also demonstrate high heterozygosity [24], ren-
dering them highly suitable for carrying out the present
study.
Among the different caste and tribal groups inhabiting the
southwest coast of India, we have selected four predomi-
nant Dravidian-speaking communities from Karnataka:
Iyengar Brahmin, Lyngayat, Gowda and Muslim, they not
only belong to dissimilar groups of the Indian caste hier-
archy but also have varied migration histories, conferring
them uniqueness and significance from a genetic perspec-
tive. The present microsatellite study primarily attempts to
understand the genetic structure of the four selected pop-
ulations and to determine their genetic relationship with
other linguistically and ethnically similar groups of south-
ern India and Brahmin groups of northern India. It has
been suggested that that despite the linguistic homogene-
ity in southern India, these populations have remained
genetically diversified [25]. Hence, we sought to deter-
mine the role played by geographical location and linguis-
tic affiliation in genetically differentiating Indian
populations. Also, as mentioned earlier, the western coast
has witnessed colonization from different world popula-
tions, we aim to divulge the impact of these past migra-
tions on the gene pool of the present southern
populations by discerning their relationship with histori-
cally acclaimed and established migrant groups, ethni-
cally represented by European, Hispanic, East Asian and
African populations.
Results
Allele frequency at 15 STR was used to compute the heter-
ozygosity (observed) for the four studied populations,
which varied for each locus, and population but reflected
similar values, ranging between 0.724 and 0.797 (Table
1). An average G
ST
value of 0.009 elucidates the low degree
of genetic differentiation in them. However, the G
ST
value
for the pooled Indian and global populations demon-
strated a high value at 2.3% (data not shown). Genetic
relationship of studied populations with other similar
southern groups; Vanniyar, Gounder, Pallar and Tanjore
Kallar [26,27], northern Brahmins belonging to Orissa
[28] and Bihar [29], and four relevant global ethnic
groups: European, Hispanic, African [30] and East Asian
[31] was divulged by computing DA distances (Table 2)
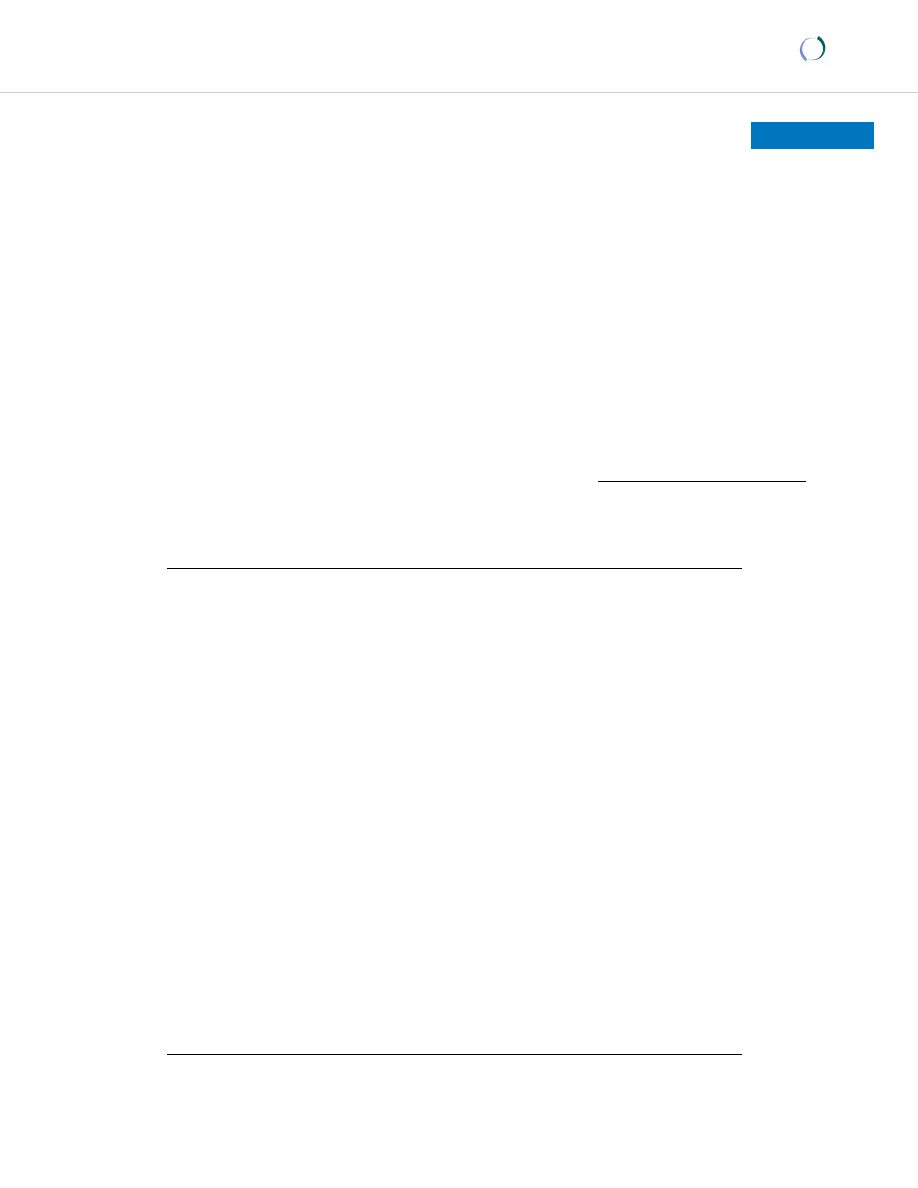
and represented using NJ tree (Fig. 1). Among the four

BMC Genetics 2004, 5:23
http://www.biomedcentral.com/1471-2156/5/23
Page 3 of 8
(page number not for citation purposes)
studied populations, Iyengar, Gowda and Muslim formed
a distinct cluster. Although NJ tree clearly depicts the clus-
tering of southern populations, D
A
distances indicate that
among these groups, Iyengar, Lyngayat and Vanniyar are
more similar to the northern Brahmins (0.030). Further-
more, genetic distances emphasize the affinity of Lyngayat
with Tanjore Kallar (0.029), Iyengar (0.026) and Vanniyar
(0.028). Estimation of relatedness between the southern
and global populations shows that all the southern com-
munities formed a separate cluster, nevertheless, genetic
distances disclose the affinity of upper caste Indian com-
munities; Iyengar, Lyngayat, Vanniyar, Bihar and Oriya
Brahmin with Europeans and East Asians. The Indian
populations were most distant to Africans.
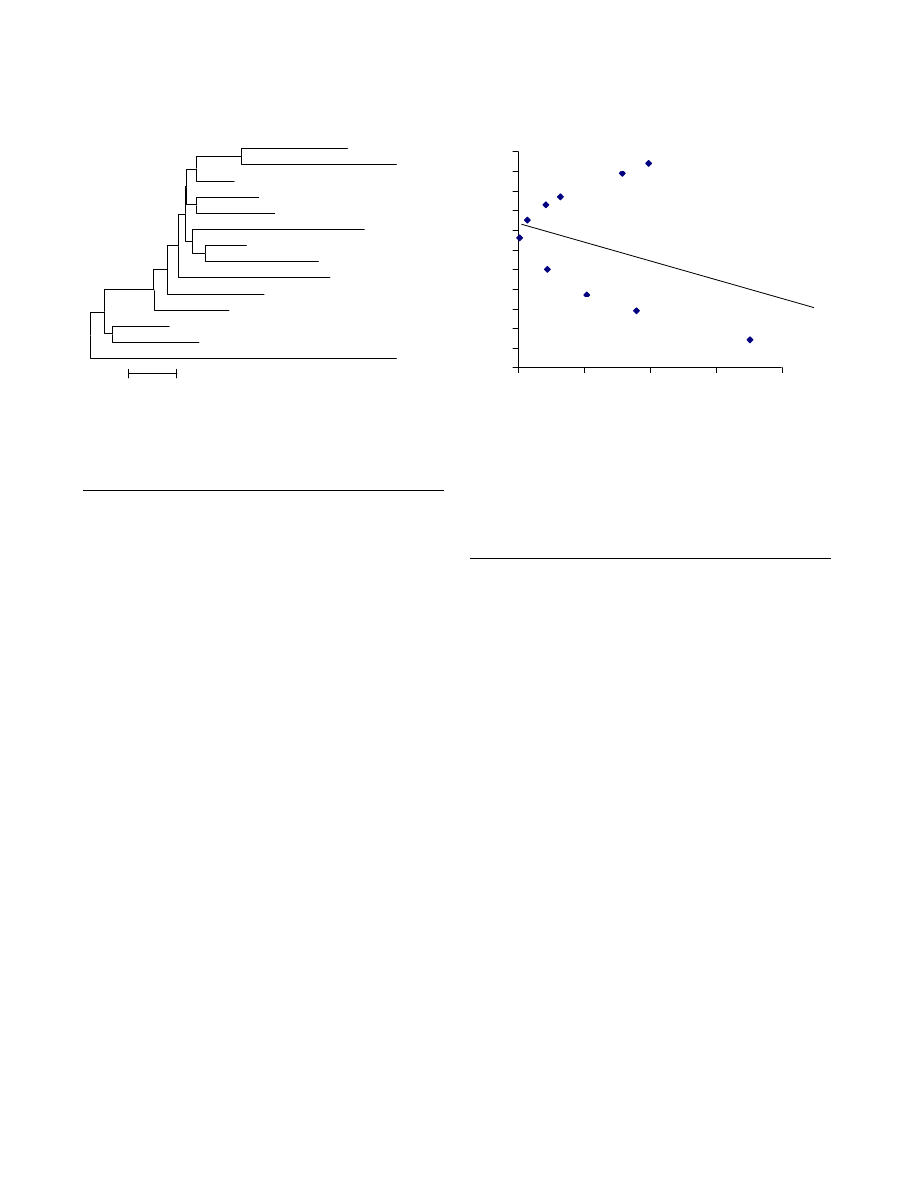
The regression model (Fig. 2), of mean per locus heterozy-
gosity against distance from centroid assumes that when a
population experiences same amount of gene flow from a
homogenous source, a linear relationship exists between
the expected and observed heterozygosity. A change in
gene flow directly affects this linear relationship. The R-
matrix when applied to the Indian populations assists in
Table 1: Average heterozygosity and G
ST
values for 15 loci in the four studied populations.
OBSERVED HETEROZYGOSITY
LOCUS
G
ST
BRAHMIN
LINGAYAT
GOWDA
MUSLIM
TPOX
0.707
0.581
0.542
0.555
0.010
D3S1358
0.661
0.793
0.559
0.488
0.036
THO1
0.815
0.785
0.678
0.688
0.005
D21S11
0.876
0.857
0.779
0.733
0.005
D18S51
0.907
0.938
0.779
0.888
0.006
PENTA E
0.921
0.876
0.864
0.800
0.014
D5S818
0.692
0.724
0.525
0.733
0.007
D13S317
0.753
0.714
0.745
0.733
0.007
D7S820
0.723
0.734
0.754
0.800
0.005
D16S539
0.861
0.846
0.830
0.777
0.010
CSF1PO
0.723
0.734
0.745
0.733
0.009
PENTA D
0.815
0.755
0.741
0.933
0.006
vWA
0.784
0.734
0.779
0.688
0.002
D8S1179
0.861
0.822
0.745
0.755
0.007
FGA
0.861
0.894
0.803
0.911
0.017
Average
0.797
0.785
0.724
0.747
0.009
Table 2: D
A
distance matrix between ten Indian and four global groups based on allele frequency at 15 microsatellites.
Pop
HS
NE
MO
CA
OB
IB
LY
GO
MU
BB
PL
VN
TK
GD
HS
NE
0.079
MO
0.049
0.123
CA
0.029
0.086
0.07
OB
0.044
0.092
0.052
0.04
IB
0.044
0.091
0.041
0.04
0.03
LY
0.047
0.096
0.047
0.04
0.03
0.026
GO
0.066
0.122
0.072
0.07
0.055
0.036
0.047
MU
0.076
0.118
0.078
0.07
0.066
0.051
0.056
0.054
BB
0.043
0.101
0.052
0.05
0.038
0.031
0.037
0.054
0.068
PL
0.061
0.11
0.067
0.07
0.064
0.05
0.056
0.075
0.077
0.063
VN
0.045
0.105
0.042
0.04
0.034
0.023
0.028
0.039
0.053
0.037
0.049
TK
0.047
0.096
0.053
0.05
0.044
0.028
0.029
0.052
0.062
0.044
0.052
0.032
GD
0.064
0.112
0.064
0.06
0.051
0.036
0.043
0.057
0.073
0.054
0.059
0.032
0.043
Abbreviations used in Table- Hispanic – HS, African – AF, Asian – AS, European – EU, OriyaBrahmin – OB, Iyengar Brahmin – IB, Lyngayat –
LY, Gowda – GO, Muslim – MU, Bihar Brahmin – BB, Pallar – PL, Vanniyar – VN, Tanjore Kallar – TK, Goundar – GD.
BMC Genetics 2004, 5:23
http://www.biomedcentral.com/1471-2156/5/23
Page 4 of 8
(page number not for citation purposes)
understanding the influence of external gene flow and
admixture among populations. The higher observed than
expected heterozygosity of Iyengar and Lyngayat, placed
above the theoretical regression line helps infer that these
populations have received more than average external
gene flow, which was also observed in Vanniyar, Pallar
and Oriya Brahmin. The Gowda and Muslim groups
exhibit lower than expected heterozygosity values and fall
below the regression line, suggesting lesser admixture in
them.
The microsatellite diversity computed using AMOVA
revealed that the genetic variation observed in Indian
populations was mainly confined to variation amongst
individuals (~98%), irrespective of their geographic or
linguistic grouping (Table 3). The geographical clustering
of populations into three regions: north, southwest (Kar-
nataka) and southeast (Tamil Nadu) demonstrated a low
variance of 0.29%, p = 0.010 (Table 3a). As compared to
geographical grouping, the linguistic clustering (Indo-
Caucasian and Dravidian) exhibited a noticeable increase
in the molecular variance between the two groups, 0.65%
(p = 0.06, Table 3b). The genetic diversity among popula-
tions within each group remained almost similar at both
levels of analysis.
Discussion
In recent years, population genetics has witnessed exten-
sive use of microsatellite markers to understand and evo-
lutionary histories of contemporary human populations
[17,32-34]. Though, the populations inhabiting south
India have played a major role in formation of the Indian
gene pool, however, very few genetic studies have been
carried out on them. The present study utilizes 15 STRs to
provide comprehensive genetic information on four pre-
dominant communities inhabiting the southwest coast of
India, which may significantly help in understanding the
genetic composition of southern populations.
Genetic structure of Karnataka populations
The most distinctive feature revealed by the fifteen micro-
satellites was the considerable genetic homogeneity
amongst the four diverse caste groups residing in south-
west India. The presence of an almost similar allele fre-
quency pattern [34], suggests that these populations
might have a common ancestry or probably experienced
very high gene flow during the period of their coexistence.
The above finding is further supported by the low genetic
differentiation of 1.0% among the studied groups irre-
spective of their caste and migration histories. The high
heterozygosity and rii values in Lyngayat reflect the
admixture and stochastic processes experienced by it. The
genetic affinity of Lyngayat with other related southern
caste populations, like, Iyengar, Vanniyar and Tanjore
Kallar reiterates its heterogeneous past. It is noteworthy
that although the southern populations exhibited higher
affinity amongst each other, the high-ranking popula-
tions, like, Iyengar, Lyngayat and Vanniyar also displayed
Neighbor-joining tree depicting the genetic relationship of
Karnataka populations with related Indian and global ethnic
groups based on 15 STR markers
Figure 1
Neighbor-joining tree depicting the genetic relationship of
Karnataka populations with related Indian and global ethnic
groups based on 15 STR markers.
Gowda
Muslim
IyengerBrahmin
Lyngayat
Tanjorekallar
Pallar
Vanniyar
Goundar
EastAsian
BiharBrahmin
OriyaBrahmin
Hispanic
European
African
0.01
Regression plot demonstrating the relatively higher gene flow
levels in high-ranking populations of India
Figure 2
Regression plot demonstrating the relatively higher gene flow
levels in high-ranking populations of India. Abbreviations
used in figure: OB-Oriya Brahmin, PL-Pallar, IB-Iyngar
Brahmin, VN-Vanniyar, LY-Lyngayat, TK-Tanjorekallar, GD-
Goundar, Mu-Muslim, BB-Bihar Brahmin, GO-Gowda.
0.71
0.72
0.73
0.74
0.75
0.76
0.77
0.78
0.79
0.8
0.81
0.82
0
0.05
0.1
0.15
0.2
PL
OB
IB
VN
LY
KL
GD
MU
BB
GO
Distance from centroid (rii)

BMC Genetics 2004, 5:23
http://www.biomedcentral.com/1471-2156/5/23
Page 5 of 8
(page number not for citation purposes)
some genetic similarity to Brahmins from Bihar and
Orissa, indicating that the gene pool of Iyengar and Lyn-
gayat probably consists of genetic inputs from both south-
ern and northern groups. However, strong conclusions
cannot be drawn due to low genetic differentiation among
the studied populations. Though the Gowda is known to
have moved in to Karnataka from the adjoining area of
Tamil Nadu, our study reveals that Gowda cluster with the
studied populations and not with Tamil groups. The low
hetetozygosity and high rii values of Gowda implies that
it might have differentiated as a result of stochastic proc-
esses. Furthermore, the relatively lower heterozygosity
and admixture levels of Gowda and Muslim might be
attributed to the socio-cultural practice of consanguine-
ous marriages in them. The Muslim group was found to be
genetically similar to local populations. Regional conver-
sions from diverse castes that occurred during the period
of Islamic dominance might elucidate the more or less
identical genetic relationship between Muslims and other
studied groups. The microsatellite study emphasizes the
genetic similarity among the Karnataka populations, with
the lack of any strong caste or religious bias in them.
Analysis of genetic variance
AMOVA test strongly suggests that genetic diversity
among the southern populations was mainly confined to
intra-population variation, further emphasizing the
genetic homogeneity in them. Analysis using different
genetic markers corroborate with our finding that the
genetic diversity in human populations can be mainly
attributed to variation within populations
[4,17,19,34,36,37].
An exploration of the genetic differentiation based on
geographical grouping of populations discloses the
genetic similarity among populations residing in a region.
Nevertheless, the geographic affinity was comparably
lesser to that observed within the two linguistic families,
viz., Dravidian and Indo-European. Our finding provides
evidence to the strong linguistic affinity prevailing
amongst the Dravidian speaking populations and imparts
them genetic distinctness from the Indo-European lin-
guistic group. Even though prior studies have indicated
that genetic clusters often correspond closely to
predefined regional and linguistic groups [34], AMOVA
suggests that caste system along with geographical conti-
guity are not ideal platforms for differentiating the ana-
lyzed Indian populations. It must, however, be
acknowledged that use of less number of polymorphisms
in this study might plausibly have led to the greater influ-
ence of linguistic affiliation on these populations rather
than geographical proximity.
Genetic affinity with global populations
The genetic differentiation of the studied populations
with relevant global migrant groups was estimated to be
2.3%, relatively lower than the 9% observed in another
similar study [16], which had used a different set of mic-
rosatellite markers. Sampling from a confined area, as
well as the use of lesser number of loci might have con-
tributed to this apparent difference in the results. The
southern populations formed a separate cluster from the
world populations. Molecular studies on Indian
populations using diverse markers (nuclear, mtDNA and
Y-chromosome) have demonstrated that the upper caste
populations have higher semblance with Europeans than
Asians [26]. Intriguingly, in the present study, communi-
ties belonging to the upper strata of the Hindu caste hier-
archy, i.e., Iyengar, Lyngayat, Vanniyar and northern
Brahmins, displayed almost identical genetic affinity with
both Europeans and East Asians. Therefore, all though it
is believed that south India remained isolated and cush-
ioned from the foreign invasions, the southern popula-
tions, especially, the high-ranking groups might have
genetically admixed with migrant groups that entered via
the west coast and north. Further exploration of their rela-
Table 3: Genetic differentiation of Indian populations based on AMOVA
(a) Geographical grouping
Groups in set 1
Source of Variation
Percentage Variation
Group 1 – North: Bihar and Orissa populations
Among groups
0.29
Group 2 – South-west: Karnataka populations
Among populations in groups
0.97
Group 3 – South-east: Tamil Nadu Populations
Within populations
98.74
(b) Linguistic grouping
Groups in set 2
Source of Variation
Percentage Variation
Group 1 – Indo-European: Orissa and Bihar
Among groups
0.69
Group 2 – Dravidian: Southern populations
Among populations in groups
0.94
Within populations
98.40

BMC Genetics 2004, 5:23
http://www.biomedcentral.com/1471-2156/5/23
Page 6 of 8
(page number not for citation purposes)
tionship is essential before drawing concrete conclusions.
A more comprehensive picture would emerge on analysis
of mtDNA and Y chromosome markers.
Methods
The populations
The populations selected in this study comprise of three
major Hindu castes-Iyengar, Lyngayat, Gowda and a Mus-
lim community, inhabiting the southwest coastal terrain
of Karnataka (11.3 – 18.45°N latitudes and 74.12 –
78.40°E longitudes). All the populations belong to the
Dravidian linguistic family and are speakers of the local
dialect, Kannada, but differ in caste hierarchy and socio-
religious practices. Consanguineous marriages have been
reported in Karnataka, with inbreeding levels of the order
0.020 to 0.033, in general [38].
Iyengar hold a high position in the Indian caste hierarchy
and sporadic accounts on Brahmin, suggests that they pri-
marily migrated from the upper Gangetic plains to south-
ern India. Nonetheless, few bioanthropological studies
have revealed that morphologically Brahmins of a geo-
graphical region are similar to the local groups.
Lyngayat community was initially formed, as a religious
cult by the amalgamation of people from different castes
and geographical regions but later developed into a dis-
tinct community practicing strict marriage endogamy
with social sub-divisions such as clans, sub-castes and
sects [10].
Gowda is a low ranking agriculturist caste group that typ-
ically exhibits the Dravidian socio-cultural characteristic
of consanguineous marriage. It is believed to have moved
in from the adjoining area of Tamil Nadu.
Muslim is a linguistically heterogeneous, complex religio-
ethnic group, [10]. It is believed that the invasion of
Turks, Afghans (A.D 998–1030) and Moghals during the
15
th
century, introduced new genes only in northern
India, suggesting that Muslims from Southern India are
mainly local converts [3].
Micosatellite loci studied
The 15 STR marker set analyzed in this study consists of
thirteen tetra nucleotide repeat loci: D3S1358, THO1,
D21S11, D18S51, D5S818, D13S317, D7S820, D16S539,
CSF1PO, vWA, D8S179, TPOX, FGA and two penta nucle-
otide repeat loci: Penta D, Penta E. Their repeat size makes
them less prone to slippage of polymerase during enzy-
matic amplification compared to the dinucleotide repeats,
allowing unambiguous typing [20]. The 15 selected loci
are situated on 13 different chromosomes, with D5S818
and CSF1PO being present on chromosome 5 and Penta
D and D21S11, located on chromosome 21. The alleles
across the loci are substantially unlinked, making them
suitable for analyzing inter and intra-population genetic
diversity.
STR Typing
The blood samples were collected from unrelated individ-
uals belonging to – Iyengar (65), Lyngayat (98), Gowda
(59) and Muslim (45) communities, residing in different
districts of Karnataka. DNA was extracted from blood by
the phenol-chloroform method [40], followed by quanti-
tation using the QuantiBlot™ kit (Perkin-Elmer, Foster
City, CA, USA). Two nanogram of the isolated DNA was
used as template for the PCR amplification of the 15 STRs
using the PowerPlex™16 kit (Promega Corp., Wisconsin
Madison, USA). Raw data were collected with the GeneS-
can™ software, Ver. 3.2.1 (Applied Biosystems, Foster City,
CA, USA) and typed using the PowerTyper™ 16 Macro
(Promega Corp., Wisconsin Madison, USA).
Statistical Analysis
Allele frequencies of the 15 STR loci were calculated using
the gene counting method [40]. The genetic diversity
(G
ST
), observed heterozygosity and pairwise genetic dis-
tances (DA) were computed using allele frequencies [42].
The DA distance is least affected by sample size and can
precisely obtain correct phylogenetic trees under various
evolutionary conditions [43]. Neighbor-joining trees were
constructed using DA distances [44], and its robustness
was established by bootstrap resampling procedures.
Analysis of molecular variance (AMOVA) was performed
using the Arlequin Ver. 2.00 package [45]. Two levels of
analysis were performed to explore the microsatellite
diversity among the four studied populations along with
six other socio-culturally similar groups inhabiting differ-
ent regions of India. At the first level, three geographical
groups were constructed: (1) north (2) southwest: Karna-
taka and, (3) southeast: Tamil Nadu, to estimate the
genetic variance among populations from diverse geo-
graphical regions. The second set of analysis was aimed at
investigating the genetic diversity between the Dravidian
and Indo-European linguistic family.
To assess the gene flow experienced by these populations,
the rii value, i.e., the genetic distance of a population from
the centroid was calculated using the regression model
[46]. This model utilizes the heterozygosity of each popu-
lation and the distance from the centroid as the arithmetic
mean of allele frequencies:
r
p
P
P
P
ii
i
=
−
(
) ( )
−
( )
2
1
/
,

BMC Genetics 2004, 5:23
http://www.biomedcentral.com/1471-2156/5/23
Page 7 of 8
(page number not for citation purposes)
where, r
ii
is the distance from the centroid, p
i
is the fre-
quency of the allele in i
th
population and is the mean
allelic frequency.
List of abbreviations
STR – Short Tandem Repeat
AMOVA – Analysis of Molecular Variance
NJ tree – Neighbor-Joining tree
Authors' contributions
RR carried out the molecular studies, analyzed the genetic
data and drafted the manuscript. VKK participated in the
design, conceiving and preparation of manuscript. Both
authors read and approved the final manuscript.
Acknowledgements
This work was supported by a research grant under the IX Five Year Plan
to CFSL, Kolkata and a research fellowship from the Ministry of Home
Affairs to the first 1 author. The technical assistance of Dr. R Trivedi is
highly appreciated. This work would not have been possible without the co-
operation of volunteers of blood samples used for genotyping in the study.
The comments of two anonymous reviewers' were extremely helpful in
improving the text of the paper.
References
1.
Cann RL: Genetic clues to dispersal in human populations:
Retracing past from the present. Science 2001, 291:1742-1748.
2.
Majumder PP: People of India: Biological diversity and
affinities. Evolutionary Anthropology 1998, 6:100-110.
3.
Papiha SS: Genetic variation in India. Hum Biol 1996, 68:607-628.
4.
Roychoudhury AK: Genetic relationships of the populations of
eastern India. Ann Hum Biol 1992, 19:489-501.
5.
Mastana SS, Papiha SS: Genetic variability of transferring sub-
types in the populations of India. Hum Biol 1998, 70:729-44.
6.
Mountain JL, Hebert JM, Bhattacharyya S, Underhill PA, Ottolenghi C,
Gadgil M, Cavalli-Sforza LL: Demographic history of India and
mt.DNA-sequence diversity. Am J Hum Genet 1995, 56:979-92.
7.
Sundra A: The early chamber tombs of south India New Delhi: University
Publishers; 1975.
8.
Cavalli-Sforza LL, Menozzi P, Piazza A: The history and geography of
human genes Princeton, NJ: Princeton University Press; 1994.
9.
Gadgil M, Joshi NV, Shambu Prasad UV, Manmohan S, Suresh Patil:
Peopling of India Edited by: Balasubramanian D, Rao D. The Indian
Human Heritage Hyderabad: University Press; 1997.
10.
Singh KS: India's communities national series people of India New Delhi:
Oxford University Press; 1998.
11.
Banerjee S, Roy M, Dey B, Mukherjee BN, Bhattacharjee SK: Genetic
polymorphism of red cell antigen, enzyme, haemoglobin and
serum protein in fifteen endogamous groups of south India.
J Indian Anthropol Soc 1988, 23:250-262.
12.
Walter H, Naide JM, Danker-Hopfe H, de Beck M, Harms M, Babu BV,
Yasmin , Devi SS: Genetic serum protein markers in eight
south Indian caste and tribal populations. Z Morphol Anthropol
1993, 79:355-65.
13.
Mukherjee BN, Reddy AP, Malhotra KC, Vijaykumar M: Patterns of
social and geographical distribution of transferrin subtype
polymorphism in India. Hum Hered 1986, 36:113-118.
14.
Vijayakumar M, Malhotra KC, Walter H, Gilbert K, Linderberg P,
Dannewit A, Sorensen A, Chakraborty R, Reddy AP, Mukherjee BN:
Genetic studies among the Siddis of Karnataka, India: a
migrant population from Africa. Z Morphol Anthropol 1987,
77:97-121.
15.
Dutta R, Kashyap VK: Genetic variation observed at 3 tetra-
meric STR loci HumTHO1, TPOX, and CSF1PO in 5 ethnic
population groups of northeastern India. Am J Hum Biol 2001,
13:23-29.
16.
Dutta R, Reddy BM, Chattopadhyay P, Kashyap VK, Sun G, Deka R:
Patterns of Genetic Diversity at the 9 forensically approved
STR loci in the Indian populations. Hum Biol 2001, 74:33-49.
17.
Deka R, Shriver MD, Yu LM, Herdreich EM, Jin L, Zhong Y, McGarvey
ST, Agarwal SS, Bunker CH, Miki T, Hundrieser J, Yin S, Raskin S, Bar-
rantes R, Ferrell RE, Chakraborty R: Genetic variation at twenty-
three microsatellite loci in sixteen human populations. Journal
of genetics 1999, 78:99-121.
18.
Chu JY, Huang W, Kuang SQ, Wang JM, Xu JJ, Chu ZT, Yang ZQ, Lin
KQ, Li P, Wu M, Geng ZC, Tan CC, Du RF, Jin L: Genetic relation-
ship of populations in China. Evolution 1998, 95:11763-11768.
19.
Reddy MB, Sun G, Luis JR, Crawford MH, Heman NS, Deka R:
Genomic diversity at 13 STR loci in a substructured caste
population, Golla, of southern Andhra Pradesh, India. Human
Biology 2001, 73:175-190.
20.
Mukherjee N, Majumder PP, Roy B, Roy M, Chakraborty M, Banerjee
S: Variation in 4 short tandem repeat loci in 8 population
groups of India. Hum Biol 1999, 71:439-446.
21.
Destro-Bisol G, Boschi I, Caglia A, Tofanelli S, Pascali V, Paoli G,
Spedini G: Microsatellite variation in central Africa: An analy-
sis of Intrapopulation and interpopulation genetic diversity.
Am J Phys Anthropol 2000, 112:319-337.
22.
Dib C, Faure S, Fizames C, Samson D, Drouot N, Vignal A, Millasseaur
P, Marc S, Hazan J, Seboun E, Lathrop M, Gyapay G, Morissette J,
Meissenbach J: A comprehensive genetic map of the human
genome based on 5,624 microsatellites. Nature 1996,
380:152-154.
23.
Zhivotorsky LA, Feldman MW, Grishechkin SA: Biased mutation
and microsatellite variation. Mol Biol Evol 1997, 14:926-933.
24.
Kimmel M, Chakraborty R, King JP, Bamshad M, Watkins WS, Jorde
LB: Signatures of population expansion in microsatellite
repeat data. Genetics 1998, 148:1921-1930.
25.
Majumder PP: Genes, diversities and peoples of India. In Ethical
challenges as we approach the end of the human genome project Edited
by: Macer DRJ. Eubios Ethics Institute; 1998:20-33.
26.
Sitalaxmi T, Trivedi R, Kashyap VK: Genotype profile for thirteen
tetranucleotide repeat loci and two pentanucleotide repeat
loci in four endogamous Tamil population groups of India. J
Forensic Sci, USA 2002, 47:1168-1173.
27.
Sitalaxmi T, Trivedi R, Kashyap VK: Autosomal microsatellite
profile of 3 socially diverse ethnic Tamil populations of India.
J Forensic Sci, USA 2003, 47:211-214.
28.
Sahoo S, Kashyap VK: Allele frequencies of data for Powerplex
16 loci in four major populations of Orissa, India. J Forensic Sci,
USA 2002, 47:912-915.
29.
Ashma R, Kashyap VK: Genetic study of 15 important STR loci
among four major ethnic groups of Bihar, India. J Forensic Sci,
USA 2002, 47:1139-1142.
30.
Levedakou EN, Freeman DA, Budzynski MJ, Early BE, McElfresh KC,
Schumm JW, Amin AS, Kim YK, Sprecher CJ, Krenke BE, Silva DA,
McIntosh TM, Grubb JC, Johnston LJ, Sailus JS, Ban JD, Crouse CA,
Nelson MS: Allele Frequencies for fourteen STR Loci of the
PowerPlex™ 1.1 and 2.1 Multiplex Systems and Penta D
Locus In Caucasians, African-Americans, Hispanics, and
Other Populations of the United States of America and
Brazil. J Forensic Sci, USA 2001, 46:423-767.
31.
Law MY, To KY, Ho SH, Pang BCM, Wong LM, Wun SK, Chan KL:
STR data for the PowerPlex™ 16 loci for the Chinese popu-
lation in Hong Kong. Forensic Sci Int 2002, 129:64-67.
32.
Calafell F, Shuster A, Speed WC, Kidd KK: Short tandem repeat
polymorhism evolution in humans. Eur J Hum Genet 1998,
6:38-49.
33.
Bosch E, Calafell F, Perez-Lezaun A, Clarimon J, Comas D, Mateu E,
Martinez-Arias R, Morera B, Brakez Z, Akhayat O, Sefiani A, Hariti G,
Cambon-Thomsen A, Bertranpetit J: Genetic structure of north-
west Africa revealed by STR analysis. Eur J Hum Genet 2000,
8:360-366.
34.
Rosenberg NA, Pritchard JK, Weber JL, Cann HM, Kidd KK, Zhivot-
ovsky LA, Feldman MW: Structure of human populations. Science
2002, 298:2381-2385.
35.
Rajkumar R, Kashyap VK: Distribution of alleles of fifteen STR
loci of the Powerplex 16 multipex in four predominant pop-
ulation groups of south India. Forensic Sci Int 2002, 126:175-179.
P
Publish with
and every
scientist can read your work free of charge
"BioMed Central will be the most significant development for
disseminating the results of biomedical researc h in our lifetime."
Sir Paul Nurse, Cancer Research UK
Your research papers will be:
available free of charge to the entire biomedical community
peer reviewed and published immediately upon acceptance
cited in PubMed and archived on PubMed Central
yours — you keep the copyright
Submit your manuscript here:
http://www.biomedcentral.com/info/publishing_adv.asp
BMC Genetics 2004, 5:23
http://www.biomedcentral.com/1471-2156/5/23
Page 8 of 8
(page number not for citation purposes)
36.
Mastana SS, Reddy PH, Das MK, Das K: Molecular genetic diver-
sity in 5 populations of Madhya Pradesh, India. Human Biol
2000, 72:499-510.
37.
Pandey BN, Das PKL, Pankaj PK, Vasulu TS: Genetic diversity and
population structure among 13 endogamous populations of
Purnis, Bihar. The mankind Quaterly 2000, 40:355-380.
38.
Bittles AH, Coble JM, Rao NA: Trends in consanguineaous mar-
riage in Karnataka, south India, 1980–89. J Biosoc Sci 1993,
25:111-6.
39.
Bamshad M, Kivisild T, Watkins WS, Dixon ME, Ricker CE, Rao BB,
Naidu JM, Prasad ME, Reddy PG, Rasanayagam A, Papiha SS, Villems
R, Reddy AJ, Hammer MF, Nguyen SV, Carroll ML, Batzer MA, Jorde
LB: Genetic evidence on the origins of Indian caste
populations. Genome Research 2001, 11:994-1004.
40.
Sambrook J, Fritsch EF, Maniatis T: Molecular cloning: A laboratory man-
ual Edited by: Ford N, Nolan C, Ferguson MC. Cold Spring Harbor:
Cold Spring Harbor Laboratory Press; 1989.
41.
Li CC: First course in population genetics C A: Boxwood; 1976.
42.
Nei M, Tajima F, Tateno Y: Accuracy of estimated phylogenetic
trees from molecular data. J Mol Evol 1983, 19:153-170.
43.
Takazaki N, Nei M: Genetic distances and reconstruction of
phylogenetic trees from microsatellite DNA. Genetics 1996,
144:389-399.
44.
Saitou N, Nei M: The neighbor-joining method: A new method
for reconstrusting phylogenetic trees. Mol Biol Evol 1987,
4:406-425.
45.
Schneider S, Roessli D, Excoffier L: Arlequin ver 2.000: A soft-
ware for population genetic analysis. Genetics and Biometry Labo-
ratory, University of Geneva, Switzerland 2000.
46.
Harpending HC, Ward R: Chemical systematics and human
evolution. In Biochemical aspects of evolutionary biology Edited by:
Nitecki M. IL: University of Chicago Press; 1982:213-256.
Document Outline
- Abstract
- Background
- Results
- Discussion
- Methods
- List of abbreviations
- Authors' contributions
- Acknowledgements
- References
Wyszukiwarka
Podobne podstrony:
[Open Life Sciences] Genetic diversity and population structure of wild pear (Pyrus pyraster (L ) Bu
A Semantic Approach to the Structure of Population Genetics
A Behavioral Genetic Study of the Overlap Between Personality and Parenting
Lesley Jeffries Discovering language The structure of modern English
SCI03 Model Making Workshop Structure of Tall Buildings and Towers
Prezentacja2 Structures of literature
1 Structure of employment of different countries
Internal Structure of the?rth
materialy z alkoholi Nomenclature and Structure of Alcohols
Genetic Methods of Polymer Synthesis
Analysis of spatial shear wall structures of variable cross section
Molecular structure of rubidium six
A Behavioral Genetic Study of the Overlap Between Personality and Parenting
Lesley Jeffries Discovering language The structure of modern English
NLP The Structure of Unconscious Excuses
Anderson (2008) The Logical Structure of Linguistic Theory
Structures of Normative Theories
Role of the Structure of Heterogeneous Condensed Mixtures in the Formation of Agglomerates
The Structure of DP in English and Polish (MA)
więcej podobnych podstron