
1
Basics of Field Geology
Rex A. Crouch

2
Copyright 2008 by Rex A. Crouch

3
Preface
This text addresses the basics of field geology for the amateur geologist
and prospector with the assumption that the reader has an introduction
to earth systems, mineralogy, petrology, and structural geology.
Observation and data collecting, using the transit compass, plotting
features on a map, and the geologic report are addressed herein.

4
Chapter 1 - Observing and Collecting Data
The purpose of field geology
Planning the field project
Taking field notes
Collecting hand samples
Chapter 2 - Using a Transit Compass and Global Positioning System
The transit compass
Taking a bearing
Strike and dip
Global Positioning System
Chapter 3 - Plotting Geologic Features on a Map
Color standardization
Symbol standardization
Preparation
The field map
The mapping story
Chapter 4 - The Geologic Report
Purpose of geologic reports
Report format
Target audience

5
Chapter 1 - Observing and Collecting Data
Purpose of Field Geology.
Field studies are the main
method of obtaining geologic
data. Field studies should have
a purpose, even if it be strictly
academic. The study may be as
simple as a single outcrop of
interest or an open pit quarry.
These
simple
studies
may
include a sketch, some digital
photos, GPS coordinates, making
notes on relations between
rocks, and/or collecting some
hand samples. Other field
studies
may
be
complex
requiring extensive time in the
field
utilizing
systematic
sampling methods of rocks, soil,
and even water with detailed
mapping
in
computer
applications.
Geologic
mapping
is
the
backbone of the field study and
is frequently referred to as field
geology.
Mapping
finds
relations between rocks and
other geologic interests. Despite
our advanced technology many
geologic features of importance
such as folds and faults can only
be found by geologists with their
boots on the ground, in the field,
mapping an area. Some ore
deposits may be found with
airborne geophysics but in
reality, few are, it is the
geologist in the field that makes
the discovery. Ultimately, maps
convey more than words ever
will.
Mapping comes down to the
observations at the individual
outcrops
as
being
the
fundamental principle of field
geology. The observation and
an interpretation is made, a
hypothesis is developed, and
tested by any means available.
The individual outcrop will be
the most rudimentary aspect of
mapping. As the map develops
complex relations are revealed.
Complex relations may occur
when multiple processes act
simultaneously
or
through
overprinting of multiple geologic
events. Sometimes geologic
features may be so complex that
no distinct conclusion can be

6
found. Upheaval Dome in
Canyonlands National Park is
believed to be a collapsed salt
dome by one camp of geologists
and a meteorite impact site by
another.
Other
complex
features are understood only
when detailed field mapping has
been
conducted
and
interpreted.
Planning the Field Geology Project.
Field projects have three phases:
Planning/Research
Observing/Mapping/Collecting
Reporting
While each phase leads into the next, the writing of the report should
actually begin during the planning and research phase.
Planning/Research – This is as
critical as the other two phases.
Here, the scope of the project
must be determined. One
specific location is identified and
purpose for being there is clearly
stated. Without a place and a
purpose the geologist becomes
a free-range chicken. The
research is also critical. A lot of
the work may have already been
completed
and
available
through aggressive research;
some field mapping may have
already been done and drill
cores with chemical assays may
be available. Judging the data
recovered from research may be
difficult.
Many
brilliant
professors and research teams
have been wrong on multiple
occasions. Sometimes the
original researcher simply wasn’t
objective. The world was
considered flat for a longtime,
then considered round, and now
we know that was wrong too.
Over time techniques and

7
technology change and allow
geologists to see datum under a
different light. Be prepared to
accept the researched data and
test it to ensure its validity.
Observing/Mapping/Collecting –
This phase is what geologists call
“Boots
on
the
ground.”
Outcrops are observed. The
rock
type
is
identified.
Distinctive items such as crystals
or
fossils
are
scrutinized.
Besides
the
fine
details,
geologists look for the obvious
such as slicken slides, big granite
boulders setting on top of mafic
bedrock, valleys or flowing
water bodies across the strike.
The primary school of thought is
to map what is in-place or
geologic bodies that are part of
the bedrock but what about that
huge granite boulder setting on
top of mafic bedrock. Some
geologists will annotate this
boulder on their maps as they
may encounter the granite
bedrock it originated from 10s
or 100s of kilometers away—this
is a great example of glacial
activity.
Taking Field Notes.
As
geologic
features
are
encounter they should be
annotate in the notebook. The
geologist makes the notes at the
location of interest to ensure all
data is properly collected. The
field notes complement the
geologic map and will serve as
the basis for writing the report.
Good notes are clear and do not
have unexplained abbreviations.
Sloppy abbreviated shorthand of
a geologist who made critical
observations
decades
could
leave the work done as useless.
The notes a geologists takes may
be
instrumental
in
the
development of
a
current
project or a project years or
even decades later. Geologists
develop systematic approaches
for taking notes ensuring all of
the datum are collected at each
outcrop or geologic feature
encountered. An example of
topics to cover:

8
Numeric that correlates the notes to the features drawn on the
map
Name of formation – if known
Specific location
Characteristics such as thickness
Name of rock
Description of rock – the description should also be systematic
addressing rock and mineral properties
o Color
o Type (igneous/sedimentary/metamorphic)
o Texture
o Foliation (as appropriate)
o Folds (as appropriate)
o Cleavage (as appropriate)
o Luster
o Hardness
o Streak (as appropriate)
o Magnetics (as appropriate)
o Luminance (as appropriate)
A sketch of the geologic feature may be made or a digital photo
taken. In either case, ensure that a ruler is included in the sketch
or photograph and annotate in the notes the orientation of the
image. Photographs using coins or local items for scale from the
country where the photo was taken lose meaning outside of that
country and locally even after time; pesos change size every year.
A ruler is a good scale because a centimeter is a centimeter
around the world.
A small insert map may also be prudent if macro view would add
value to the description.
If a hand sample is taken ensure the number identifying the
sample is annotated in the notes.

9
Collecting Hand Samples.
The reason for collecting hand
samples is to give the geologists
the opportunity to further
examine the rock at camp or in a
lab. Much more can be
discerned with Petrographic
polarizing microscope and even
more may be learned X-ray
crystallography
and
geochemistry testing.
Standardization of hand sample
collecting should be established
prior to going to field—subjects
to standardize are:
Numbering method - When multiple geologists are involved a
scheme to identify the collecting geologist is also of importance
The rough size of the collected sample
That is represents the formation as a whole
Marking orientation
Numbering method – The
numbering method for hand
samples should correspond to
the notes as closely as possible
and have a scheme for relating
the rocks to the study area.
Finding boxes of rocks in the lab
each labeled 1, 2, 3 will lack
meaning. If the samples are
collected at “Example Creek” a
possible
numbering
scheme
would be EC 2d. The letter “d”
may represent the 4
th
sample,
collected at outcrop “2”, at
“Example Creek.” The number
should be annotated with a
permanent marker. Whiteout
can be used on dark colored
rocks with the number placed on
the whiteout. Rocks with
phaneritic textures may simply
need to be bagged; a number is
later written on a label and
glued to the rock.

10
Size – Rocks with homogenous
matrices may be fist sized.
Rocks with large crystals or
coarse grains may warrant a
larger sample.
Representing the formation –
Taking one large pyrite crystal
would poorly represent the
limestone
formation
that
contained a few crystals. In this
case taking a hand sample of
limestone would be prudent and
of course take a representation
of
the
crystals
that
the
limestone contains.
Marking orientation – Rocks
having folds and foliations need
to have to have their orientation
annotated. Clearly mark which
side is up. If this is difficult mark
a band around the rock showing
the level line and annotate one
side as “TOP” and indicate the
bearing from when the rock fit
into the outcrop

11
Chapter 2 - Using the Transit Compass and Global Position System
Geology curriculums typically
contain to two summer field
courses but these courses have
seen changes through the years.
One of these courses was
dedicated to surveying and may
have included the use of an
alidade and the second field
course was geology. The
surveying course has been
removed from most geology
curriculums which was a tool
geologists could use to locate
themselves. This handbook will
introduce the Global Positioning
System or GPS and how to
employ it in concert with a
transit compass.
Transit Compass.
A transit compass includes a
magnetic compass, clinometers
(Long Level), and hand level
(Round Level) in one package.
The transit compass most widely
used by geologists today is
called the Brunton. The
Brunton we know and use was
designed by Canadian geologist
D.W. Brunton in the early
1890’s. Although the Brunton
Company makes a variety of
equipment, the word Brunton is
widely accepted to mean transit
compass.
12
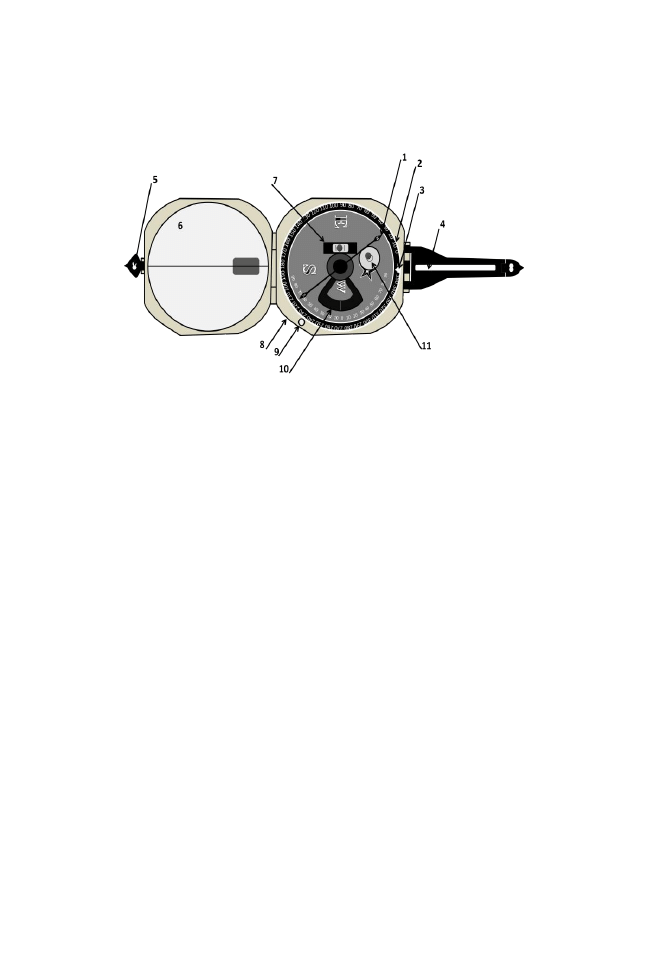
The various parts of the Brunton are depicted below.
1. Bearing Needle
2. Graduated Circle
3. Zero Pin
4. Large Sight with Peep Sight
5. Small Sight
6. Mirror
7. Long Level
8. Adjusting Screw
9. Lift Pin
10. Vernier
11. Round Level
Depressing the Lift Pin stops the
motion of the compass needle
and when the box is closed the
Lift Pin protects the needle. The
Round Level is used to level the
compass when taking bearings.
The Long Level is used to take
clinometers
(dip
angle)
readings—the lever on the back
of the compass manipulates the
Long Level. The dip angle
reading is made on the Vernier.
The Graduated Circle may be
moved east or west by turning
the Adjusting Screw and is
observed using the Zero Pin.
Because
true
north
and
magnetic north are not in the
same location, the compass will
have to be adjusted to point
toward true north; this will
change
from
location
to
location. The field maps used
will have a section called
“Declination”. The declination
states how many degrees east or

13
west the compass will point
away from true north. Turn the
Adjusting
Screw
until
the
graduated
circle
has
corresponds to the declination
on the map. In Maine the
compass will have to be
adjusted about 18 degree west
whereas in Washington the
compass will have to be
adjusted about 18 east. Along
the Mississippi River there may
be no need to adjust the
compass.
Taking a Bearing.
A bearing is the direction the
compass needle is pointing. In
geology there is a specific
format for reporting a compass
bearing—this report will never
be greater than 90 degrees. As
an example, if the bearing reads
35 degrees then the report
would be annotated as N35E. If
the bearing was 91 degrees we
must remember that the report
will never be greater than 90
degrees; subsequently a bearing
of 91 degrees will be reported as
S89E. The east and west
indicators on the compass seem
to be reversed however this
orientation assists in reporting in
the correct format.
There are many methods for
taking a bearing. The transit
compass may be mounted on a
tripod or alidade mount for the
greatest accuracy. In rugged
terrain the tripods can be very
cumbersome. The compass to
cheek method using the peep
sights is a fast method for taking a
bearing.
This handbook recommends the
waist
level
measurements
technique.
Ensure there are no metallic objects such as belt buckles that may
affect the compass needle
Open the compass housing to about the 2/3 point
Hold the compass at waist level
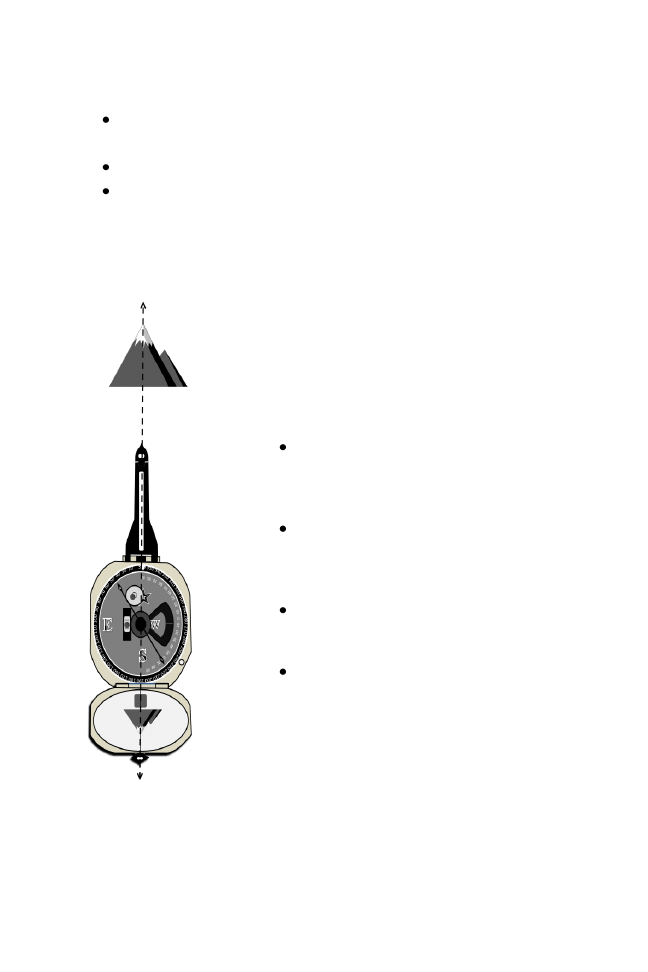
14
While looking down at the compass, sight the objective in the
mirror, ensure the system is level using the round level
Depress the Lift Pin locking the needle in place
Observe and record the bearing
In the following example:
There are four basic principles of geology
being:
Principle of faunal succession – This
principle is based on the observation
that fossils succeed each other in a
vertical manner
Principle of cross-cutting relationships
– Rocks that have cut through other
rocks such as dikes or sills are younger
than the surrounding rock
Principle of lateral continuity –
Sedimentary rocks extend laterally in
all directions
Principle of original horizontality –
Sediments that form sedimentary rock
are deposited horizontally

15
This final principle brings us to
strike and dip. Geologic
activities rarely leave rock in a
horizontal position and it is
critical for us to measure the
strike and dip to discern what
has happened at the site as well
as the region.
Strike and Dip.
Measuring the strike and dip of a
geologic feature uses all three
functions of the transit compass
being the magnetic needle,
Round Level, and Long Level.
The strike is found by placing the
edge of the compass against the
inclined rock and adjusting the
compass position until the round
level is center.
With the edge of the compass
flush to the rock and the round
level center observe and record
the bearing.
For this example the bearing is
N35E.
The dip angle will always be
orthogonal to the strike.
A trick for finding the strike is to
pour some water on the rock.
The water will flow in the
direction of the dip and the
strike is orthogonal as stated.

16
The dip is found by placing the compass flat against the rock orthogonal
to the strike.
Adjust the lever on the back of
the compass until the Long Level
is flat. Observe and record the
measurement seen on the
Vernier. For this example it is 45
degrees.
This may be written as N35E 45
This may also be annotated on a
geologic map with a long line
pointing toward N35E and an
orthogonal line pointing in the
direction of dip with the dip
angle annotated adjacent to the
symbol.

17
Global Positioning System.
The GPS is a ground based
receiver which uses a series of
satellite signals and triangulates
itself based on these signals.
There are two different varieties
of
GPS
units
being
the
commercial and the profession
version. The commercial version
is typically accurate to within 4 –
9 meters on the X Y axis and
about 15 meters on the Z axis.
The professional version is
accurate to within a meter on
the X, Y, and Z axis. This
accuracy is even further refined
with special antennas and base
units.
For
most
field
geology
applications a commercial unit is
adequate. When accuracy
becomes critical is when gravity
measurements will be taken.
Accurate gravity measurements
are dependent upon elevation
making the professional version
of the GPS essential.
Whether using the commercial
or professional version of a GPS
there
are
two
measuring
schemes- These are Latitude
and Longitude or Universal
Transverse
Mercator
UTM.
Latitude and Longitude uses
degrees, minutes, and seconds,
and is a projection of grid lines
on sphere. This results in
measurements being made with
degrees, minutes, and seconds.
The UTM system was designed
by the military and is a flat grid
based system. A flat system
becomes distorted in the Polar
Regions but warfare in the arctic
is unlikely. The system of
measurement
uses
zones
ranging
from
01
to
60
horizontally
and
letters
vertically. The letters “I” and
“O” were omitted as they could
be confused with numbers.

18
All GPS units have similar
features allowing the user to
select UTM or Latitude and
Longitude. UTM is used for
most applications today to
including modern geology tasks.
Most computer applications and
even maps use UTM. When
selecting UTM there are two
additional selections to be made
being the database and the
spheroid. Because the earth
does not remain stationary nor
is it a perfect sphere there are
different reference frames and
spheroid models in use. The
World Geodetic System (WGS)
allows us to define the Earth’s
reference frame. As we learn
more about the earth we update
the
reference
frame
and
spheroid models. Select the
most current WGS when setting
up the GPS unit. The earth is
not even a perfect oval; it has
varying degrees of roundness at
different
locations.
The
spheroid of Earth changes
locally. In the United States we
use North American Datum or
NAD 83.
A word of caution, because
there are so many different
coordinate systems available
from Range and Township,
Latitude and Longitude, State
Plane, and many variations in
UTM dependent upon the age of
the data and spheroid location,

19
geologists must ensure that any
data or maps used have been
converted
into
the
same
coordinate
system.
The
difference between UTM NAD
27 and UTM NAD 83 may be on
the order of 10s of meters
dependent upon location. A
failure to ensure the correct
spheroid is in used compounded
by a commercial GPS unit’s
potential error of 4 – 9 meters
could become a significant
distance.
Another important function of
most GPS units is the ability to
establish Way Marks. Geologists
mark important locations on
their GPS units and enter
detailed data about the location.
Good geologists also ensure that
data and location of any
observation is entered into their
geology notes.

20
Chapter 3 - Plotting Geologic Features on a Map
Color Standardization.
Maps used in the field for
documenting geologic features
and referred to as base maps or
geologic maps. Other map types
may show drainage which are
called planimetric maps. Culture
maps show manmade features
and topographic maps show
contour.
Some people prefer to use
topographic maps as their base
map. As a benefit of this
method, the user will have
reference points such as roads,
trails, and topography. The
drawback is that it convolutes
the data collected making the
map difficult to read. This
handbook recommends grid
paper for mapping. Grid paper
may also be found in a water
resistant variety.
To limit the size of the legend
geologists use accepted geologic
symbols and colors. The
following
represents
the
accepted color coding for rock
ages as presented by the USGS:
Precambrian
RGB 178/134/83
Archean RGB 153/173/172
Eoarchean
RGB 128/144/144
Paleoarchean
RGB 153/151/145
Mesoarchean
RGB 203/205/200
Proterozoic
RGB 204/216/145
Paleoproterozoic
RGB 179/178/94
Mesoproterozoic
RGB 221/194/136
Neoproterozoic
RGB 202/165/149
Tonian
RGB 203/164/108
Cryogenian
RGB 220/171/170
NeoproterozoicIII
RGB 234/216/188
Phanerozoic
RGB 179/226/209
Paleozoic
RGB 128/181/213
Cambrian
RGB 251/128/95

21
Ordovician
RGB 249/129/166
Silurian
RGB 177/114/182
Devonian
RGB 153/153/201
Carboniferous
RGB 153/189/218
Permian RGB 103/198/221
Mesozoic
RGB 127/173/81
Triassic
RGB 103/195/183
Jurassic
RGB 77/180/126
Cretaceous
RGB 127/195/28
Cenozoic
RGB 225/225/0
Paleogene
RGB 255/179/0
Neogene
RGB 253/204/138
Quaternary
RGB 255/255/77
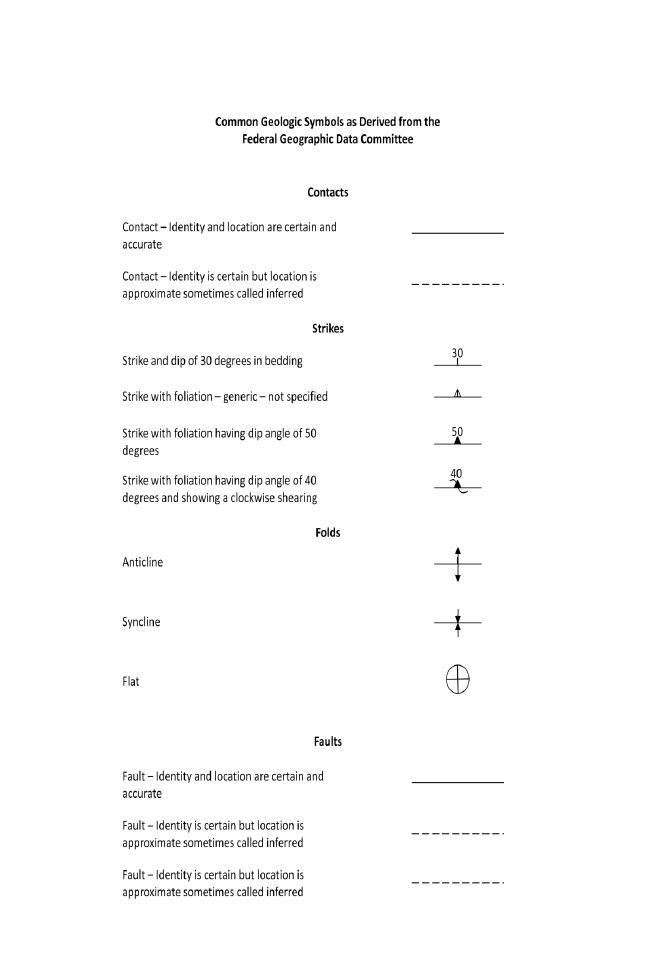
Symbol Standardization.
The following page presents some of the most commonly used geologic
symbols. A complete list may be derived from the Federal Geographic
Data Committee which standardizes all geologic symbols.
22

23
Preparation.
Before mapping, the geologist conducts a walkthrough of the selected
area.
The geologist looks for and finds
any general trend in the strike.
The purpose of looking for a
trend in the strike is to assist the
geologist in establishing traverse
lines. Traverse lines are straight
lines that traverse the working
area in a parallel manner. The
traverse
lines
should
be
perpendicular to the general
trending strike if there is one.
This will reveal as much geology
as possible during the mapping.
Simply following the trend of the
strike would be boring. For
small areas, geologists may
simply walk the area but for
large detailed projects it may be
necessary to emplace stakes at
the beginning and end of each
traverse line and run a line
between the stakes. The
distance between the lines
depends on how much accuracy
is needed as well as the visibility
between the lines. In wooded
areas, traverse lines may be as
close as 5 meters apart. The
geologist is not locked into
walking on the line; this is a
guide to ensure the area is
properly studied.
The geologist should be equipped with at least the following items:
Transit compass
GPS
Grid line paper
Number 2 pencils
Marker
Protractor
Clip board
Pocket knife
Hand lens
Rock hammer
Eye protection
Sample bags
Backpack

24
Adequate food, water, sun screen, insect repellent, flash light, extra
batteries for everything, and rain gear should also be available.
In the example map on the
following page, the geologist
found that there is a trend in the
strike of N54E during the
walkthrough. Because of this
traverse lines were ran N36W to
ensure they were perpendicular
to the trend of the strike. If a
trend was not found it is
reasonable to conduct traverse
lines in a grid.
The field map should have the minimum information:
Map name – should be
related to the area of study
Person developing map
Purpose of the study
Date
Legend
Scale
North arrow
While mapping, the geologist carefully draws each geologic feature and
annotates it with a number. This number corresponds to the notes and
samples taken.

25
The Field Map.

26
The Mapping Story
The geologist begins in the northwest corner of the mapping area and
proceeds southeast along the A to A’ route as shown on the map- This A
to A’ line is not really a route but a line drawn on the map by the
geologist that is orthogonal to the general strike of the geology and will
be used in the lab to visualize the subsurface geology. The geologist first
finds a schist outcrop. Pulling a slightly rusted rock hammer from its
sheath, the geologist looks for and finds a section of rock that may be
easily removed. Hitting the outcrop several times sent a sharp piece of
rock up and into the air; a subtle reminder to put on the safety glasses.
Removing the sample and examining it through a hand lens revealed tiny
garnets that had been sheared in a counterclockwise direction. This was
interesting. The geologist labeled the sample “FMN 1a” to mean “Field
Map Name”, outcrop 1, “a” being first sample from outcrop 1. Because it
was a foliated rock with some folding the geologists carefully put the rock
sample back on the outcrop and marked its orientation so the foliation
and folding could be understood when the rock was returned to the lab.
After the specimen was properly marked and documented in the note it
was safely bagged. The uneven surface of the foliated rock was difficult
to take a strike a dip on. At last, a small section was found smooth
enough for the task. Thinking, “Am I a pretzel or a geologist?” The
geologist had to contort to new forms to read the dip angle on the
Vernier. The notes were begun with “1. Schist outcrop - Green colored
metamorphic rock with a greasy luster bearing garnets 2 mm in diameter
exhibiting counterclockwise shearing. The garnets are spaced
sporadically. The sample shows a gentle2 cm folding with a regular
rhythm orthogonal to the foliation. Strike and dip is N54E 25.” The
location from where the sample was removed was observed with the GPS
and also recorded in the notes. After finishing the note, the geologist
thumbed through several screens on the GPS to the Way Marks. A way
mark was entered on the GPS itself; this would later be downloaded to a
computer. While scrolling through the screen keyboard the battery low
screen came on. Business as usual; a couple of minutes were spent

27
changing the batteries. The outcrop was paced off several times and
while setting on the outcrop, the geologist drew a scale drawing of the
outcrop on the geologic map and labeled it with “1”. Then using a
protractor the geologist made a line on the map to represent the N54E
strike, a triangle for the foliation was added to the symbol and the dip of
25 was written. Thinking for a couple of minutes which way to put the
swirl to show counterclockwise motion in the shear the first outcrop was
complete.
Walking just one more meter the geologist encountered another
outcrop. This was a basalt outcrop, about 1 meter high and somewhat
flat on the top. Once again a sample is sought. Finding a suitable piece
and striking it with the hammer sent the tool recoiling and vibrations up
the arm. Yeap, this was a much harder rock. More effort was involved in
freeing the sample. The sample was examined under the hand lens,
bagged, and labeled. The geologist climbed on top of the rock. The
heavy lugged boats clung to the rock as it was ascended. From atop the
outcrop it was observed that the basalt had a general trend but stopped
in the southwest direction, off set, and began again. Thinking, “How odd,”
taking a compass bearing in each direction, a GPS reading, and pacing the
outcrop off, the geologist was able to accurately draw the outcrop on the
map. A note was also entered. “2. Basalt outcrop protrudes from
ground about 1 meter. Black dark grey aphaneritic igneous rock. Has a
uniform body that trends N54E. The outcrop stops, off sets, and begins
again in the southwest.” The coordinates of the sample were
documented on the sample bagged, and annotated in the notes.
Climbing down off the rock was much easier then climbing up and within
a meter the geologist encountered another outcrop. Examining the
outcrop closely showed that it was the same schist as seen before. It had
same gentle folding and the garnets were the same size. While pacing off
the outcrop to annotate it on the map the geologist found that the
outcrop is in contact with a banded iron outcrop. This is exciting, the
geologists starts to draw conclusions about the previous environment

28
where the rocks formed, imagining a sea floor near the end of the
Precambrian but the geologist stopped. Think, “I haven’t learned enough
about the area to start drawing conclusions." The banded iron outcrop
looked rather ugly with the red oxidation coating. A lot of effort was
involved in collecting a sample. The rock that ultimately separated from
the outcrop was much larger than wanted but after examining it under a
hand lens it was found to be a gem worth weighting down the backpack.
Silver to black colored banded iron with metallic luster and narrow bands
of chert with waxy luster. Small vugs containing various metallic crystals
demanding further examination under a microscope with some calcite
and a larger vug was also present containing dark grey botryoidal iron.
The sample was labeled as “FMN 3a” and a detailed note was lovingly
entered for this metallic specimen. As banded iron is a sedimentary rock
a dip angle was sought. While taking the strike a lot of care was taken to
ensure the metallic content of the rock did not disturb the compass
bearing. Moving the compass closer and closer to the rock did not
change the bearing. This probably indicated that there was little to no
magnetite in the banded iron. The strike and dip were found to be N54E
25. This and the UTM coordinates were also entered into the notes.
While sitting on the outcrop and drawing it to scale on the map sheet the
mosquitoes insisted that the geologist should feed them. Applying some
repellent seemed to serve as a restraining order as they buzzed around
the face and ears but didn’t land. This was a low point in the topology
and there was some standing water between here and the next outcrop.
Moving through the smelly stagnate water the geologist came to the next
outcrop some two meters away. This was the same banded iron except it
was dipping in the opposite direction. This meant that the area of
standing water was obviously the low point in a syncline and the top of
the basalt outcrop was probably an anticline. Although there was an
urgency to move away from t he mosquito breeding ground the geologist
mapped the outcrop with as much care as the previous outcrops—and
then moved out quickly. The geologist continued to move along the A to
A’ route carefully mapping another basalt outcrop of equal in height to
the previous basalt outcrop, another schist outcrop, and another banded

29
iron formation. There were three additional outcrops to the east side of
this traverse and all three were inferred with dotted lines to connect to
those mapped on the traverse.
The two segments of basalt that were disconnected and offset needed a
closer examination. The geologist found that each of these two segments
of basalt were about the same thickness as those mapped on the traverse
and seemed to be the same rock. Each was found to be about a half
meter shorter in elevation than the basalt outcrops to the east and their
offset was about 1.5 meters trending S36W. Both were accurately
mapped. The geologist was confident that this was a left lateral slip fault.
Drawing it on the map and labeled it as “4” there was a personal tug of
war as to whether the fault could be continued to the southeast on the
map even though there was no visual evidence to support that it had
continued to fault. Ultimately the geologist continued the fault on the
map but annotated it as inferred and labeled it as “5.” The fault was
described in the notes and the reasoning why it was believed to be a fault
were carefully detailed and why the other segment was presented as
inferred was detailed.
As the tops of the basalt were relatively flat they were given geologic
symbols showing them as flat. The geologist also believed that the two
basalt outcrops were dikes but represented the hinge of two anticlines—
the dikes were possibly the cause of the syncline between them.
The geologist stopped for lunch and reviewed the field notes and the
map. After enjoying a sandwich the geologist crisscrossed the area to
ensure nothing was missed. All outcrops were mapped. A good rock
sample was obtained, labeled, and entered into the notes at each
outcrop. The geologist was already mentally preparing the geologic
report.

30
Chapter 4 - The Geologic Report
Without a report, all of the
effort the geologist puts forth in
the field is lost. It is much more
than simply writing a report, the
observations made and the data
collected
must
convey
information in a meaningful
manner. Scientific Technical
Communication are keywords in
writing for all fields of science.
This field of writing requires the
document to communicate.
Purpose of Geologic Reports.
The purpose of the report was
predefined when the geologic
project was planned. The
purpose
may
have
been
academic or required in support
of an engineering or mining
project. Geologic reports have
many purposes and no one
purpose is better than the other
however the purpose may
dictate an emphasis. There may
be special emphasis on metallic
minerals or on salt. Other
projects may focus on faults to
help discern the structural
integrity of a possible waste
disposal site.
Report Format.
Presentation does matter. The
presentation of the report
matters as much as the accuracy
of the content. The data, tables,
graphs, diagrams, photographs,
and maps should be presented
throughout the report.
The
format
should
be
established during the project
planning. Having the format
established during the planning
phase allows the geologist to
focus on subject material in field
that is relevant to the purpose.
The format is not to be taken for
granted. The geologic report
may be just a small part of a
much larger presentation. The
source requiring the report may
have a predetermined format,
specific font choice, preference
in the paper’s weight, and even
what media will be used to
convey the report.

31
The following is offered as a guideline if no format is defined:
Title of Project
Name of Geologist(s)
Date
Abstract
1)
Introduction
a) The Project’s Purpose
b) Geographic Location
c) Methodology Used
2)
Local Geology
3)
Regional Geology
a) Rock Unites
b) Fossils
c) Lithology
4)
Structure
a) Faults
b) Folds
c) Unconformities
5)
Summary
6)
References

32
Target Audience.
Target Audience is a term that
applies to Scientific Technical
Communication and means who
the document or report is
prepared for. In some aspects
target audience analysis is nearly
a field of science of its own.
Here teams identify the target
audience’s
vulnerabilities,
susceptibilities, and even what
forms of media the target
audience best relates. The
target audience may be a team
of geologists, other scientists,
venture capitalists, executives,
or even politicians. The
document or report prepared
should be for the specific target
audience—the people who will
be reading the report and
making decisions. There are
large cumbersome dictionaries
dedicated to the field of
geology. There is probably no
other field of science that
fabricates so many complex and
entirely unnecessary words. If
the target audience is not a
group of geologists the use of
geologic terms prevents the
document from communicating
the content to the reader. Many
reports ultimately end up in
presentations for executives or
politicians who have to make a
decision on whether a project
will be funded or not. Ensure
the report communicates to the
reader. If necessary develop
more than one report, one that
serves as a presentation that
anyone can understand and
another made available for
those who understand the
jargon of a particular field of
science and want detailed
information that may bore
someone else. It has been said
here once but cannot be
overstated,
presentation
matters.

33
Bibliography.
FGDC Digital Cartographic Standard for Geologic Map Symbolization, 2008
USGS Color Code, 2005
Manual of Field Geology, Compton, 1962

34
Wyszukiwarka
Podobne podstrony:
Basics of Assembler
Basics Of Hacking 2 VAXs
Field Geology Lecture I
2 Basics of Fiber Optics
Basics Of Hacking 3 ?ta
Basics Of Hacking Intro
Basics Of Hacking 1 ?Cs
SHSBC207 BASICS OF AUDITING
BASICS OF ENVIRONMENTAL CHEMISTRY lab no2
Basics of the Coaching Relationship
v ray basics of the render settings part 4 of 5
Basics of management for BSF
BSF Basics of Accounting Case 10
S Narasimha Rao Basics of Panchanga 2005
How To Draw Manga Basics of Hair, Eyes, Super Deform, Photoshop Tips Characters Mangazeichnen
Basics of Quantum Computation part 1 E Rosinger (1994) WW
Basics of Companies
więcej podobnych podstron