pim pm ye a.co m
http://www.pimpmyea.co m/futuro fx-users-manual/
FuturoFX Users Manual
FuturoFX Indicator
The “FuturoFX Spread” indicator is a sophisticated correlation engine that is able to show a projection
about f uture price action, based on the correlations identif ied in the history. It works on any timef rame
and on any f inancial instrument (currency pair, commodity, f uture contract) that is available on a MT4
platf orm.
Installation
The installation process:
1. Copy the “Cerbero.dll” f ile into the “experts/libraries/” f older of your MetaTrader 4 installation.
2. Copy the “FuturoFX.ex4” f ile into the “experts/indicators/” f older of your MetaTrader 4
installation.
3. Restart the Metatrader 4 platf orm.
How FuturoFX Works
It is important to understand the basic principles behind the large amount of calculations perf ormed by
FuturoFX. FuturoFX looks at the last N bars on your chart (let’s call them a “recent history block”, or
RHB) and then goes back in the past f or analyzing all past sequences that are N bars long (let’s call each
of this sequences an “old history block”, or OHB). Theref ore FuturoFX compares 1 RHB against multiple
OHB. This “comparison” is a mathematical computation called “correlation“. The correlation basically
measures the extent of correspondence between two arrays of numbers. The result of this mathematical
computation is a number between -100 (maximum inverse correlation) and +100 (maximum positive
correlation). When the correlation is above a threshold like 70/80 you would easily say that RHB and OHB
are “similar”, like in the example below (OHB on the lef t and RHB on the right):
When the correlation is below a threshold like -
70/-80 you would say again that RHB and OHB
are similar, however they are just specular, like
in the example below (OHB on the lef t and RHB
on the right):
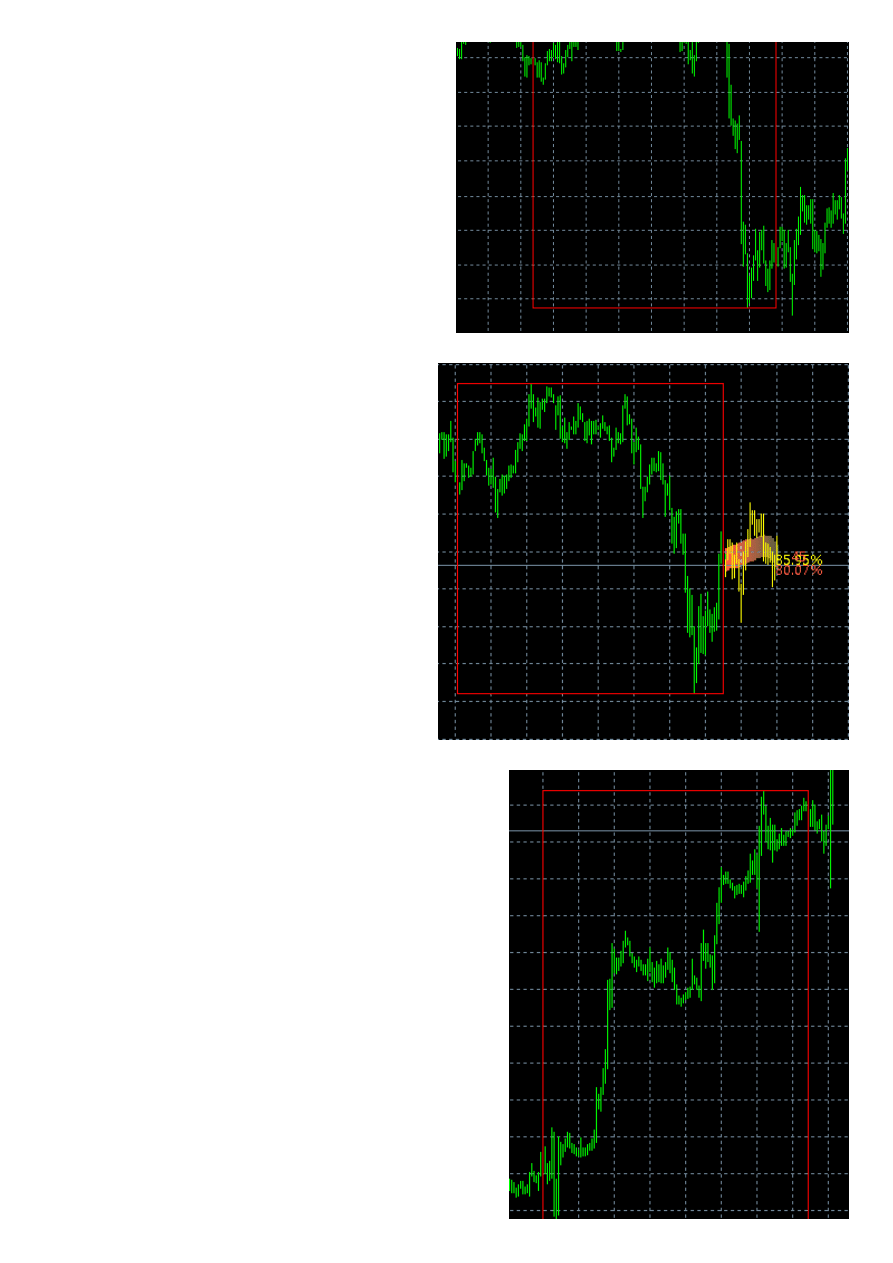
on the right):
FuturoFX by def ault looks only f or strong
positive correlations between RHB and OHB.
However the user can also change the settings
in order to take into account both positive and
negative correlations.
Usually FuturoFX f inds a number of OHB that
show a “good” correlation with RHB. The next
step is analyzing the M bars just af ter each
OHB (let’s call each of them OHB_f uture), in
order to build a projection of M bars in the
f uture of RHB (let’s call it RHB_f uture). The
average of the best OHB_f uture sequences is
shown by FuturoFX in a coloured trail (red
tomato by def ault), while the absolute best
OHB_f uture sequence is shown by FuturoFX
as a sequence of bars (yellow by def ault).
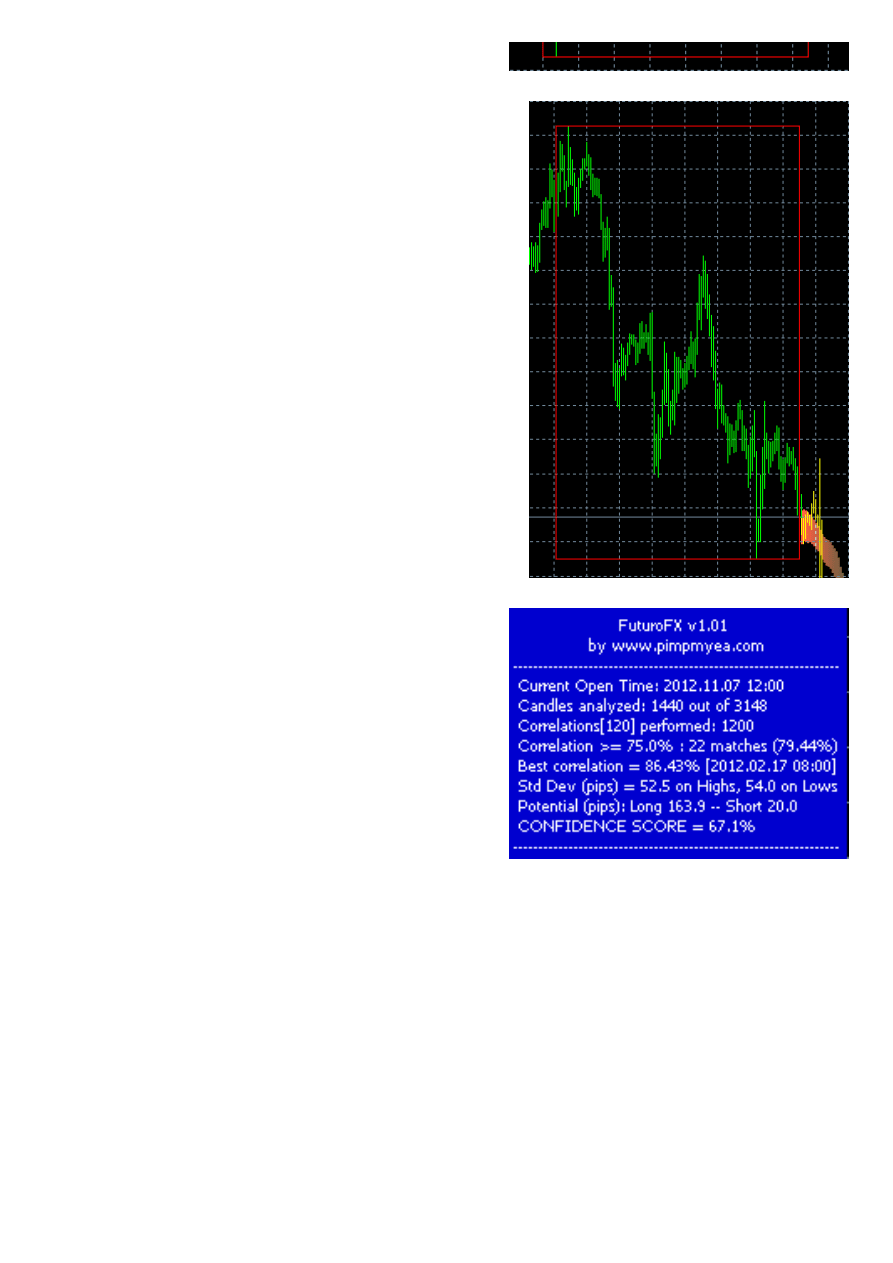
Textual interf ace
FuturoFX comes with a detailed textual
interf ace that can be enabled/disabled by the
user. When it is enabled, the textual interf ace
is displayed on a blue background that gets
brighter when the average correlation
approaches +100.
The interf ace changes with each new
incoming bar. Here is the exact meaning of
each row f rom top to bottom:
- the Indicator name (FuturoFX) and version
number (f irst released version is v1.00)
- a copyright notice (www.pimpmyea.com)
- the open time of the last bar displayed on
chart (this is usef ul when setting FuturoFX
to take screenshot automatically – please read the
“Options” section f or understanding this important
f eature)
- the number of candles analyzed in the past with
respect to the whole history available on MT4 (the
user can also make FuturoFX to analyze the whole
history)
- the number of correlation perf ormed (number of OHB
in the analyzed history) and the length of each history
block between square bracktes
- the number of correlation matches above the
threshold, and their average value between brackets
- the number of correlation matches below the
negative threshold, and their average value between
brackets (this line is displayed only if the user selects
also negative correlations)
- the best correlation match identif ied in the past: both
the correlation value and the time in the past when this
match occurred (between square brackets) are
reported
- the standard deviation on the High and Low values of
the colored trail displayed by the indicator (this line is
displayed only if the user wants to display STD
inf ormation on chart)
- the “prof it potential” of long and short trades, based on
the dif f erence between the Open price of the last candle
and Highest High and Lowest Low of the “Best
Projection”
- a “Conf idence Score” which is a measure of how good
the projections in the f uture should be considered
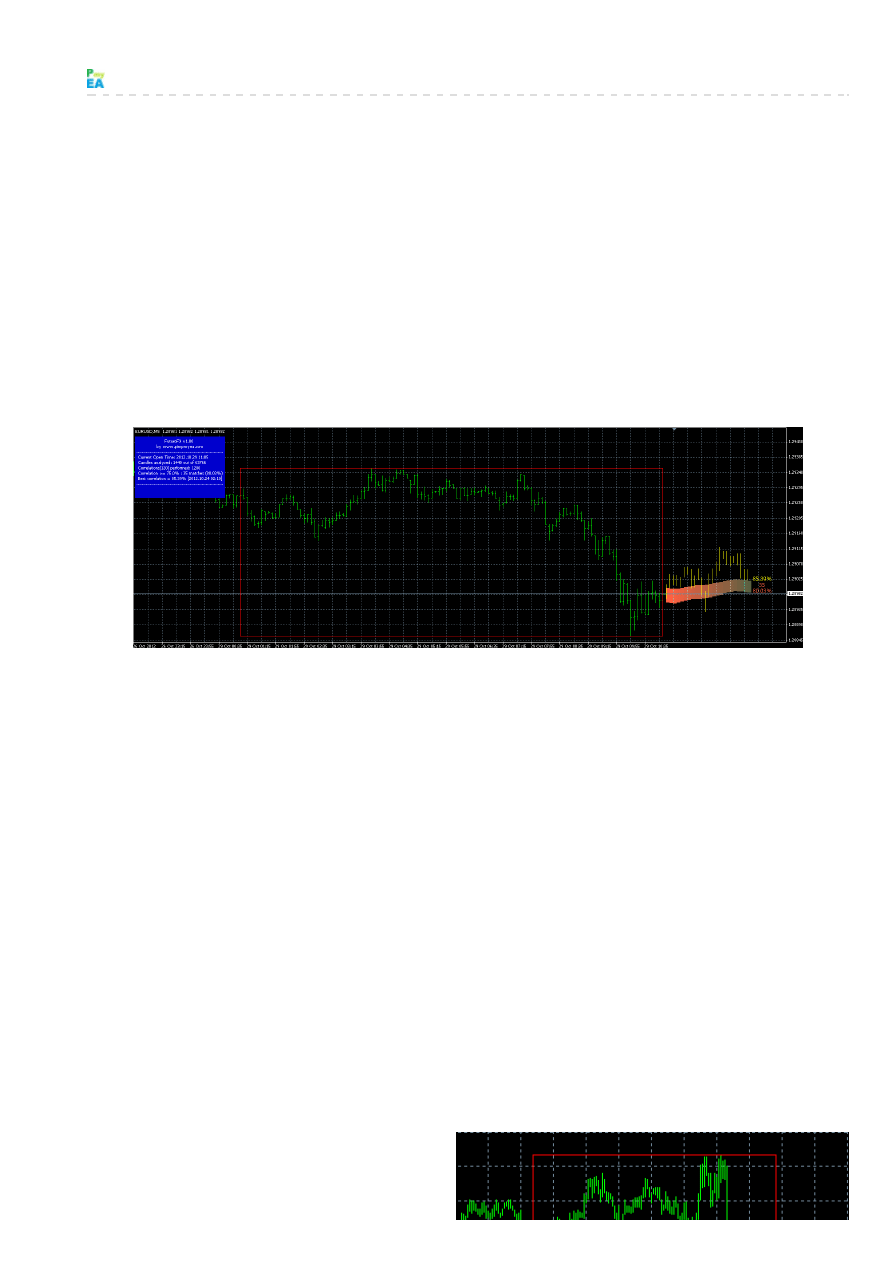
Main Visual Elements: Rectangles,
Average Projection, and Best Projection
Three visual elements of FuturoFX that are enabled by
def ault are “Rectangles”, “Average Projection” (the
colored red tomato trail) and the “Best Projection” (the
sequence of yellow bars).
The picture above shows the red Rectangle delimiting RHB (the “Recent History Block”), and scrolling
back the chart we can also f ind another red Rectangle delimiting the OHB (an “Old History Block”) with
the best correlation match.
The picture also shows a red tomato trail which is the “Average Projection” along with two numerical
inf ormation associated to it: an integer number and a percentage. The integer represents the number of
matches taken into account f or calculating the Average Projection. The percentage is the average
correlation score of this projection. Usually the higher these numbers the better, because the projection
in the f uture is more reliable.
Finally the picture above also shows a series of yellow bars which f orm the “Best Projection”, along with
a percentage which represents the correlation score of the “best match”.
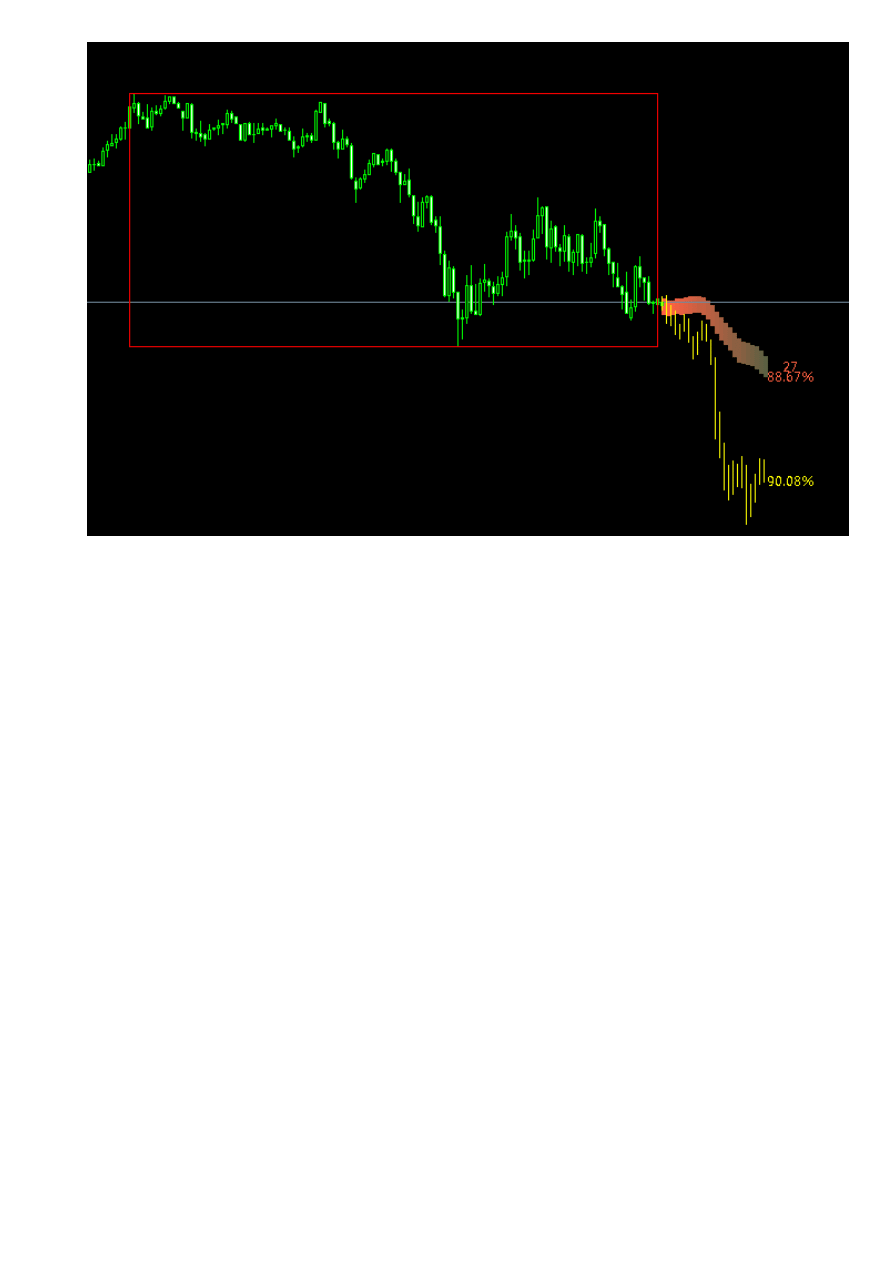
Secondary Visual Elements: Barycentres, Standard Deviations, and Outliers
Other three visual elements of FuturoFX can be enabled by the user: “Barycentres” , “Standard
Deviations”, and “Outliers”.
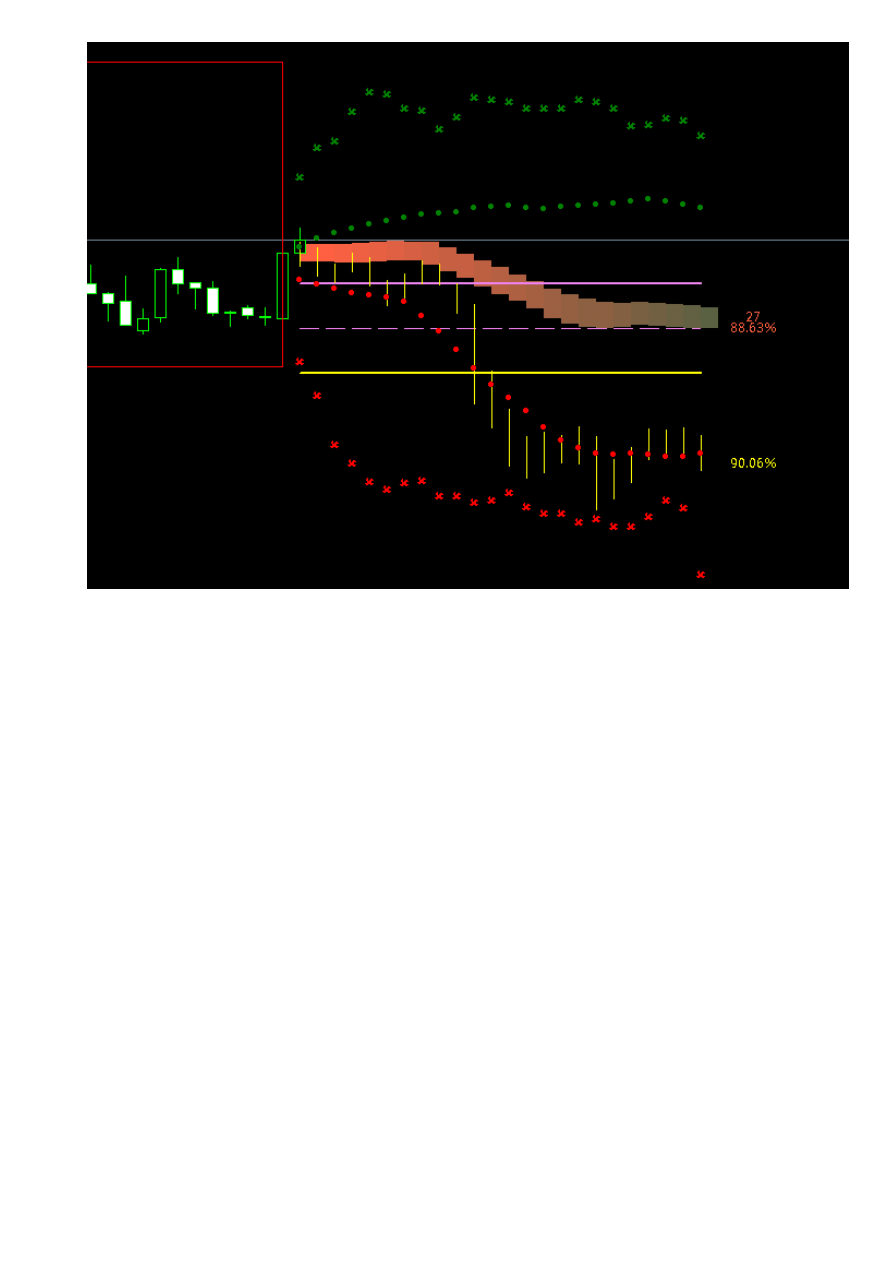
The secondary visual elements should be used only by traders who have already some experience with
the basic f eatures of FuturoFX, otherwise they may be just conf using.
The three horizontal lines are the “Barycentres”: the solid violet line is the “center of mass” (or average
value) of the “Average Projection”, the solid yellow line is the “center of mass” of the “Best Projection”,
the dashed violet lines is exactly half -way between the two previous lines. You can consider the space
between the violet and yellow solid lines as a “channel”. Usually when price is outside the channel and
above it, it can be worth looking f or short trades. When price is outside the channel and below it, it can
be worth looking f or long trades. In both cases the dashed line can be considered a conservative take
prof it level.
The green dots represent a Bollinger Band calculated on the upper line of the Average Projection. The
red dots represent a Bollinger Band calculated on the lower line of the Average Projection. The closer
these dots are to the red trial the better, because it means all f uture projections strongly agree among
them, theref ore the Average Projection can be considered pretty reliable.
Finally the green and red crosses represent “Outliers”, which are the most extreme Highs and Lows that
FuturoFX detected in the past among the selected correlations. These extreme values can warn the
trader about the most violent price excursions that happened in the past (and may happen in the f uture
as well).
How To Trade with FuturoFX
FuturoFX can f it many dif f erent trading styles. Since it works on any f inancial instrument and on any
timef rame it is a very f lexible tool f or trading virtually any market. The most simple use of FuturoFX is as
a leading indicator that you can integrate in your current trading toolbox. You can use the projections
shown by FuturoFX as additional f ilters in your trading plan, or as your main trade signals.
We f ound at least three ways of trading that rely on FuturoFX as the main (and possibly only) trigger f or
entering trades:
1. scalping
2. end-of -day trading
3. binary options
Here is the basic trading logic f or using FuturoFX as a manual scalping tool (
):
keep FuturoFX opened on two timef rames (e.g. M5 and M30)
make sure the “average projection” and “best projection” on both timef rames are in agreement
if current price is still “low” compared to a bullish projection, then you can consider entering a
Long trade
if current price is still “high” compared to a bearish projection, then you can consider entering a
Short trade
place the take prof it taking into account the projection and relevant support/resistance areas
you can spot in the last f ew bars
if FuturoFX drastically changes its outlook, you should modif y the take prof it or close the trade
Here is the basic logic f or using FuturoFX as an end-of -day trading tool (
):
open two FuturoFX charts around 00 GMT each day: H1 and H4 timef rames
make sure the “average projection” and “best projection” don’t look messy on either charts
determine if the projections on the two charts show “some agreement”
if you can f igure out the probable price pattern f or the next day then enter a pending order with
f ixed SL and TP and with expiry 24 hours later
in f ew cases (“strong agreement” beteween charts) a market order is required instead of a
pending order, but always with f ixed SL and TP levels
SL and TP must be placed according to both price action suggested by FuturoFX and relevant
support/resistance areas
when you open the trading platf orm the next day at 00 GMT you should close the trade f rom the
day bef ore, if it is still open; then you can look at the H1 and H4 charts f or deciding the next trade
do not enter any trade if the charts look messy and you cannot f igure out the probable price
action f or the next day (usually you’ll enter only 2 or 3 trades per week)
Regarding binary options, honestly we are not experts in this f iled, however FuturoFX seems like the
perf ect ally f or “High/Low” trading. The High/Low method of trading binary options is a straightf orward
speculative position taken by the trader, who determines if the f uture market price is above or below the
current strike price. The trader will experience a gain or a loss based on the prediction of whether or not
the price is higher or lower than the entry price. This is exactly the kind of prediction that FuturoFX has
been built to answer f or. Many brokers provide “1 hour” binary options that can be traded throughout the
day
Options
email ()
this f ield must contain the email address used f or the transaction f or buying the indicator, otherwise it
will not be able to authenticate and it will display an “Authorization f ailed” message on chart.
look_back (120)
this is the number of bars in each history block that FuturoFX uses f or computing correlation.
look_forward (24)
this is the number of bars “in the f uture” displayed by FuturoFX with the “Average Projection” and “Best

Projection”. Beware: the higher this number the less reliable the prediction on the bars that are most
projected into the f uture.
max_history (1440)
this is the max number of bars that FuturoFX examines in the history when computing correlations. If
max_history=0 then FuturoFX takes into account the whole history available on chart.
correlation_data (“OHLC”)
these are the data used by FuturoFX when computing correlations. The def ault value “OHLC” means that
FuturoFX actually perf orms 4 correlations at the same time on Open, High, Low, and Close data, and
then it makes an average of these f our correlations. The user can choose any combination of data (the
order doesn’t matter): O=Open, H=High, L=Low, C=Close, M=Median, T=Typical, W=Weighted. As an
example correlation_data = “HLT” means that FuturoFX will perf orm 3 correlations on High, Low, and
Typical data.
cor_threshold (75)
this is the threshold set f or correlations. Only correlations above this threshold are taken into account
by FuturoFX f or computing the “Average Projection”. If the user sets a negative number (e.g. -75)
then FuturoFX will look f or both strong positive and strong negative correlations.
select_best_correlations (50)
this is a f urther f ilter on the OHB sequences selected by FuturoFX f or computing the “Average
Projection”. The def ault value (50) means that only the 50 best correlation matches are taken into
account f or computing the ”Average Projection”. This f eature is disabled when selct_best_correlations =
0: in this case ALL correlations matches above the threshold are taken into account.
display_options (“TABR”)
this f ield represents the textual and graphical output of FuturoFX. The def ault value (“TABR”) means
that FuturoFX will display the Textual Interf ace (“T”), the “Average Projection” (“A”), the “Best Projection”
(“B”), and the “Rectangles” (“R”). Other available options are “Barycentres” (“C” like “Center of Mass”),
“Standard Deviations” (“S”), and “Outliers” (“O”). The user can select any combination of options (the
order doesn’t matter). As an example display_options “ABC” means that FuturoFX will only display
“Average Projection”, “Best Projection”, and “Barycentres” (and no Textual Interf ace).
avg_projection_color (Tomato)
this is color of the graphical element “Average Projection”.
best_projection_color (Yellow)
this is color of the graphical element “Best Projection”.
text_size (10)
this is the size of text associated to the graphical elements”Average Projection” and “Best Projection”.
text_font (“Segoe UI”)
this is the f ont of text associated to the graphical elements”Average Projection” and “Best Projection”.
window_screenshot (“0″)
the def ault value “0″ means that FuturoFX does not take any screenshot of the current chart
automatically. When “1″ FuturoFX takes a new 1024×768 pixels screenshot of the current chart at each
new incoming bar. The f ile is placed in the “experts/f iles/” f older of the MT4 installation with a name like
“FuturoFX/EURUSD_M5/EURUSD_M5_2012-10-29_0950.gif ” (this is a screenshot taken at 09:50 of the
29th October 2012 on a EURUSD 5 minute chart). The screenshots are automatically organized into
subf olders. If window_screenshot = “4″ then a screenshot is taken automatically each 4 bars, and so on.
The user can also put a string like window_screenshot = “H13″ and that means a screenshot is taken
each time the last incoming bar is a 13 GMT.
A f urther option is the dimension of the image in pixels. As an example window_screenshot =
“2;1000;700″ means that a 1000×700 pixels screenshot is taken each two bars.
Since FuturoFX cannot display inf ormation in the past, taking screenshot is a convenient way of keeping

trace of how it behaved during the trading day.
Document Outline
Wyszukiwarka
Podobne podstrony:
blizzer generator pradu users manual
07 Altivar11 A EU users manual
linux mandrake 8 1 users manual 3zyndeyhqooqyui2gqfop2orb3fn25dkbzr4wei 3ZYNDEYHQOOQYUI2GQFOP2ORB3FN
OP COM 081016 user manual
universal remote control 8 in 1 users manual 121714
MJoy16 C1 Users Manual v1
G Wiz MC Users Manual 1 1
USERS MANUAL
07 Altivar11 A EU users manual
OP COM 081016 user manual
ebooks de volkswagen transporter 1980 service manual (osiol net) www!osiolek!com L2MGLGLNG46LHEIWGVH
http, www sweex com download php file= images artikelen LW050V2 Manuals LW050V2 manual pol
Manuale z Op Com i nie tylko
Manual Vag Com
Manuale z Op Com i nie tylko
AJA1500 Manual magnetron [Rexonavn Com]
więcej podobnych podstron