Introduction
During the experiment I examined the formation of stress concentration, near the hole in the plate, that was under the load P.
We know that in case of irregularity of shape (places where cross-section area changes) one observes local concentration of stress. Such places (i.e. holes, threads) are so-called notches.
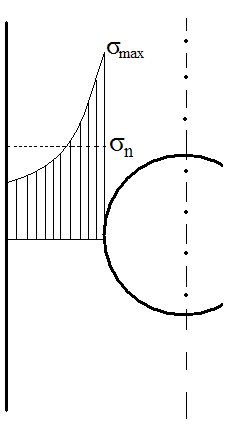
The local increase of stress, caused by notch, contributes to the drop of fatigue strength. The measure of the increase in strength is the shape factor αk:
αk=σmax/σn
where: σmax - maximal stress in the area of stress concentr.
σn - nominal stress, calculated for the same are with the use of typical strength formulae, which don't take stress concentration into account
The aim of experiment was to:
Get familiar with the phenomena of stress concentration.
Observe with the usage of polariscope, how stress grows in the areas near notches.
Measure stress in notch area (hole in the plate) an determine shape factor αk based on measurement results.
Description of experimental stand.
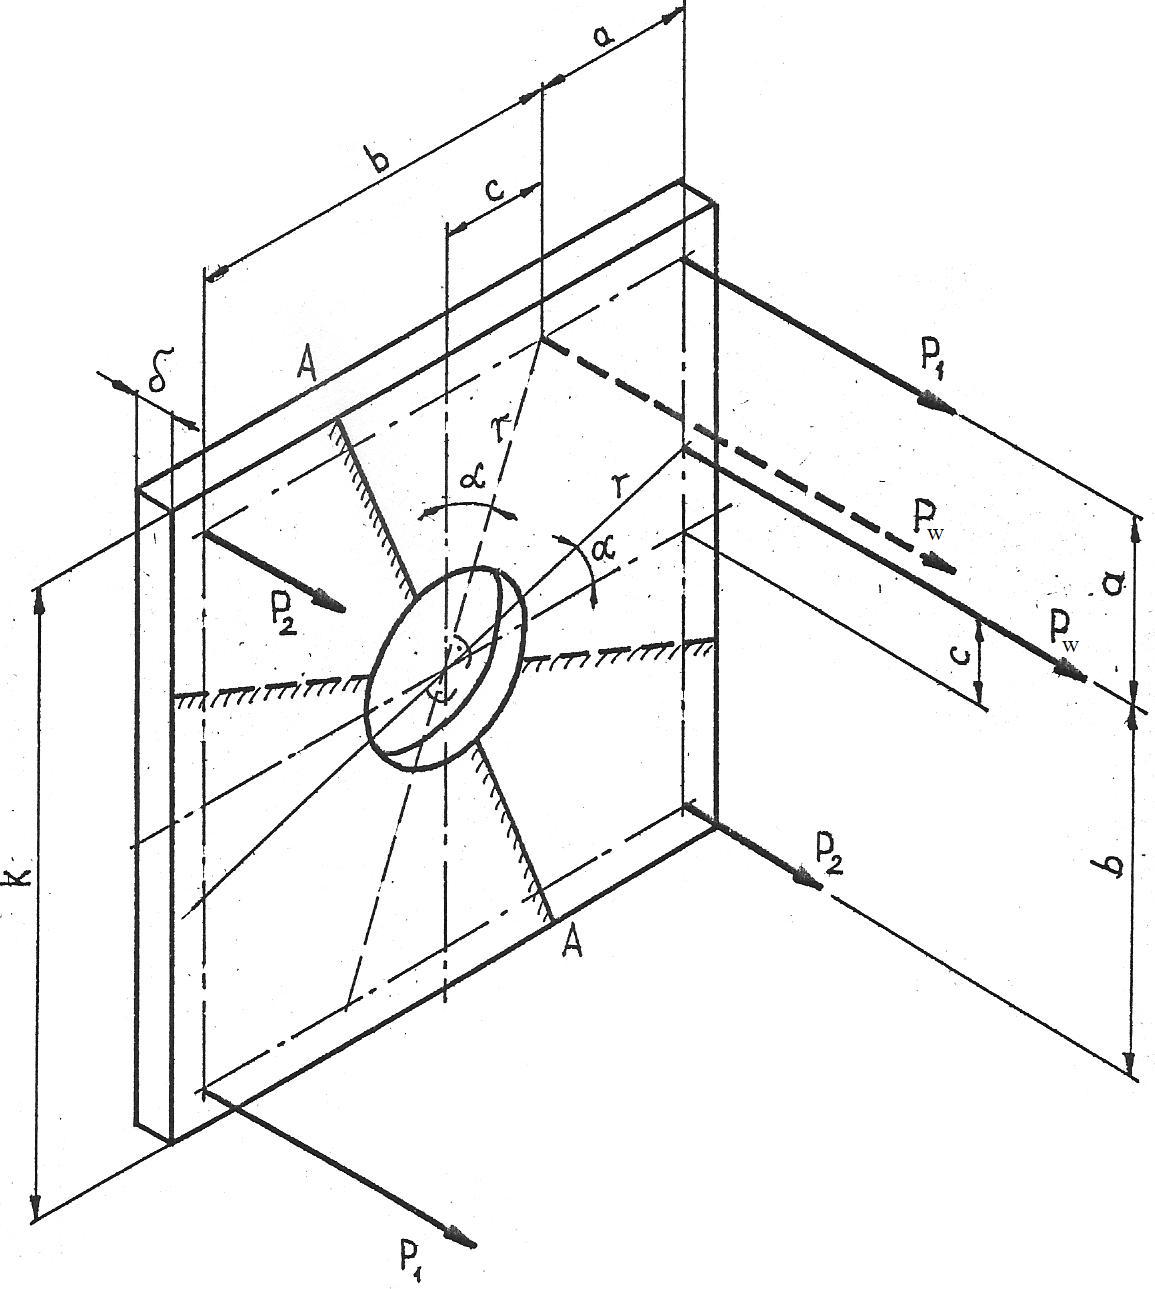
Experimental stand consists of plate with the hole in the center. The load is realized by the central force put near the edge of the hole, and 4 forces in the corners, all acting in the opposite direction to the central one. In this way the plate is buckled.
Those 4 forces are passed on to the other side, where the slats are.
We observe stress changes (interference fringes, called the isochromatic lines) in the polariscope.
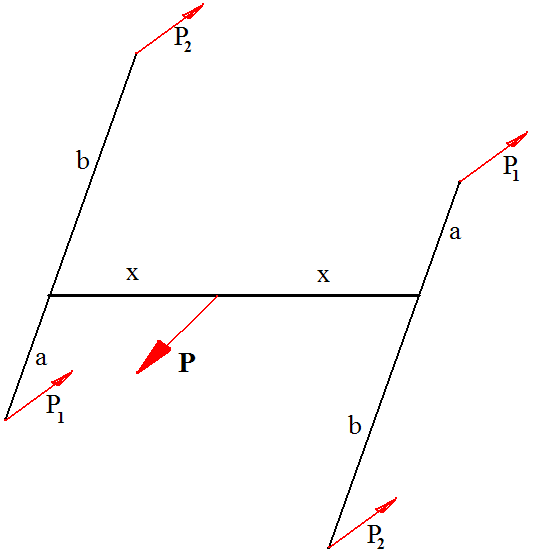
Scheme of forces acting in the system.
P - main load
P1,P2 - reaction forces
a, b, x - distances needed to
calculate moments of forces
Scheme of plate and slat
Equilibrium equations based on the upper schemes.
Calculation of nominal stress.
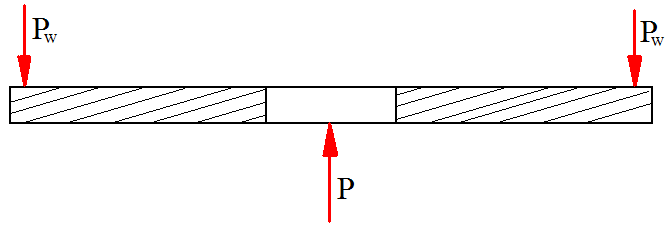
In order to find nominal stress I am going to use so-called “cylinder bending model”. In this method the plate bending is approximated by normal beam bending:
To find force Pw, length c (momentum arm),
and other data needed to find nominal stress we use the following equations:
bending moment
strength
Pw=P/2
Where:
k - length of plate
d - diameter of hole
δ - thickness of the plate
k/cosα - length of the A-A intersection line
Finally:
W=1.1712·10-6 m3
Obtained data.
Ni |
1 |
1.5 |
2 |
2.5 |
4 |
dz |
52 |
79 |
96 |
107 |
130 |
Calculations and juxtaposition of results.
Loading force P in Newtons
As we know that 1dz=3.23kG it is easy to calculate force P in Newtons.
P[N] = dz·3.23kg·9.81 m/s2
Linear regression function - N and Nkor
Then, with the usage of formulas for linear regression:
Thus we find the functions:
Nkor=a1P
Normal stress
To find normal stress σ1 we use the equation:
, where:
C- coefficient of correction (1.25 in that case)
E - Young modulus for Alloy steel (7·104 MN/m2)
ν Poisson ratio for alloy (0.32)
f model constant (0.00128)
Error of normal stress
To calculate error of normal stress calculation we use the following formulae:
Obtained results
Ni |
1 |
1,5 |
2 |
2,5 |
3 |
P[N] |
1647,6876 |
2503,218 |
3041,885 |
3390,434 |
4119,219 |
Ni-N |
0,087747769 |
-0,13209 |
-0,08531 |
0,121421 |
0,00823 |
Nkor |
1,386345195 |
2,106178 |
2,559407 |
2,852672 |
3,465863 |
σ1 [MN/m2] |
75,27854411 |
114,3655 |
138,9758 |
154,9001 |
188,19636 |
δσ1 [MN/m2] |
134,2 |
134,4 |
134,5 |
134,7 |
134,9 |
σn [MN/m2] |
47159282,94 |
71645834 |
87063292 |
97039294 |
117898207 |
Shape factor
P[N] |
1647,6876 |
2503,218 |
3041,885 |
3390,434 |
4119,219 |
αk |
1,199551742 |
1,184368 |
1,299514 |
1,457399 |
1,4394621 |
So the mean value of shape factor is: αk = 1,316059
Derivation of error analysis formulae.
Remarks, comments and conclusions.
To sum up, we can say that our experiment was successful. From the data we obtained during the exercise, we fulfilled our aim and expectations.
We can conclude that:
The increase of stress near the notch rises with the load applied to the system.
Results we obtained for the stress are really
We can also notice, that the method we used is relatively simple and efficient.
Experiment no. 8 - Stress concentrations in machine elements
Page - 2 -
coefficient
Wyszukiwarka
Podobne podstrony:
PNADD523 USAID SARi Report id 3 Nieznany
Ludzie najsłabsi i najbardziej potrzebujący w życiu społeczeństwa, Konferencje, audycje, reportaże,
REPORTAŻ (1), anestezjologia i intensywna terapia
Reportaż
Raport FOCP Fractions Report Fractions Final
reported speech
Reportaże telewizyjne
daily technical report 2012 10 03
Hydrostatics reportzaj
Reportaż- Gatunki dziennikarskie, magisterka, magisterka
EC08 Daily Report 18 July (Revision 1)
peace education report
CRU COF Report
happy planet index report
Assessment report
EC08 Daily Report 28 July (Revision 1)
ocenzurowana wystawa-poszlo o ciecie wraku, a obchody pierwszej rocznicy , pobicie reportera przez s
Pielgrzym, Konferencje, audycje, reportaże, homilie, przemówienia, etc
Reportaż o szkiełku i oku, DZIENNIKARSTWO, Gatunki
więcej podobnych podstron