skanuj0002

Microeconomics
Anna Blajer-Gołębiewska M. Sc.
Exercise 8.
Consumer purchases only two types of goods. His total utility function is TU = X-Y . Draw some indifference curves. Does any of indifference curves intersects either axis?.
Exercise 9.
Consumer’s income is I=£2400 per month. He purchases only two types of goods: meals in the restaurant (M) and books (B). The price for one meal is PM = £20 and the price for a book is PB = £15.
a) Determine consumer’s budget linę as a function of M and B.
b) Determine consumer’s maximum consumption of meals and consumer’s maximum consumption of books.
c) Draw the graph of the budget linę.
CHANGE IN INCOME
d) Consumer income rises to I=£3000 per month. Now he will be able to buy at most........meals in the restaurant and at
most...........books.
e) The rise in income by......% causes the rise in the consumption of meals by.......% and the rise in the purchase of
books by........%.
f) Determine the new consumer’s budget linę as a function of M and B.
g) Draw the graph of the budget linę.
CHANGE IN PRICE
h) The price of one meal in a restaurant decreases and new price is PB = £10. Determine the new consumer’s budget linę as a function of M and B.
i) Determine consumer’s maximum consumption of meals.
j) Consumer can buy at most...........books.
k) The fali in price of meals by ....% causes the fali / rise in the consumption of meals by.......%.
Exercise 10.
Consumer purchases only two goods. The price of good X has changed.
|
July |
August | |
|
Price of X |
2 |
6 |
|
Price of Y |
2 |
2 |
|
Income |
180 | |
|
Consumption of X | ||
|
Consumption of Y |
40 |
30 |

a) Fili up the table with correct figures.
b) Determine consumer’s maximum consumption of X and Y in July.
c) Determine consumer’s maximum consumption of X and Y in August.
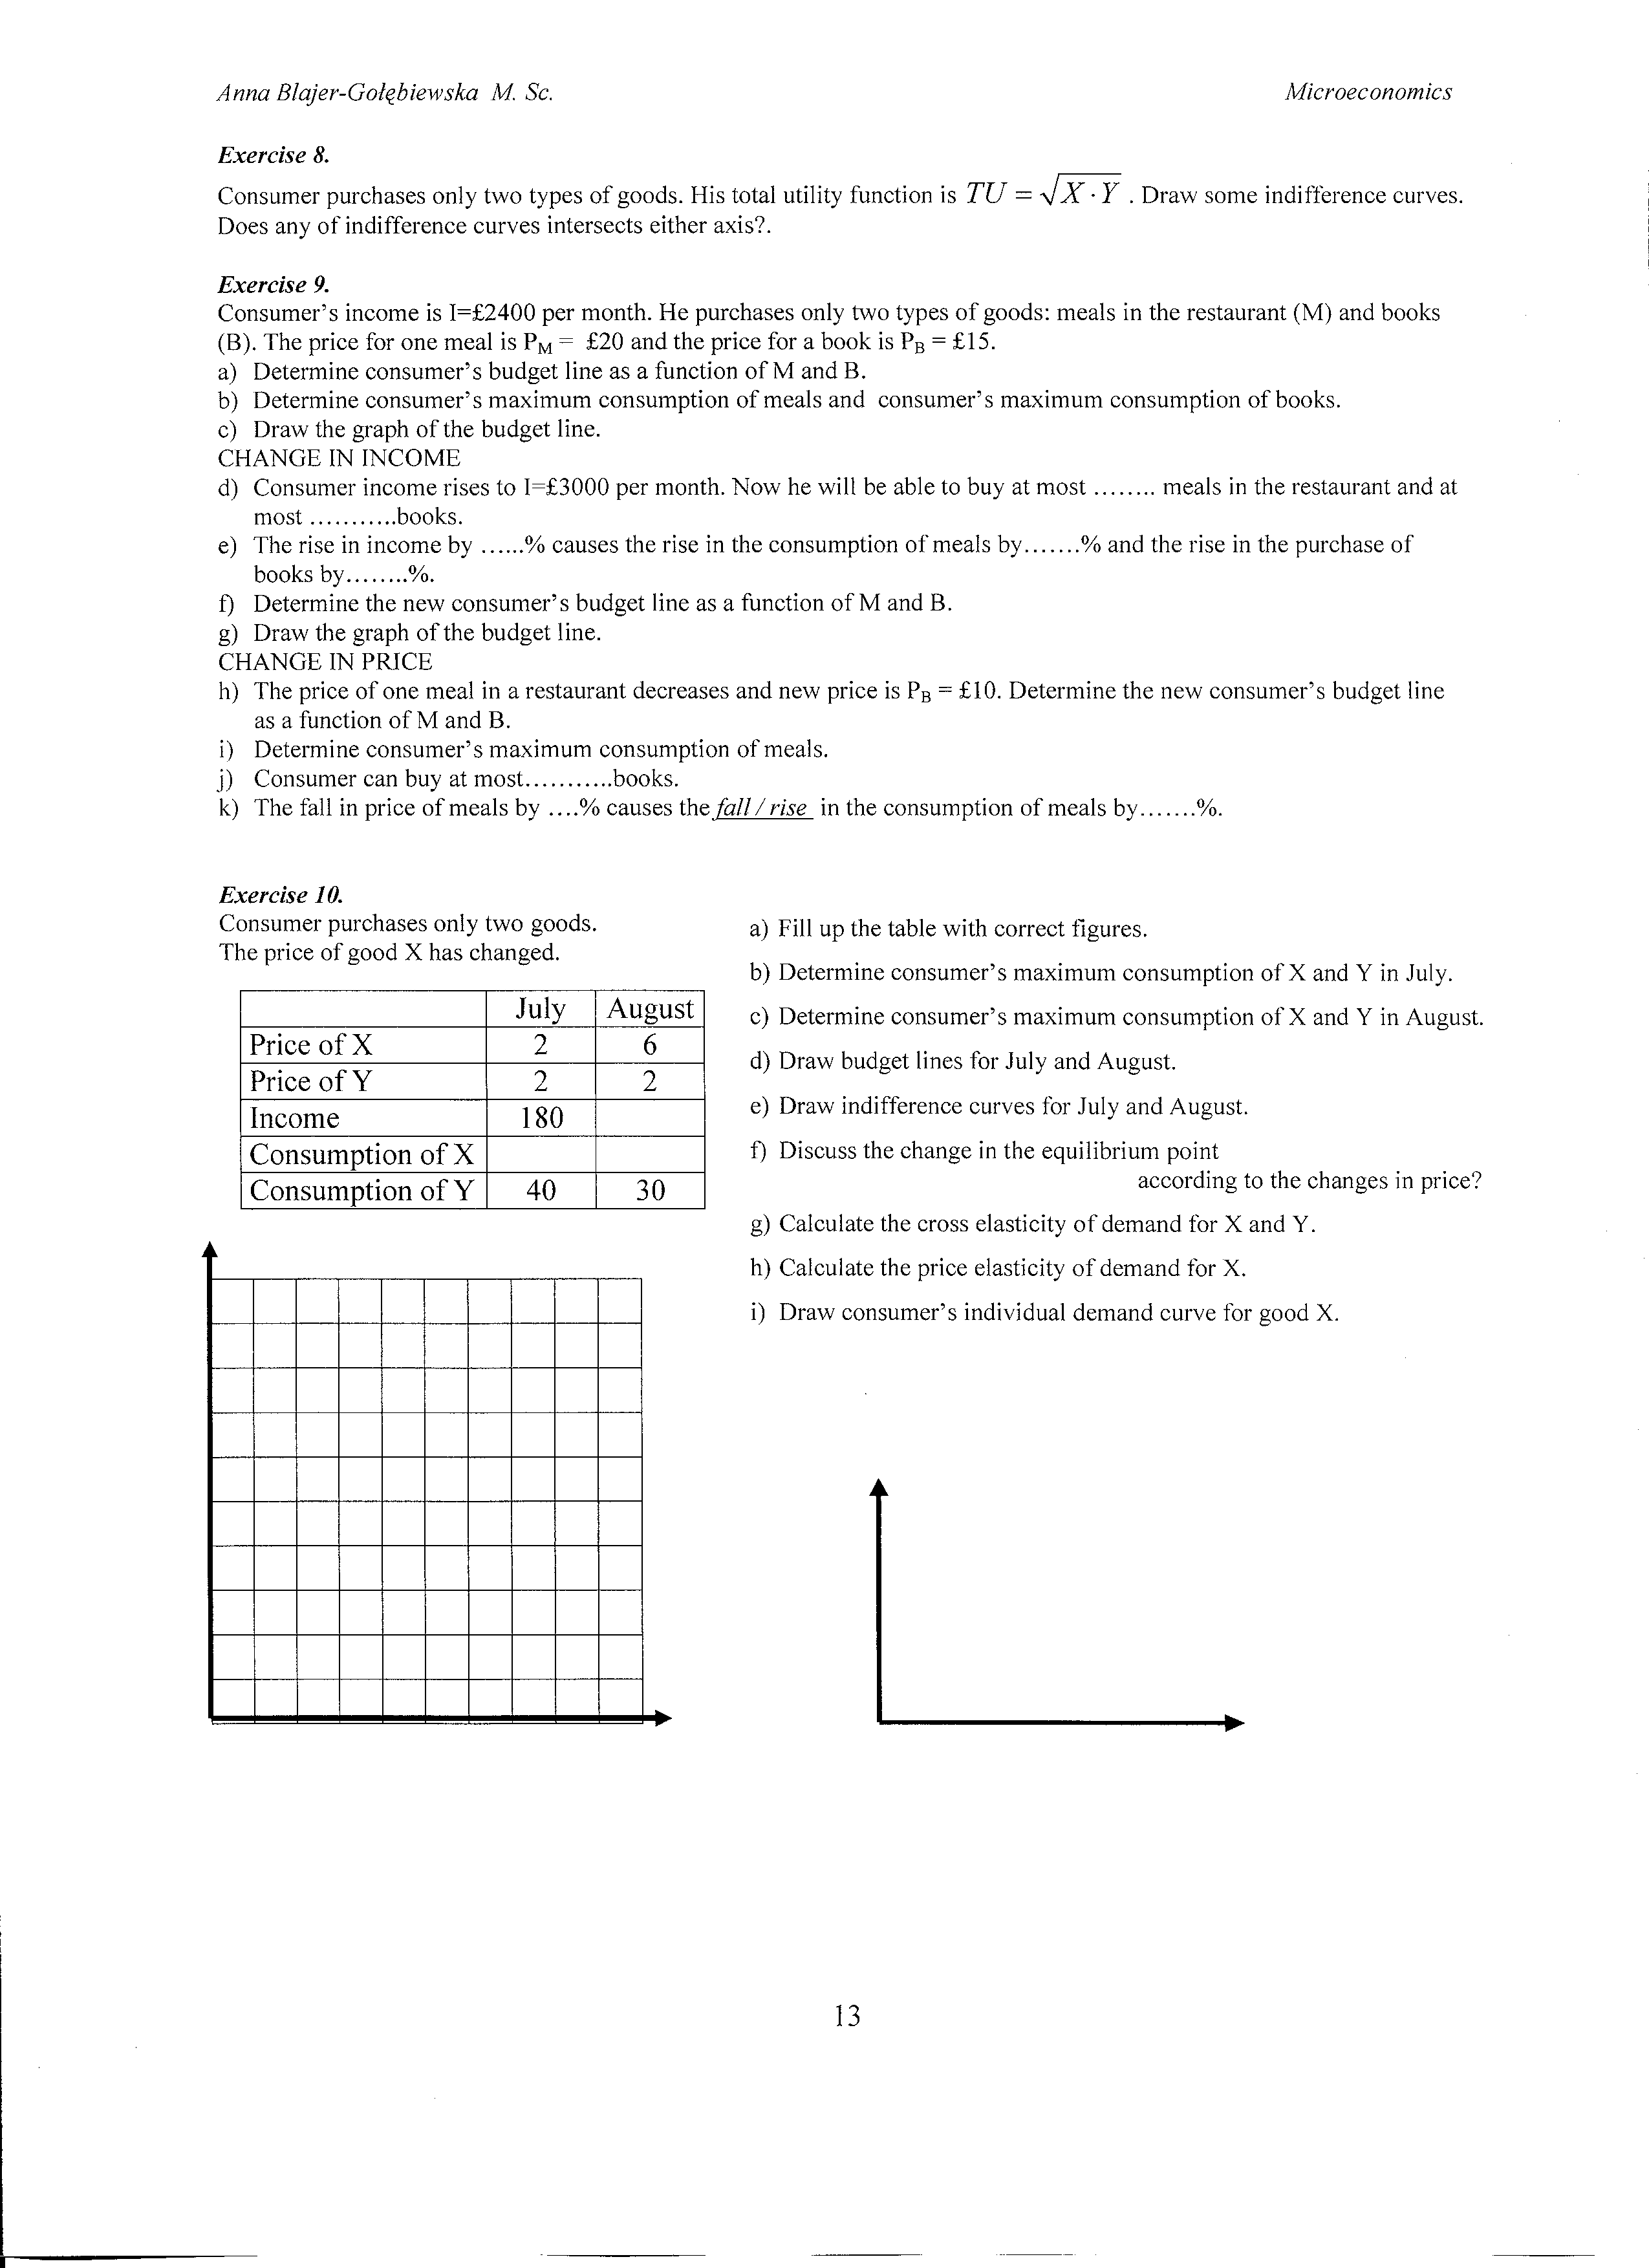
d) Draw budget lines for July and August.
e) Draw indifference curves for July and August.
f) Discuss the change in the eąuilibrium point
according to the changes in price?
g) Calculate the cross elasticity of demand for X and Y.
h) Calculate the price elasticity of demand for X.
i) Draw consumer’s individual demand curve for good X.

13
Wyszukiwarka
Podobne podstrony:
skanuj0003 Microeconomics Anna Blajer-Gołębiewska M. Sc. Exercise 11. Consumer’s income eąuals 12 mo
skanuj0002 Microeconomics Anna Blajer-Gołębiewska M. Sc. Exercise 4. The company produces sophistica
skanuj0004 Microeconomics Anna Blajer-Gołębiewska M. Sc.COSTS AND COSTS MINIMIZATION Exercise I. Div
skanuj0002 (76) Anna Blajer-Gołębiewska M. Sc. Exerci.se 5. There is a duopoly in the market. Compan
microeconomics p18 Microeconomics Anna Blajer-Gołębiewska M. Sc. Exercise 9. On the base of profit a
skanuj0001 (69) Microeconomics Anna Blajer-Gołębiewska M. Sc.6. IMPERFECT COMPETITION AND STRATEGIC
skanuj0003 (73) Microeconomics Anna Blajer-Gotębiewska M. Sc. Exercise 8. Consider the fołlowing seą
microeconomics p19 Microeconomics Anna Blajer-Goiębiewska M. Sc. Exercise 13. Building contractor ‘B
skanuj0001 Anna Blajer-Gołębiewska M. Sc. MicroeconomicsCONSUMER BEHAVIOURExercise 1. Match the labę
skanuj0001 Anna Blajer-Goiębiewska M. Sc. Microeconomics7. MARKETS FOR FACTOR INPUTS Exercise 1. The
Anna Blajer-Gołębiewska Małgorzata ZielenkiewiczROZDZIAŁ 8TEORIA GIER JAKO NARZĘDZIE EKONOMII XX I X
86 Anna Bląjer-Golębiewska, Małgorzata Zielenkiewicz • czas podejmowania decyzji
78 Anna Blajer-Golębiewska, Małgorzata Zielenkiewicz Dynamiczny charakter zjawisk wymagał innego
80 Anna Blajer-Golębiewska, Małgorzata Zielenkiewicz własnej użyteczności z wypłat (dlatego też
więcej podobnych podstron