8290614308
7. Opublikowane badania własne
92
I.OnHetaL 1 Chtmomtmn and tnirthjrnr Lnboratory Syurmt 110(2012) <9-96
of i modd's compłexity (28.29). MCCV and LCXXV were used in (his study in order to obtain robust estimates of RMSECV (for PRM) and to evaluate the complexity of N-PLS. To constracr robust estimates of RMSECV. the trimming procedurę was used |17|. Assuming that some objeas are outllers (e.g. SX). they have large residuals from the robust model and as a result they signiflcanłly afTect esnmates of RMSECV. Therefore. an a priori defined fraction of outlien is omit-ted d u ring the całcuUtion of RMSECV. Root mean square error (RMSE) and root mean square error of pcedkrion (RMSEP) describing the flt and prediaion properties of a calibration model, respectiveły. are defined as:
i
|
RMSE (/i = ^ | |
|
RMSEPtfl ^ y |
(14.
(15)
where. m is the number of samples in the model set (or the number of samples in the model set after trimming), m, is the number of samples in the test set (or the number of samples in the test set after trimming). y! is the experimental response value and y\ is the predicted response value from the model with/latent factors for the #th object from the test set.
3. Data set and data prrtreatement
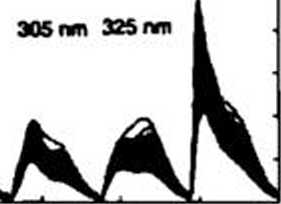
The advantages of robust calibration for the qualiry contro! are demonstrated on the process data describing production of sugar 130). They were collected by process sampling (during 8-hour shifts) at a Scandinarian planL During one 3-month campaign in Ute au-tumn 268 sugar samples were collected from a centrifuge (the finał step of the process). Each sample was dissohred in un-bufTered water (2J5g/15ml), placed in a 10x lOmm cwette and fluores-cence spectra were measuned using a PE LS50B spectrofluorometer. The emission spectra were recorded from 275 to 560 nm in 0.5 nm in-tervals (571 wavekngths) at seven excitaoon wavelengihs (230.240. 255.290.305.325 and 340 nm). In addition to the fluorescence spectra. the ash content and color were dctermined for each sample. Ash content was determined using conductometry by reflecting the total amount of inorganic impuriries in the refined sugar expressed as mass percentages of sample. The color of a sample (membrane-filtered solution of sugar adjusted to pH = 7) was deseńbed by the ab-sorption observed at 420 nm.
Sugar fluorescence Undscapes had a relatieely high signaJ to noise ratio. Therefore. neither noise elimination nor baseline correcrion of signals was necessary.
To present the benehrs of robust calibrabon. outliers were kepi in the data. in contrast to the strategy presented in 1141. Prior to PIS and PRM modeling. fluorescence Undscapes were unfolded. as is shown in Fig. 2. For the N-PLS model, fluorescence Undscapes were arranged as a three-way data array with dimensions samples * cmósion spectra x exritation spectra.
As illustrated in Fig. 2. emission spectra obcained using excitation wavelengths 230.240 255 and 290 nm contain the Rayleigh scatter-ing. Thrs eflect does not reinforce models. therefore prior to construc-tion of PLS and PRM models these parts of spectra were removed. whereas for N-PLS they were substituted with rmssing values (NaN).
4. Metbods
The calibration models presented in this paper were constmaed using fteely availabłe tooiboxes devek>ped for MATLAB: the TOMCAT toolbox 1311 and the N-way toolbo* |32|.
1100
1000
900
000
700
600
500
400
300
200
100
0
r f t
230 nm 240 nm 255 nm 200 nm
340 nm
kmk
500 1000 1500 2000 2500 3000 3500 4000
Emłwłon wav*łenghta (nm)
Rj. 2. UrUofcSfd fluonritefłcr aouuon-fflmiiofl iprctrj oI mgif umpkn coOrcied rvrry d|ht houn (nciutlon wavclcn*ito are tndicjint * che top of emnuon tpmrani).
5. Resuks and dŁscussion
One of the firet steps in data modeltng is the selection of the model and test sets from the avaiUble data. This is done when designing a calibration domain is impossible. In rhe literaturę. diflerent ap-proaches are discussed |24|. For instance. samples to model and test sets are semen mes selected randomly. bu with a limited opportunity to guarantee the representariveness of a model set. Another possibil-ity is to design a model set uniformly using the Kennard and Słone al-gorithm (26). This altows all samples with unique characteristirs (all potential outlying objeas) to be induded into a model set whereas the remaining ones serve as test samples. Such a model set is repre-sentative. in conrrast to the test set Therefore. the finał calibration model usually has a better flt (smali RMSE) than Its prediaion error for new samples. Possibły the best way to design model and test sets. and as a result to obtain reliable estimates of a model s fil and Its prediaion. is ro selea samples for the model and test sets uniformly using the Dupłex ałgorithm because both sets will be representa-tive (potential outliers will be preseni in the model and test sets). In this study. rhe Duplex ałgorithm was used to split samples. which were described by unfolded fluorescence Undscapes (except the input data to N-P15). Each set comained a total of 134 samples. Two response variabies. namety color and ash content in sugar samples. were modeled. using diffetent multivariate calibration technique&. To compare the flt and prediaion properties of models. they were consmicted for the same model and test sets.
Firstly. the PLS method was chosen as the standard chemomerric model mg approach to model the color and ash cofltrnt of sugar samples. The optimal number of Utem variabtes to construa a model was cvaluated using the MCCV approach. The prediaion ability of models with an inereaang complexity was obtained as an averagr of the prediaion errors for models with a given number of latent variables. In the MCCV course. 114 out of 134 samples were drawn randomly 268 times. For these samples PLS models with an inereasing number of Utent variabies were built and their prediaion errors were evalu-ated for 20 test samples in order to obtain estimates of RMSECY. In Fig. 3a and b. two PIS models for the color and ash content are visu-altted as the obsen/ed vs» prediaed response. When modeling sugar color. six latent variabies were determined to be the o po mai model compłexity leading to RMSE equal to 1.678 and RMSEP equal to 1858. Bearing in mind the calibration rangę of a response variab!e. these two errors correspond to 5.08X and 5.631. respectively.
When modeling the ash content In samples. six Utent variables were needed to reach the minimal prediction error of the PLS
Wyszukiwarka
Podobne podstrony:
7. Opublikowane badania własne l Orzeł, M Doizykowld Owmomrina and InieOmenl Lahcrnicry Systemi 137
7. Opublikowane badania własne / One! et of. / falonro 138 (2015) S4-70 rcsponse variable. and y, is
7. Opublikowane badania własne Chłmomnra and Inwlligtm Ubcrjtcry Systems 110 ( 2012) 69 96 CM(«*o«fn
7. Opublikowane badania własne 7. Opublikowane badania własne 91 J. Orzeł et ol: Oirmomrincs and
7. Opublikowane badania własne
7. Opublikowane badania własne J Ontl et al/Futl 117(2014) 224-229 3. Results and dlscussion The dat
7. Opublikowane badania własne 66 J. Onet et al / Talanta I3S (2015) 64-70 (492 nm
7. Opublikowane badania własne HUKI l Onel *1 oi / Talonie (2015 J S4-20 300
7. Opublikowane badania własne
7. Opublikowane badania własne
7. Opublikowane badania własne TalinŁł 101 (2012) 28-114 Contents iists availab!e at SciVerse
7. Opublikowane badania własne flO I OrzPl el ot / Talanla 101 (2012) 7»-64 Rrigtal
7. Opublikowane badania własne 7. Opublikowane badania własne B4 J. Onet et ol / Totonfo tOI (2012)
7. Opublikowane badania własne I ucl 117!201«;224-229 Contents lists available at SciencoDirect I 1
7. Opublikowane badania własne J. Onel et oL/fuel 117(2014) 224-229 226 ctc.. facilitates the analys
7. Opublikowane badania własne 228 J Orzrt r» al/Furt 117(2014) 224-229 TaMc
7. Opublikowane badania własne f hcmomtinrt jrd IniriliRfnl Ubouiory System1 137 (2014) 74-81 Conten
7. Opublikowane badania własne l Orzeł M Dauykowild j Chrmowma cnd InieHycftii Labonuory Systems 137
7. Opublikowane badania własne l.iUnu 118 <2015 W-70 Contents lists available at ScienceDireciTa
więcej podobnych podstron