8290614324
7. Opublikowane badania własne
l Orzeł, M Doizykowld Owmomrina and InieOmenl Lahcrnicry Systemi 137 (2014) 74-BI
PC1 - 83.69%
U iooo 600 600
BO
60
40
OJ 20 O
-20
-40
-60
|
m m m m J. ■ * |
m m •• . •• |
|
• • |
& ł a |
|
• |
o o o 0 ° |
|
o *ooo °° •o |
•o |
-800 - 600 -400 - 200 0 200 400
PC1 - 42.01%
600 600 1000
200 0 200 PCI - 83.69%

*
CM 400 O)
(O
n 200
i
CM
o
o.
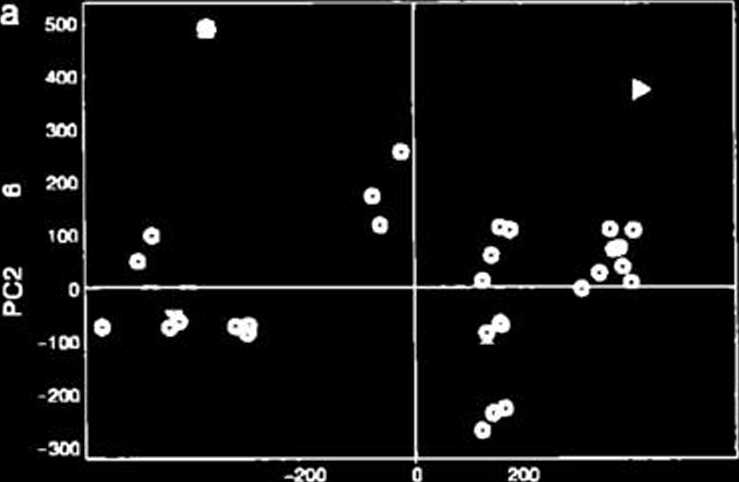
nu Storę plot* of ttie firal iwo principal componrnty PC I ind PC 2, of urrfoidrd EŁWs tiiii d«oibc a rollecilcn of i) cofTre ind b) pcppcrmlni rwani Ejtfrrmr umpl« ire nurtcd ii • ind ►.
known that. depending on an outlying character of samples. thcy can influence least squares models. For this reason, samples with an outlying charaaer were induded in test sets.
270 370 470 570
Excitatton (nm)
Hf. 1 PC 1 and PC 4 vore pin! of unfaldrd EDAi In cólfet exn*m with tht jęrojTaphlral orifin indirattd (. - Aila. * - South America and O - Africa). Color mapt of the Inadmgt prevoiinjt the mmnhimnn of (umnilar vanahlr« rn the ranorumon of b) PC 1 and c) PC 2
To construct the least squares models. training sets were constructed for the coffee and for the peppermint extracts to cover the rangę of the TAC values that incorporated all of the laboratory replicates within the same subscL Thirty samples of coffee extracts and eighteen samples of peppermint extracts were selected for model sets. The remaining fifteen and twelve samples formed test sets for the coffee and peppermint extracts. respeerwety.
For coffee extracts. sińce its geographical origin is known. it is possible to spot a tendency to differentiate between coffee samples collected at different continents on the TC 1 and PC 4 score plot. Along the PC 1. the samples from Afrrca can be separated from the remaining continents (see Fig. 3a). PC 4 models the differences between the Asian coffees and the other ones. The corresponding loading płots, which are presented in the form of a color map, indicate spectral regions that explain the Chemical differences between the samples (see Fig. 3b and c). Each pixel of a map has a color intensity that is proportional to a loading value. The interpretation of a color map of the loadings of PC 1 leads to the con-dusion that coffee samples from Africa are characteńzed by a relatively high content of fluorophores that induces a relatively Iow fluorescence intensity. which can be observed in the dark regions of a color map. On the other hand, samples from Asia contain fluorophores that are character-ized by a relabvely large fluorescence in the dark regions of a color map.
The ORAĆ and TPC values of the same samples were also analyzed. In the case of the peppermint extracts. a relatively strong linear correlarion between the results from rwo antioxidant assays was observed with a correlarion roefficient equal to 0.880. For the coffee exrracts. the agree-ment between the results obtained from rwo assays was rather weak (the correlarion coeffirient value was equal to 0.462); however, the ORAĆ assay is discussed in the literaturę as having weak agreement with other assays (2829|. A morę detailed analysis of the totał antioxidant capadty estimared using either the ORAĆ or the TPC assay did not reveal extreme samples.
Strona 90
Wyszukiwarka
Podobne podstrony:
7. Opublikowane badania własne l Orzeł M Dauykowild j Chrmowma cnd InieHycftii Labonuory Systems 137
7. Opublikowane badania własne 92 I.OnHetaL 1 Chtmomtmn and tnirthjrnr Lnboratory Syurmt 110(2012)
7. Opublikowane badania własne 7. Opublikowane badania własne 91 J. Orzeł et ol: Oirmomrincs and
7. Opublikowane badania własne / One! et of. / falonro 138 (2015) S4-70 rcsponse variable. and y, is
7. Opublikowane badania własne Chłmomnra and Inwlligtm Ubcrjtcry Systems 110 ( 2012) 69 96 CM(«*o«fn
7. Opublikowane badania własne
7. Opublikowane badania własne J Ontl et al/Futl 117(2014) 224-229 3. Results and dlscussion The dat
7. Opublikowane badania własne 66 J. Onet et al / Talanta I3S (2015) 64-70 (492 nm
7. Opublikowane badania własne HUKI l Onel *1 oi / Talonie (2015 J S4-20 300
7. Opublikowane badania własne
7. Opublikowane badania własne
7. Opublikowane badania własne TalinŁł 101 (2012) 28-114 Contents iists availab!e at SciVerse
7. Opublikowane badania własne flO I OrzPl el ot / Talanla 101 (2012) 7»-64 Rrigtal
7. Opublikowane badania własne 7. Opublikowane badania własne B4 J. Onet et ol / Totonfo tOI (2012)
7. Opublikowane badania własne I ucl 117!201«;224-229 Contents lists available at SciencoDirect I 1
7. Opublikowane badania własne J. Onel et oL/fuel 117(2014) 224-229 226 ctc.. facilitates the analys
7. Opublikowane badania własne 228 J Orzrt r» al/Furt 117(2014) 224-229 TaMc
7. Opublikowane badania własne f hcmomtinrt jrd IniriliRfnl Ubouiory System1 137 (2014) 74-81 Conten
7. Opublikowane badania własne l.iUnu 118 <2015 W-70 Contents lists available at ScienceDireciTa
więcej podobnych podstron