9345765638
1
Snohvit C02 Tubaen Fm. storage capacity and inj«ction strategy study
Valid from
Rev. no. 1.0
colours on the real gathers showthe incidence angle calculated from the stacking velocities. The time axes mismatch is due to a software problem, but is of no importance.
■m
H >•
%» *t.' i#v ** M2h*v t: *• iri*v ;*;<« wk * v a: \n mj hv:i> w- ww c* ^ ninr -o


H f
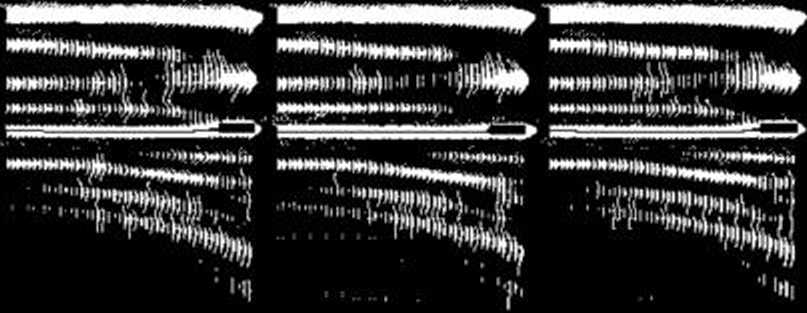
Figurę 61: Fluid substitution in Tubaen 1. From left to right: Vp, Vs, density, base case gather, pressure increase (40 bar) plus CO2 saturation (60%) gather, gather for only pressure increase (40 bar), difference between gather 2 and gather 1, difference between gather 3 and gather 1. Ali the gathers have been modelled using the fuli elastic option in Hampson-Russell AVO modelling software. Pre-stack amplitudes can be picked along the synthetic Fruholmen horizon in the middle of the sections.
tdlor Kcy
0.2338 0.2092 0.1786 0.1480 0.1173 04)66/ 041561 0 0255 -0.0051 -041357 0.0663 -O41369 -0.1276 -0.1582 -41.1888 0.2134 -02500
Iracc Data: lliadsub syn ciast* diff j Ciiar DaU: Uu3 pnmiax
Offset (m) 457 757 1057 1432 1807 2182 2557 2312 3307
1. •... 1....• ..1. . 1.. • 1... 1 • *.. >.
3682

Iracc Data: lluulsub synt cłastic diflZ Ośar DaU: Uu? jramu
Offset (m) 457 757 1057 1412 1007 2102 2557 2332 3307 3682

tolor Key
O.2J30
0.2032
0.1/86
0.1400
0.1173
0.0867
0.0561
0.0255
*0.0051
-0.0357
-0.0663
-0.0069
-0.1276
0.1582
-0.1688
0.2194
0.2500
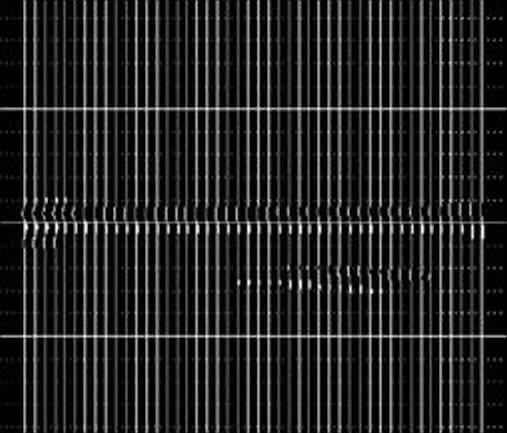
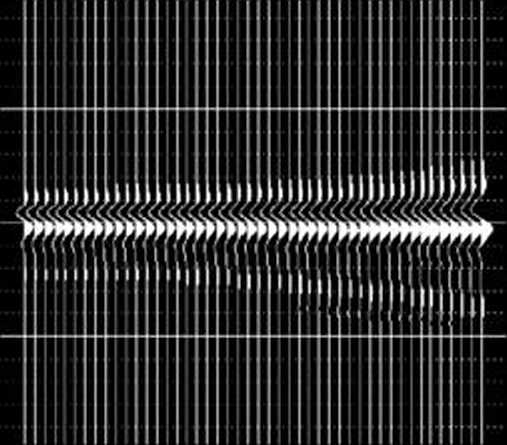
Figurę 62: Difference gathers and time shifts obtained from the synthetic modelling. Left: scenario 2 (saturation+pressure). Right: scenario 3 (pressure only). The time shifts (in ms) have been obtained with the same algorithm as on the real data. Typical time shifts are 0.2-0.3 ms for scenario 2, and 0.06 ms for scenario 3.
Classification: Intemal
Status: Draft
Expiry datę: 2012-12-31
Page 71 of 132
Wyszukiwarka
Podobne podstrony:
1Statoil Snohvit C02 Tubaen Fm. storage capacity and inj«ction strategy study Valid from Rev. no. 1.
1Statoil Snohvit C02 Tubaen Fm. storage capacity and inj«ction strategy study Valid from Rev. no. 1.
1Statoil Snohvit C02 Tubaen Fm. storage capacity and inj«ction strategy study 7 955 *10 Stotoon
1Statoil Snohvit C02 Tubaen Fm. storage capacity and inj«ction strategy study Valid from Rev. no.
1Statoil Snohvit C02 Tubaen Fm. storage capacity and inj«ction strategy study Valid from Rev. no. 1.
1Statoil Snohvit C02 Tubaen Fm. storage capacity and inj«ction strategy study Valid from Rev. no. 1.
Doc. No. Snohvit C02 Tubaen Fm. storage capacity and inj«ction strategy study Valid from Rev. no. 1.
MStatoil Snohvit C02 Tubaen Fm. storage capacity and inj«ction strategy study Valid from Rev. no. 1.
SŁafoil Snohvit C02 Tubaen Fm. storage capacity and injection strategy study Doc. No. Valid
Statoil Snohvit C02 Tubaen Fm. storage capacity and inj«ction strategy study Valid from Rev. no. 1.0
Statoil Snohvit C02 Tubaen Fm. storage capacity and inj«ction strategy study Valid from I Rev. no.
Doc. No. Snohvit C02 Tubaen Fm. storage capacity and inj«ction strategy study Valid from Rev. no.
Statoil Doc. No. Snohvit C02 Tubaen Fm. storage capacity and inj«ction strategy study Valid from Rev
SŁafoil Snohvit C02 Tubaen Fm. storage capacity and injection strategy study Doc. No. Valid
Statoil Snohvit C02 Tubaen Fm. storage capacity and inj«ction strategy study Valid from Rev. no. 1.0
Statoil Snehvit C02 Tubaen Fm. storage capacity and injection strategy study Doc. No. Valid
Statoil Snehvit C02 Tubaen Fm. storage capacity and injection strategy study Doc. No. Valid
Statoil Snehvit C02 Tubaen Fm. storage capacity and injection strategy study Doc. No. Valid
Statoil Snehvit C02 Tubaen Fm. storage capacity and injection strategy study Doc. No. Valid
więcej podobnych podstron