
Biosystems Engineering (2006) 93 (4), 403–413
doi:10.1016/j.biosystemseng.2006.01.017
PH—Postharvest Technology
Microwave Drying of Parsley: Modelling, Kinetics, and Energy Aspects
Y. Soysal
1
; S. O¨ztekin
2
; O¨. Eren
1
1
Department of Agricultural Machinery, Faculty of Agriculture, Mustafa Kemal University, Tayfur Sokmen Campus, 31040 Antakya, Hatay,
Turkey; e-mail: ysoysal@mku.edu.tr
2
Department of Agricultural Machinery, Faculty of Agriculture, C¸ukurova University, 01330 Balcalı, Adana, Turkey
(Received 23 March 2005; accepted in revised form 27 January 2006; published online 20 March 2006)
Parsley (Petroslinum crispum Mill.) leaves were dried in a 900 W 2450 MHz domestic microwave oven to assess
the effects of material load on drying time, drying rate, drying efficiency, and specific energy consumption.
Microwave drying experiments with different material loads ranging from 6430 to 12857 g were performed at
microwave power cycle of 9 s on/9 s off at 900 W microwave output power. Drying took place mainly in
constant rate and falling rate periods. A relatively long constant rate period was observed after a short heating
period. Among the 11 mathematical models tested to fit the drying rates of parsley leaves, the Midilli et al.
model with drying rate as a log–log and linear function of time gave the best fit for all the data points. The
value of the drying coefficient k decreased with the increase in the dried material load. The multiple regression
on the coefficients of the Midilli et al. model for the effects of material load being dried gave the successful
results and showed to satisfactorily represent microwave drying kinetics of parsley leaves for the material
loads between 6430 g and 12857 g. Increasing the material load resulted in a considerable increase in drying
efficiency and a significant decrease in specific energy consumption. About 95% increase in drying efficiency
and about 18% (092 MJ kg
1
[H
2
O]) decrease in specific energy consumption could be obtainable by
increasing the material load from 6430 to 12857 g.
r
2006 Silsoe Research Institute. All rights reserved
Published by Elsevier Ltd
1. Introduction
The fresh or dried leaves, roots, and seeds of parsley
are widely used in the food, cosmetic, and pharmaceu-
tical industries to produce spice, essential oils, and
drugs. The dried leaves known as parsley flakes are
particularly used in the instant food sector as an
ingredient to flavour soups and sausages.
Natural drying (drying in the shade) and hot air
drying are still the best known and widely used methods
of drying. Natural drying has many disadvantages due
to the inability to handle the large quantities and to
achieve consistent quality standards (
). The major drawbacks of conventional hot air
drying are the low energy efficiency and lengthy drying
time during the last stage of drying. For example,
carried out the drying experiments for sweet
basil, pesto basil, marjoram, lemongrass, and parsley in
a hot air dryer with a capacity of 500 g fresh leaf
materials. It was reported that the hot air drying process
to attain the moisture content of 10% wet basis (wb)
took 18, 15, 6, and 5 h for 30, 40, 50, and 65 1C drying
air temperatures, respectively. It was also stated that the
drying temperature of 40 1C was ideal for drying parsley
regarding that colour is of primary importance in dried
herbs. Furthermore, in drying of leafy herbs, high initial
moisture contents up to 85% wb and low drying air
temperatures cause relatively high specific energy con-
sumption values up to 10 MJ kg
1
[H
2
O] (
).
carried out bulk drying
experiments for peppermint, sage and hops in a green-
house type solar dryer with a capacity of 3 tonnes fresh
material. They reported that the specific energy con-
sumption for peppermint, sage and hops were 864, 936,
and 558 MJ kg
1
[H
2
O], respectively.
, performed batch drying experiments in
a tray type dryer with 145 kg of Mentha piperita and
120 kg of Hypericum perforatum. The specific energy
ARTICLE IN PRESS
1537-5110/$32.00
403
r
2006 Silsoe Research Institute. All rights reserved
Published by Elsevier Ltd

consumption
of
the
dryer
for
M.
piperita
and
H. perforatum were reported as 4480 and 7694 MJ
kg
1
[H
2
O], respectively.
In general, energy efficiency in drying is closely related
to drying times. Compared to hot air drying, microwave
or hybrid/combined microwave drying techniques can
greatly reduce the drying time of biological materials
without quality degradation (
;
). Parsley like many
other agricultural crops is very attractive for microwave
drying as it contains high level of moisture.
studied the microwave drying of parsley leaves
with different microwave output power levels ranging
from 360 to 900 W. It was shown that by performing
microwave drying at 900 W output power instead of 30,
40, 50, and 65 1C hot air drying up to the moisture
content of 010 db, the drying time can be shortened
by 111, 92, 37, and 31 fold, respectively. The author
further stated that no significant difference was found
between the colour of fresh and microwave dried leaf
materials, except some decrease in brightness. Hence,
application of microwave energy to dry agricultural
materials may be a good approach to overcome certain
drawbacks of conventional drying techniques (
There has been extensive research on microwave
drying examining a broad spectrum of fruits and
vegetables (
;
;
;
). However, most of the literature presents
the quality of dried product, drying kinetics, dielectric
properties, application of the microwaves, and the
microwave heating mechanism. In addition, a number
of successful drying models have been developed to
explain the convective drying kinetics of various
agricultural products for use in design, construction,
and control of drying systems. However, less effort has
been made on the modelling of microwave drying
process including the process parameters embedded into
the drying model to explain the influence of process
variables on microwave drying kinetics. Only the New-
ton and the Page equations were used in some studies to
describe the microwave drying kinetics of the several
materials including: banana (
), pear
), carrot (
), kiwi (
), garlic (
Sharma &
), grape
), parsley (
), model
fruit gel (
), and olive pomace (
Moreover, a number of successful microwave drying
attempts have been done at a research level (
). Nevertheless, microwave drying of fruits
and vegetables is still in its initial phase of acceptance in
industry due to the high initial costs and a lack of
documented energy analysis (
). Several
strategies have been suggested and applied by some
researchers to enhance the energy utilisation in micro-
wave drying (
;
;
). These
are: (a) combination of microwave and conventional
drying systems; (b) vacuum microwave drying to lower
the drying temperature; and (c) as opposed to contin-
uous exposure, pulsed or intermittent application of
microwave energy to avoid the overheating and improve
the energy efficiency.
In the research of
, the specific
energy consumption value was about 8115–9035 MJ
kg
1
[H
2
O] for convective drying of grapes. It is stated
that under similar convective conditions by the im-
plementation of microwave, the energy consumption
reduced to values ranging from 711 to 2432 MJ kg
1
[H
2
O] depending on the process conditions.
reported that despite the
increase in total drying time of corn, intermittent
microwave drying yielded the product of higher quality
and reduced the energy consumption by reducing the
total microwave exposure time as compared to contin-
uous microwave drying.
Yongsawatdigul and Gunasekaran (1996)
studied
microwave vacuum drying of cranberries and showed
the pulsed application of microwave is more energy
efficient than the continuous application. The most
favourable value of specific energy consumption was
obtained at microwave power cycle of 30 s on/150 s off
at 250 W microwave output power. The mean value of
the specific energy consumption under this condition
was 266 MJ kg
1
[H
2
O] that indicates an improvement
of about 40–60% over conventional hot air drying and
about 46% over continuous microwave vacuum drying
(490 MJ kg
1
[H
2
O]).
used combined microwave–hot
air drying for finish drying of osmotically dehydrated
cranberries and compared the effects of power densities
(075, 10, 125 W/g and power cycles of 30 s on/30 s off
and 30 s on/60 s off at 750 W microwave output power)
on the specific energy consumption and the quality of
product. Both microwave cycling period and applied
power density in intermittent microwave drying influ-
enced the energy consumption. It was concluded that
the combination of 075 W/g with cycling period of 30 s
on/60 s off was appropriate to dry cranberries in terms
of energy efficiency (90 MJ kg
1
[H
2
O]) and quality of
dried product.
ARTICLE IN PRESS
Y. SOYSAL ET AL.
404

Apparently, microwave drying offers high potential
for savings in energy and time due to the volumetric
heating throughout the volume of the material ‘targeting’
mostly water, (
). However,
there are two issues that need to be thoroughly clarified:
(a) research on the efficiency of microwave drying
concerning both energy and time of process is very
limited; and
(b) modelling of the microwave drying process including
the process variables embedded into the drying
model has not completely been studied.
Therefore, the aims of the present work were to:
(a) determine the effects of material load on the
efficiency of microwave drying including drying
time, drying rate, drying efficiency, and specific
energy consumption;
(b) compare the fitting ability of several drying equa-
tions to express the drying kinetics of parsley leaves
with the most suitable drying model; and
(c) describe the whole process in a general drying model
by embedding the effects of material load on the
coefficients of the best fitting model for the purpose
of simulation and scaling up of the process.
2. Materials and methods
2.1. Material
Fresh green parsley (Petroselinum crispum Mill.) leaves
used for the drying experiments were obtained from a
grower in the Hatay region of Turkey. The samples were
stored at 4
705 1C before they were used in experiments.
Prior to each of drying experiments, the samples were
taken out of storage and leaves from stems were
separated. Three 30 g leaf samples were dried in an oven
at 105 1C for 24 h to determine initial moisture content.
The initial moisture content of the parsley leaves were
ranged from 494 to 511 kg [H
2
O] kg
1
[dry matter, DM].
2.2. Drying equipment and experimental procedure
A programmable domestic microwave oven (Galanz
WP900AL23-Z1, China) with maximum output of 900
W at 2450 MHz was used for the drying experiments.
The dimensions of the microwave cavity were 215 mm
by 350 mm by 330 mm.The oven has a fan for air flow in
drying chamber and cooling of magnetron. The
moisture from drying chamber was removed with this
fan by passing it through the openings on the right side
of the oven wall to the outer atmosphere. The oven was
fitted with a glass turntable (314 mm diameter) and had
a digital control facility to adjust the microwave output
power by the 10% decrements and the time of
processing. The microwave oven power was set to cyclic
heating with 50% rating. This provided an intermittent
heating for a period of 9 s, followed by a pause for 9 s.
Six different amount of material loads (12857, 11240,
9990, 9010, 7513, and 6430 g) were investigated in
drying experiments at microwave power cycle of 9 s on/
9 s off at 900 W. The fresh leaf materials were uniformly
spread on the turntable inside the microwave cavity, for
an even absorption of microwave energy. Three
replicates were carried out for each experiment accord-
ing to preset time schedule based on the preliminary
tests. Depending on the drying conditions, moisture loss
was recorded at 1 or 3 min intervals during drying at the
end of power-on time by removing the turntable from
the microwave, and placing this, along with the leaf
sample on the digital balance (
The microwave power was applied until the mass of
the sample reduced to a level corresponding to a
moisture content of about 010 kg [H
2
O] kg
1
[DM].
2.3. Mathematical modelling of microwave drying curves
To determine the most suitable drying equation, the
microwave drying curves were fitted to experimental
data using 11 different moisture ratio M
R
equations
(
). The equilibrium moisture content M
e
was
assumed to be zero for microwave drying, so that the
moisture ratio M
R
was simplified to M=M
0
instead of
the
M M
e
ð
Þ
= M
0
M
e
ð
Þ
), where M
0
is the initial moisture content in kg
[H
2
O] kg
1
[DM] and M is the moisture content at any
time in kg [H
2
O] kg
1
[DM] and M
e
is the equilibrium
moisture content in kg [H
2
O] kg
1
[DM].
The root mean square error E
RMS
and the modelling
efficiency Z
m
were used as the primary criterion to select
the best equation expressing the microwave drying curves
of parsley (
). The E
RMS
gives the deviation between the predicted
and experimental values. The lower the values of the
E
RMS
, the better the goodness of fit. The value for Z
m
, on
the other hand, determines the fitting ability of the
equation and it is required to reach 1 for the best results.
These statistical criterions can be calculated as follows:
E
RMS
¼
1
N
X
N
i¼1
M
R;cal;i
M
R;exp;i
2
"
#
1=2
(1)
Z
m
¼
P
N
i¼1
M
R;exp;i
M
R;exp;av
2
P
N
i¼1
M
R;cal;i
M
R;exp;i
2
P
N
i¼1
M
R;exp;i
M
R;exp;av
2
(2)
ARTICLE IN PRESS
MICROWAVE DRYING OF PARSLEY
405

where: E
RMS
is the root mean square error; M
R;exp;i
is the
ith experimental moisture ratio; M
R;cal;i
is the ith
predicted moisture ratio; N is the number of observa-
tions; and M
R;exp;av
is the mean value of the experi-
mental moisture ratio.
In this study, the effect of material load on the
coefficients of the drying expression was also investi-
gated by multiple regression analysis. The coefficients of
the best fitting model involving the material load were
determined by investigating multiple combinations of
the different type of equations as simple linear,
logarithmic, exponential, power, arrhenius and rational.
2.4. Determination of the energy efficiency of microwave
drying
Effect of material load on the energy efficiency of
microwave drying at microwave power cycle of 9 s on/9 s
off at 900 W was evaluated by two different efficiency
indices as microwave drying efficiency in % and specific
energy consumption in MJ kg
1
[H
2
O]. The microwave
drying efficiency [Eqn (3)] was calculated as the ratio of
heat energy utilised for evaporating water from the
sample to the heat supplied by the microwave oven
(
Yongsawatdigul & Gunasekaran, 1996
Mousa &
). The cumulative drying efficiency values
were calculated as the averaged energy consumption for
water evaporation divided by the supplied microwave
energy in the, total power-on time t
on
in s:
Z
d
¼
m
w
l
w
PDt
on
100
(3)
where: Z
d
is the microwave drying efficiency in %; m
w
is
the mass of evaporated water in kg; l
w
is the latent heat
of vaporisation of water in J kg
1
; P is the average
microwave power in W; and Dt
on
is the time interval in s.
The latent heat of vaporisation of water at the
evaporating temperature (100 1C) was taken as 2257
kJ kg
1
The specific energy consumption [Eqn (4)] was
calculated as the energy needed to evaporate a unit
mass of water (
Yongsawatdigul & Gunasekaran, 1996
Q
s
¼
t
on
P 10
6
m
w
(4)
where: Q
s
is the specific energy consumption to
evaporate a unit mass of water from the product in
MJ kg
1
[H
2
O].
3. Results and discussion
3.1. Effect of material load on drying kinetics
The moisture content versus time curves for micro-
wave drying of parsley leaves as influenced by the
material load dried at microwave power cycle of 9 s on/
9 s off at 900 W are shown in
. The microwave
drying process which reduced the material moisture
contents from 494 to 511 kg [H
2
O] kg
1
[DM] to
moisture content of 010 kg [H
2
O] kg
1
[DM] took
900–1467 min, depending on the drying conditions
(
). The higher the material load, the longer was the
drying time of parsley leaves. As the variation in initial
moisture contents of the material used in drying
experiments were relatively very small, the difference
in drying time requirements was considered to be mainly
due to the difference in material load. Further, the
applied microwave power density for unit mass of dried
ARTICLE IN PRESS
Table 1
Mathematical models given by various authors for drying curves
Model no
Model equation
Name
References
1
M
R
¼
expðktÞ
Newton
2
M
R
¼
expðkt
n
Þ
Page
3
M
R
¼
a expðktÞ
Henderson and Pabis
4
M
R
¼
a expðktÞ þ b
Logarithmic
5
M
R
¼
a expðkt
n
Þ þ
bt
Midilli et al.
6
M
R
¼
1 þ at þ bt
2
Wang and Singh
7
M
R
¼
b=ð1 þ a expðktÞÞ
Logistic
8
M
R
¼
a expðktÞ þ b expðk
1
tÞ
Two–term
9
M
R
¼
a expðktÞ þ ð1 aÞ expðbtÞ
Verma et al.
10
M
R
¼
a expðktÞ þ ð1 aÞ expðkatÞ
Two-term
exponential
11
M
R
¼
a expðktÞ þ ð1 aÞ expðkbtÞ
Diffusion
approximation
M
R
, moisture ratio (dimensionless); k and k
1
drying coefficients in min
1
; n, exponent (dimensionless); t, time in min; a and b, coefficients
(dimensionless), specific to individual equations.
Y. SOYSAL ET AL.
406
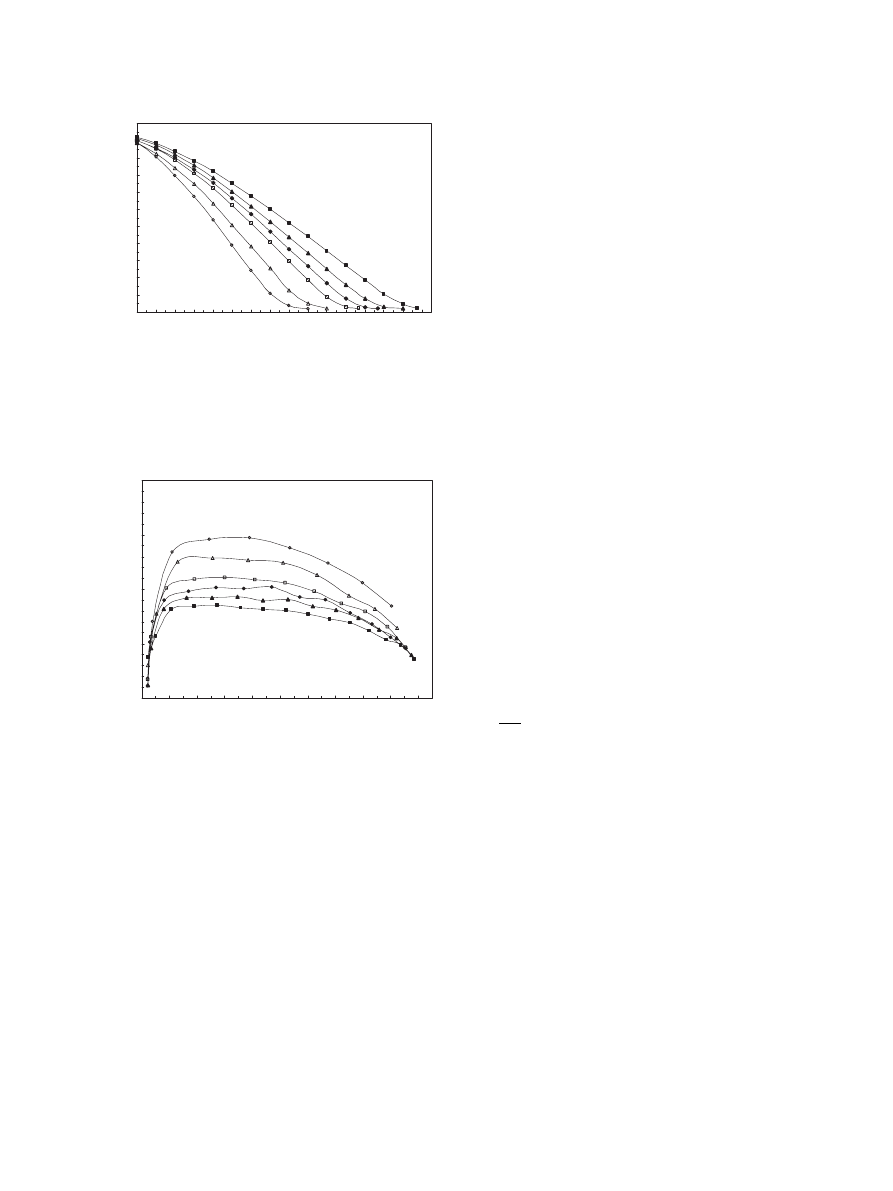
material decreased with increased material load. Higher
drying rates were obtained at lower material loads due
to the increase in applied microwave power density for
unit mass of dried product. When drying the leaf
materials, a period of constant drying rate which
depends on the applied microwave power density,
material load and duration was observed (
). The
length of this period decreased with increased power
density. And at a maximum power density or lowest
material load, the constant rate period was practically
absent as inferred from
. These results were in
good agreement with some studies (
;
;
;
). The rapidly decreasing falling rate period
followed the constant rate period and started below
the 05 kg [H
2
O] kg
1
[DM].
3.2. Modelling of drying curves
The results of the statistical computations for the
microwave drying data are shown in
. The fitting
ability of 11 drying models expressing the changes in the
moisture ratios with drying time are presented in
as the values of the coefficients and statistical para-
meters found for the respective models. Among the all
drying models used in this study, the
model, with drying rate as a log–log and linear function
of time, gave the best fit for all the experimental data
point with values for the Z
m
of greater than 09974 and
the E
RMS
of lower than 00179. Thus, this model
represented the experimental values satisfactorily.
The drying coefficient k decreased with the increase in
dried material load. These results were in good
agreement with the drying rate data, which follow the
similar trends.
Further regressions were undertaken to account for
the effect of material load on the Midilli et al. model
coefficients. The effect of the material load on the
coefficients of a and b, exponent n and drying coefficient
k were also included in the model by multiple regression
analysis [Eqn (5)]. The consistency of model (5) and
relationship between the coefficients and dried material
load is evident with the values for E
RMS
of 00019 and
Z
m
of 09982 for the combined data.
M
R
¼
M
M
0
¼ ð
08717m
00274
Þ
expðð728601m
18344
Þ
t
ð
31159m
0113
Þ
Þ þ ð
00001m
10367
Þ
t
ð
5Þ
where: m is the material load in g; t is the drying time
in min.
On the other hand, the most suitable result of model
(5) depending on the material load are given in
The E
RMS
values were changed between 00002 and
00013 and the Z
m
between 09966 and 09995 depending
on the material load. It can be seen that model (5) was in
good agreement with the experimental results. However,
it should be noted that these data are specific to
microwave dryer used in this study. This expression is
only valid for the material load between 6430 and
12857 g and can successfully be used to estimate the
moisture content of parsley leaves at any time during the
microwave drying at microwave power cycle of 9 s on/9 s
off at 900 W microwave output power.
Changes of the experimental and predicted moisture
ratio values with drying time for different material load
ARTICLE IN PRESS
0.00
0.25
0.50
0.75
1.00
0.0 0.5 1.0 1.5 2.0 2.5 3.0 3.5 4.0 4.5 5.0
Moisture content kg [H
2
O] kg
−1
[DM]
Drying rate, kg [H
2
O] kg
−
1
[DM] min
−
1
Fig. 2. Relationship between the drying rate and moisture
content (kg [H
2
O] kg
1
[DM]) at different material load dried
at microwave power cycle of 9 s on/9 s off at 900 W microwave
output power; ’, 12857 g; m, 11240 g; E, 9990 g; &, 9010
g;
W
, 7513 g; J, 6430 g
0.0
0
1 2 3 4 5 6
7 8 9 10 11 12 13 14 15
0.5
1.0
1.5
2.0
2.5
3.0
3.5
4.0
4.5
5.0
5.5
Drying time, min
Moisture content, kg [H
2
O] kg
−
1
[DM]
Fig. 1. Relationship between the moisture content (kg [H
2
O]
kg
1
[DM]) and drying time at different material load dried at
microwave power cycle of 9 s on/9 s off at 900 W microwave
output power; ’, 12857 g; m, 11240 g; E, 9990 g; &, 9010
g;
W
, 7513 g; J, 6430 g
MICROWAVE DRYING OF PARSLEY
407

ARTICLE IN PRESS
Table 2
Statistical parameters and the values of the coefficients specific to each model for various material loads dried at microwave power
cycle of 9 s on/9 s off at 900 W output power
Model
no
Material load, g
Drying
coefficient
(k),min
1
Drying
coefficient
(k
1
)
Exponent
(n)
Coefficient
(a)
Coefficient
(b)
Root mean
square
error
Modelling
efficiency
1
12857
01027
01169
08727
11240
01177
01182
08773
9990
01281
01221
08720
9010
01398
01219
08736
7513
01674
01169
08832
6430
02045
01113
08982
2
12857
00102
20529
00325
09902
11240
00130
20530
00299
09922
9990
00137
21078
00305
09921
9010
00165
21030
00304
09921
7513
00265
20487
00289
09929
6430
00433
19647
00279
09936
3
12857
01199
11458
01008
09054
11240
01370
11488
01019
09088
9990
01486
11482
01062
09032
9010
01616
11415
01064
09038
7513
01910
11313
01033
09089
6430
02296
11210
00993
09190
4
12857
00009
757615
746987
00262
09936
11240
00024
326707
316159
00304
09919
9990
00020
434841
424252
00311
09917
9010
00022
425134
414561
00310
09918
7513
00053
209279
198807
00334
09905
6430
00324
42884
32463
00386
09878
5
12857
00094
18167
09931
00191
00071
09995
11240
00131
18883
09854
00111
00134
09984
9990
00136
19336
09845
00127
00123
09987
9010
00166
19165
09862
00138
00127
09986
7513
00251
19165
09820
00125
00145
09982
6430
00408
18799
09794
00091
00179
09974
6
12857
00493
00014
00209
09959
11240
00616
00010
00337
09901
9990
00642
00015
00323
09911
9010
00704
00016
00327
09909
7513
00901
00015
00363
09887
6430
01218
00006
00422
09854
7
12857
03695
00556
10276
00261
09937
11240
04124
00573
10319
00241
09949
9990
04620
00502
10223
00242
09950
9010
04999
00514
10250
00247
09948
7513
05812
00573
10313
00220
09959
6430
06570
00694
10447
00212
09963
8
12857
02445
02802
99388
89837
00543
09726
11240
00173
00282
22771
12335
00301
09921
9990
00094
00270
28875
18475
00292
09927
9010
00109
00284
28994
18591
00285
09926
7513
00205
00282
27708
17316
00332
09906
Y. SOYSAL ET AL.
408

dried at microwave power cycle of 9 s on/9 s off at 900 W
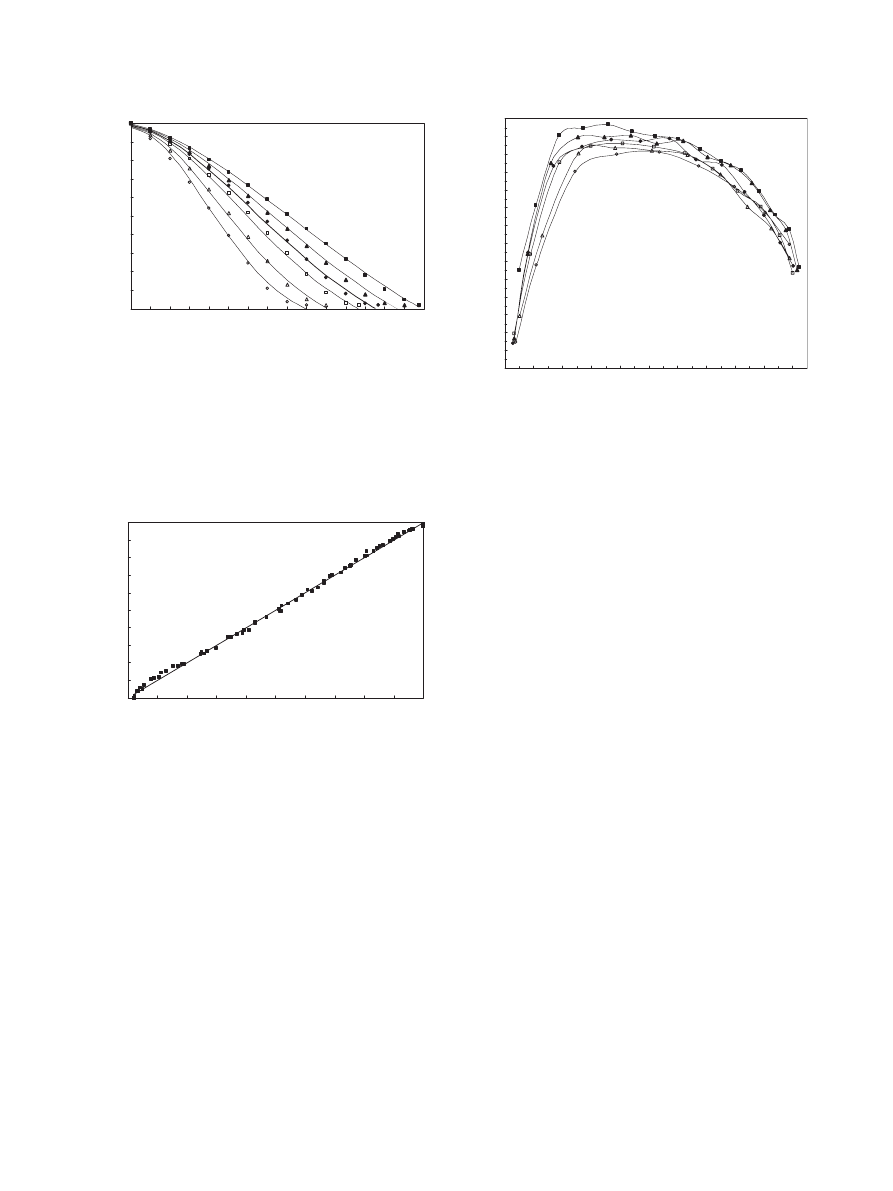
microwave output power were given in
. The
established model was validated by comparing the
predicted moisture ratios to the experimental values
from all drying experiments. The predicted data banded
over the straight line of the 1:1 ratio, with a value for the
determination coefficient R
2
of 09982 (
). The
linear regression of these results gave the expression as
M
R;cal
¼
09975M
R;exp
þ
00017
(6)
3.3. Effect of material load on the energy efficiency of
microwave drying
Effect of material load on the energy efficiency of
microwave drying was evaluated by two different
efficiency indices as microwave drying efficiency in %
and specific energy consumption in MJ kg
1
[H
2
O]. The
changes of the microwave drying efficiency with
moisture content for various material loads were
illustrated in
.
Although the microwave drying efficiency for the leaf
material differed between material loads, the microwave
drying efficiency was about 30% at the beginning of
drying process, and then showed a rapidly increasing
tendency to a moisture content of about 375 kg [H
2
O]
kg
1
[DM]. Apparently, during the initial few minutes,
the microwave energy applied was used in raising the
material temperature and very little moisture was
evaporated (
). Thus, initial heating phase
during the first few minutes lead to lower drying
efficiency values compared to cumulative drying effi-
ciency values for the respective drying conditions given
in
. After a slow increasing tendency to about the
moisture content of 175 kg [H
2
O] kg
1
[DM], the
microwave drying efficiency reached to its maximum
value and was varied between 60% and 68% depending
on the material load ranging from 6430 to 12857 g,
respectively. Then, it was almost remained constant up
to the moisture contents of about 125 kg [H
2
O] kg
1
[DM] to 075 kg [H
2
O] kg
1
[DM]. Below these moisture
ARTICLE IN PRESS
Table 2 (
continued )
Model
no
Material load, g
Drying
coefficient
(k),min
1
Drying
coefficient
(k
1
)
Exponent
(n)
Coefficient
(a)
Coefficient
(b)
Root mean
square
error
Modelling
efficiency
6430
00419
00101
28926
18498
00387
09877
9
12857
–00054
31094
00323
00222
09954
11240
00025
29668
00282
00343
09897
9990
00042
24144
00394
00333
09905
9010
00052
24254
00418
00337
09903
7513
00089
27960
00370
00368
09884
6430
00291
28016
00225
00424
09852
10
12857
259691
00039
01178
08707
11240
290603
00040
01191
08754
9990
496827
00026
01227
08709
9010
625201
00022
01224
08727
7513
666134
00025
01174
08822
6430
848084
00024
01117
08973
11
12857
00018
21657
223710
00225
09953
11240
00092
22070
38835
00345
09895
9990
00077
21669
55549
00334
09904
9010
00108
20651
44428
00340
09902
7513
00140
23948
30185
00369
09883
6430
00254
32422
06966
00423
09852
Table 3
Effect of material load on Midilli
et al. model and its results
Material load (m),
g
Root mean square
error
Modelling efficiency
(Z
m
)
12857
000024
099945
11240
000104
099763
9990
000062
099857
9010
000080
099811
7513
000075
099806
6430
000130
099661
MICROWAVE DRYING OF PARSLEY
409
contents, microwave drying efficiency decreased rapidly
and reached to a value as low as 8%. This could be
attributed to the decrease in moisture content of the
material at the later stages of the drying. The dielectric
properties of the product being dried are proportionally
related to moisture content (
). Thus,
intensity of heat generation or the ability of the product
to absorb microwave energy decreases due to the
reduction of moisture during the microwave drying
process (
;
).
Despite the significant reduction in microwave drying
efficiency at the latter stages of the drying process,
cumulative drying efficiencies were still high. Cumula-
tive drying efficiencies were calculated as 5368, 4992,
4783, 4683, 4648, and 4422% for the material loads
12857, 11240, 9990, 9010, 7513, and 6430 g, respec-
tively (
). However, it should be noted that
maximum loading rate of the microwave dryer used in
this study is limited to about 130 g when drying the leaf
parsley. Therefore, these data are specific to microwave
dryer used in this study. A considerable increase in
drying efficiency with increasing material load signifies
that the microwave was efficiently absorbed by water, so
as water is depleted microwave absorption is reduced
leading to lower efficiency values (
;
Mousa &
;
). As the size
of load relative to cavity determines the amount of
power reflection back to the magnetron, the larger the
load size, the lower the power reduction by reflection
and cavity loss and, hence, the higher the efficiency of
power absorption (
). Conse-
quently, it can be said that energy required to remove
unit mass water from the product at higher material
loads is less than at lower load size.
Specific energy consumption values for the respective
drying conditions are given in
. Although the
parsley and the peppermint are different in nature, the
specific energy consumption values were relatively low
as compared to those obtained for peppermint 1000,
864, and 484 MJ kg
1
[H
2
O], reported by
and
, respectively. The higher the material
ARTICLE IN PRESS
Experimental moisture ratio
Predicted moisture ratio
1.0
0.9
0.8
0.7
0.6
0.5
0.4
0.3
0.2
0.1
0.0
0.0
0.1
0.2
0.3
0.4
0.5
0.6
0.7
0.8
0.9
1.0
Fig. 4. Experimental (’) and predicted (—) moisture ratio at
different microwave drying conditions
0
5
10
15
20
25
30
35
40
45
50
55
60
65
70
0.0 0.5 1.0 1.5 2.0 2.5 3.0 3.5 4.0 4.5 5.0
Moisture content, kg [H
2
O] kg
−1
[DM]
Microwave drying efficiency, %
Fig. 5. Microwave drying efficiency versus moisture content (kg
[H
2
O] kg
1
[DM]) at different material load dried at
microwave power cycle of 9 s on/9 s off at 900 W microwave
output power; ’, 12857 g; m, 11240 g; K, 9990 g; &, 9010
g;
W
, 7513 g; J, 6430 g
0.0
0 1
2
3
4
5
6
7
8
9 10 11 12 13 14 15
0.1
0.2
0.3
0.4
0.5
0.6
0.7
0.8
0.9
1.0
Drying time, min
Moisture ratio
Fig. 3. Moisture ratio versus time at different material load
dried at microwave power cycle of 9 s on/9 s off at 900 W
microwave output power, comparing experimental curve with the
predicted one (—) through Midilli et al. model [Model 5] for
parsley (Petroselinum crispum Mill.) leaves; ’, 12857 g; m,
11240 g; K, 9990 g; &, 9010 g;
W
, 7513 g; J, 6430 g
Y. SOYSAL ET AL.
410

loads the lower the specific energy consumption
(
). As the intensity of heat generation is
proportional to the content of moisture in a dielectri-
cally dried material (
), the
bigger amount of water trapped inside the material
provided the higher drying efficiency and lower specific
energy consumption values.
Although the discussion about the quality of dried
product is beyond the scope of this paper, no significant
difference was observed between the colour of fresh and
microwave-dried leaf materials, except for some de-
crease in brightness of leaf material.
4. Conclusion
Based on the results of this study, the following
conclusions were drawn.
(a) Drying took place mainly in the falling rate period
followed by a constant rate period after a short
heating period.
(b) The higher the material load, the longer the drying
time of parsley leaves. Higher drying rates were
obtained at lower material loads.
(c) The Midilli et al. model, with dying rate as a log–log
and linear function of time, gave the best fit for all
the experimental data points with values for the
modelling efficiency of greater than 09974 and the
root mean square error of lower than 00179.
(d) The value of the drying coefficient k decreased with
the increased material load indicating slower drying
of the product.
(e) The multiple regression on the coefficients of the
Midilli et al. model for the effects of material load
being dried gave the high modelling efficiency value
of 09982 and low root mean square error of 00019,
and showed to satisfactorily represent the micro-
wave drying kinetics of parsley leaves dried at
microwave power cycle of 9 s on/9 s off at 900 W
microwave output power.
(f) The initial heating phase during the first few minutes
of drying process lead to lower drying efficiency
values as low as 30% compared to the values for
cumulative drying efficiency which ranged from
4422% to 5368% for the material loads between
6430 and 12857 g, respectively.
(g) At the later stages of the drying process, drying
efficiency values decreased considerably to a value as
low as 8%.
(h) When the material load being dried was higher,
more of the microwave energy was used for
evaporating moisture while the lower material load
tended to decrease the drying efficiency and increase
the specific energy consumption.
ARTICLE IN PRESS
Table
4
Efficiency
of
microwave
drying
depending
on
material
load
dried
at
microwave
power
cycle
of
9
s
on/9
s
off
at
900
W
microwave
output
power
Parameter
Material
load,
g
128
57
(7
0
06)
112
40
(7
0
00)
99
90
(7
0
00)
90
10
(7
0
00)
75
13
(7
0
06)
64
30
(7
0
00)
Initial
moisture
content
5
11
(7
0
00)
5
08
(7
0
03)
5
01
(7
0
15)
5
00
(7
0
05)
4
94
(7
0
03)
4
94
(7
0
03)
M
0
,k
g[
H
2
O]
kg
1
[DM]
Final
moisture
content
0
10
(7
0
00)
0
10
(7
0
01)
0
10
(7
0
00)
0
10
(7
0
01)
0
10
(7
0
00)
0
10
(7
0
00)
M
f
,k
g[
H
2
O]
kg
1
[DM]
Evaporated
water
D
M
,
g
105
30
(7
0
00)
91
97
(7
0
21)
81
52
(7
0
45)
73
52
(7
0
18)
61
16
(7
0
01)
52
37
(7
0
06)
Drying
time
t,
min
14
75
14
00
12
67
11
67
10
00
9
00
Total
power
on
time
t
on
,
s
489
0
462
0
418
0
385
0
330
0
297
0
Drying
rate,
0
34
(7
0
09)
0
36
(7
0
12)
0
38
(7
0
14)
0
41
(7
0
14)
0
48
(7
0
17)
0
54
(7
0
22)
kg
[H
2
O]
kg
1
[DM]
min
1
Cumulative
microwave
drying
53
68
(7
0
06)
a
49
92
(7
0
12)
b
47
83
(7
0
37)
c
46
83
(7
0
10)
d
46
48
(7
0
01)
e
44
22
(7
0
05)
f
efficiency
Z
d
,%
Specific
energy
consumption
4
18
(7
0
00)
a
4
52
(7
0
01)
b
4
62
(7
0
02)
c
4
71
(7
0
01)
d
4
86
(7
0
00)
e
5
10
(7
0
01)
f
Q
s
,M
J
k
g
1
[H
2
O]
Valu
es
in
par
enthe
sis
indica
te
the
st
andard
de
viatio
n.
Du
ncan
groupin
gs;
The
same
lett
ers
w
ithin
the
same
row
are
not
significan
tly
differ
ent
at
a
prob
abil
ity,
P
o
0
05.
MICROWAVE DRYING OF PARSLEY
411

(i) About 95% increase in drying efficiency and about
18% (092 MJ kg
1
[H
2
O]) decrease in specific
energy consumption could be obtainable by working
at 12857 g material load instead of 6430 g.
(j) In order to maximise the benefits of micro-
wave drying, further studies are required at lower
power outputs with different microwave power
cycles.
Acknowledgements
This study was supported by the Research Founda-
tion of Mustafa Kemal University (Project no: 04 B
1001).
References
Araszkiewicz M; Koziol A; Oskwarek A; Lupinski M (2004).
Microwave drying of porous materials. Drying Technology,
22(10), 2331–2341
Beaudry C; Raghavan G S V; Rennie T J (2003). Microwave
finish drying of osmotically dehydrated cranberries. Drying
Technology, 21(9), 1797–1810
Bouraout M; Richard P; Durance T (1994). Microwave and
convective drying of potato slices. Journal of Food Process
Engineering, 17, 353–363
Bushbeck E; Keiner E; Klinner J (1967). Trocknungsphysika-
lische und wa¨rmetechnische Untersuchung zur Trocknung
von Pfefferminze. [Physical and thermal properties effecting
drying characteristics of peppermint.] Archiv fu¨r Land-
technik, 2, 163–200
Chandra P K; Singh R P (1995). Applied Numerical Methods
for Food and Agricultural Engineers. CRC Press, Boca
Raton, FL pp. 163–167.
Changrue V; Sunjka P.S.; Gariepy Y; Raghavan G.S.V; Wang
N (2004). Real-time control of microwave drying process.
Drying 2004—Proceedings of the 14th International Drying
Symposium (IDS 2004). Sa˜o Paulo, Brazil, 22–25 August
2004, Vol. B, pp 941–948
Drouzas E; Tsami E; Saravacos G D (1999). Microwave/
vacuum drying of model fruit gels. Journal of Food
Engineering, 28, 203–209
Ertekin C; Yaldiz O (2004). Drying of eggplant and selection of
a suitable thin layer drying model. Journal of Food
Engineering, 63, 349–359
Fumagalli F; Silveira A.M (2004). Quality evaluation of
microwave dried Packman’s Triumph pear. Drying 2004—
Proceedings of the 14th International Drying Symposium
(IDS 2004). Sa˜o Paulo, Brazil, 22–25 August 2004, Vol. C,
pp 2069–2076
Funebo T; Ohlsson T (1998). Microwave-assisted air dehydra-
tion of apple and mushroom. Journal of Food Engineering,
38(3), 353–367
Go¨gu¨s F; Maskan M (2001). Drying of olive pomace by a
combined microwave-fan assisted convection oven. Nah-
rung/Food, 45(2), 129–132
Gunasekaran S (1990). Grain drying using continuous and
pulsed
microwave
energy.
Drying
Technoloy,
8(5),
1039–1047
Gunasekaran S (1999). Pulsed microwave-vacuum drying of
food materials. Drying Technology, 17(3), 395–412
Hayes G D (1987). Food Engineering Data Handbook.
Longman Scientific and Technical, England
Henderson S M (1974). Progress in developing the thin-layer
drying equation. Transactions of the ASAE, 17, 1167–1168/
1172
Henderson S M; Pabis S (1961). Grain drying theory I:
temperature effect on drying coefficient. Journal of Agri-
cultural Research Engineering, 6, 169–174
Kaensup W; Chutima S; Wongwises S (2002). Experimental
study on drying chilli in a combined microwave-vacuum-
rotary drum dryer. Drying Technology, 20(10), 2067–2079
Khraisheh M A M; Cooper T J R; Magee T R A (1997).
Microwave and air drying I. Fundamental considerations
and assumptions for the simplified thermal calculations of
volumetric power absorption. Journal of Food Engineering,
33, 207–219
Maskan M (2000). Microwave/air and microwave finish drying
of banana. Journal of Food Engineering, 44, 71–78
Maskan M (2001). Drying, shrinkage and rehydration
characteristics of kiwifruits during hot air and microwave
drying. Journal of Food Engineering, 48, 177–182
Midilli A; Kucuk H; Yapar Z (2002). A new model for single-
layer drying. Drying Technology, 20(7), 1503–1513
Moreno J; Chiralt A; Escriche I; Serra J A (2000). Effect of
blanching/osmotic dehydration combined methods on qual-
ity and stability of minimally processed strawberries. Food
Research International, 33, 609–616
Mousa N; Farid M (2002). Microwave vacuum drying of
banana slices. Drying Technology, 20(10), 2055–2066
Mowlah G; Takano K; Kamoi I; Obara T (1983). Water
transport mechanism and some aspects of quality changes
during air dehydration of bananas. Lebensmittel Wissen-
shaft und Technologie, 16, 103–107
Mudgett R E (1982). Electric properties of foods in microwave
processing. Food Technology, 36(2), 109–115
Mu¨ller J; Reisinger G; Mu¨hlbauer W (1989). Trocknung von
Heil- und Gewu¨rzpflanzen mit Solarenergie im Folienge-
wa¨chshause. [Drying of medicinal and aromatic plants in a
greenhouse solar dryer.] Landtechnik, 2, 58–65
Nijhuis H H; Torringa H M; Muresan S; Yuksel D; Leguijt C;
Kloek W (1998). Approach to improving the quality of dried
fruit and vegetables. Trends in Food Science and Technol-
ogy, 9, 13–20
Nindo C I; Sun T; Wang S W; Tang J; Powers J R (2003).
Evaluation of drying technologies for retention of physical
quality and antioxidants in asparagus (Asparagus officinalis
L. ). Lebensmittel Wissenschaft und Technologie, 36,
507–516
O’Callaghan J R; Menzies D J; Bailey P H (1971). Digital
simulation of agricultural dryer performance. Journal of
Agricultural Engineering Research, 16, 223–244
Page, G (1949). Factors influencing the maximum rates of air
drying shelled corn in thin layers. MSc Thesis, Purdue
University, Indiana, USA
Parker, J.C (1999). Developing a Herb and Spice Industry in
Callide Valley, Qeensland. A report for the Rural Industries
Research and Development Corporation (RIRDC). RIRDC
Publication No: 99/45, RIRDC Project No: DAQ-194A.
Available online at
Prabhanjan D G; Ramaswamy H S; Raghavan G S V (1995).
Microwave assisted convective air drying of thin layer
carrots. Journal of Food Engineering, 25, 283–293
ARTICLE IN PRESS
Y. SOYSAL ET AL.
412

Raghavan G.S.V; Rennie T.J; Sunjka P.S; Orsat V; Pha-
phuangwittayakul W; Terdtoon P (2004). Energy aspects of
novel techniques fore drying biological materials. Drying
2004—Proceedings of the 14th International Drying Sym-
posium (IDS 2004). Sa˜o Paulo, Brazil, 22–25 August 2004,
Vol. B, pp. 1021–1028
Sharaf-Elden Y I; Blaisdell J L; Hamdy M Y (1980). A model
for ear corn drying. Transactions of the ASAE, 5,
1261–1265
Sharma G P; Prasad S (2001). Drying of garlic (Allium
sativum) cloves by microwave–hot air combination. Journal
of Food Engineering, 50, 99–105
Shivhare U S; Raghavan G S V; Bosisio R G; Mujumdar A S
(1992). Microwave drying of corn III. Constant power,
intermittent operation. Transactions of the ASAE, 35(3),
951–957
Shivhare U S; Raghavan G S V; Bosisio R G; Mujumdar A S;
Van de Voort F R (1990). Drying corn in microwave
environment with varying initial moisture contents. Inter-
national Winter Meeting, Heating of Foods Technical
Session, Chicago IL, 18–21 Decembre 1990. ASAE Paper
No. 90-6605, St Joseph MI.
Soysal Y (2004). Microwave drying characteristics of parsley.
Biosystems Engineering, 89(2), 167–173
Soysal Y; O¨ztekin S (2001). Technical and economic perfor-
mance of a tray dryer for medicinal and aromatic plants.
Journal of Agricultural Engineering Research, 79(1), 73–79
Tog˘rul I T; Pehlivan D (2002). Mathematical modelling of
solar drying of apricots in thin layers. Journal of Food
Engineering, 55, 209–216
Torringa E; Esveld E; Scheewe I; van den Berg R; Bartels P
(2001). Osmotic dehydration as a pre-treatment before
combined microwave–hot-air drying of mushrooms. Journal
of Food Engineering, 49, 185–191
Tulasidas T N; Raghavan G S V; Mujumdar A S (1995).
Microwave drying of grapes in a single mode cavity at
2450 MHz—II. Quality and energy aspects. Drying Tech-
nology, 13(8–9), 1973–1992
Tulasidas T N; Raghavan G S V; Norris E R (1993). Microwave
and convective drying of grapes. Transactions of the ASAE,
36, 1861–1865
Tulasidas T N; Ratti C; Raghavan G S V (1997). Modelling of
microwave drying of grapes. Canadian Agricultural En-
gineering, 39(1), 57–67
Venkatesh M S; Raghavan G S V (2004). An overwiev of
microwave processing and dielectric properties of agri-food
materials. Biosystems Engineering, 88(1), 1–18
Verma L R; Bucklin R A; Endan J B; Wratten F T (1985).
Effects of drying air parameters on rice drying models.
Transactions of the ASAE, 28, 296–301
Wang C.Y; Singh R.P (1978). A single layer drying equation
for rough rice. ASAE Paper No: 78-3001, ASAE, St. Joseph,
MI
Yagcioglu A; Degirmencioglu A; Cagatay F (1999). Drying
characteristics of laurel leaves under different drying
conditions. Proceedings of the 7th International Congress
on Agricultural Mechanization and Energy in Agriculture,
pp 565-569. Adana, Turkey, 26–27 May
Yaldız O; Ertekin C (2001). Thin layer solar drying of some
different vegetables. Drying Technology, 19(3), 583–596
Yongsawatdigul
J;
Gunasekaran
S
(1996).
Microwave–
vacuum drying of cranberries:—Part I: energy use and
efficiency. Journal of Food Processing and Preservation, 20,
121–143
ARTICLE IN PRESS
MICROWAVE DRYING OF PARSLEY
413
Document Outline
- Microwave Drying of Parsley: Modelling, Kinetics, and Energy Aspects
Wyszukiwarka
Podobne podstrony:
Far infrared and microwave drying of peach (Jun Wang, Kuichuan Sheng)
Far infrared and microwave drying of peach (Jun Wang, Kuichuan Sheng)
027 Drying of Potato, Sweet Potato and Other Roots
Drying kinetics and drying shrinkage of garlic subjected to vacuum microwave dehydration (Figiel)
Drying kinetics and drying shrinkage of garlic subjected to vacuum microwave dehydration (Figiel)
Drying kinetics and quality of vacuum microwave dehydrated garlic cloves and slices
Drying kinetics and rehydration characteristics of microwave vacuum and convective hot air dried mus
Drying kinetics and quality of beetroots dehydrated by combination of convective and vacuum microwav
Thin layer modelling of the convective, microwave, microwave convective and microwave vacuum drying
Drying, shrinkage and rehydration characteristics of kiwifruits during hot air and microwave drying
Microwave–vacuum drying kinetics of carrot slices (Zheng Wei Cui, Shi Ying Xu, Da Wen Sun)
Modelling of dehydration rehydration of orange slices in combined microwaveair drying
Modeling and minimizing process time of combined convective and vacuum drying of mushrooms and parsl
Characterization of microwave vacuum drying and hot air drying of mint leaves (Mentha cordifolia Opi
Effect of vacuum microwave drying on selected mechanical and rheological properties of carrot
Microwave drying characteristics of potato and the effect of different microwave powers on the dried
A comparative study on heat pump, microwave and freeze drying of fresh fruits
więcej podobnych podstron