
Manual for the use of the
Cognitive Emotion Regulation Questionnaire
A questionnaire measuring cognitive copingstrategies
Nadia Garnefski
Vivian Kraaij
Philip Spinhoven

© Copyright 2002 N.Garnefski, V.Kraaij, P.Spinhoven and DATEC (Leiderdorp, The Netherlands)
All rights reserved. No part of this publication may be reproduced, stored in a retrieval system, or
transmitted, in any form or by any means, electronic, mechanical, photocopying, recording or
otherwise, without the prior written permission of the publisher.

Manual for the use of the
Cognitive Emotion Regulation Questionnaire
A questionnaire measuring cognitive copingstrategies
Nadia Garnefski
Vivian Kraaij
Philip Spinhoven


1
Preface
This manual has been brought about as a result of a generally prevailing need for a questionnaire
that would be able to measure people's cognitive coping strategies separately from the behavioural
aspects of coping. The CERQ and its corresponding manual are the result of a project which having
started some three years ago will also require our attention in the years to come. Without the
effort of many others we would certainly not have succeeded in developing this questionnaire,
producing the manual and obtaining norm tables. Therefore, we wish to thank everyone who
directly or indirectly took part in bringing about this manual, especially all students who assisted
and thought along with us while collecting our data, the Koning Willem I College in Den Bosch and
all other schools that participated in our study, the Rijngeest Group in Leiden (formerly: Jelgersma
Policlinic), the Delft general practitioners' practice, as well as all secondary school students and
others who on a voluntary basis participated in our study and completed our questionnaire.
In the years to come we will continue our validity research. We therefore ask those who will use
this instrument in the future, to inform us of the results obtained and their (positive and negative)
experiences with this questionnaire. We will be grateful for any comments and suggestions.
Nadia Garnefski
Vivian Kraaij
Philip Spinhoven
∗
Leiden University
Division of Clinical and Health Psychology
P.O. Box 9555, 2300 RB Leiden
E-mail: Garnefski@fsw.leidenuniv.nl

2

3
Contents
Preface.....................................................................................................
1
Chapter 1: Introduction.................................................................................
5
Background.......................................................................................
5
Chapter 2: Description of the CERQ..................................................................
7
Meaning of the CERQ scales....................................................................
7
Description of the CERQ items................................................................. 8
Administering the CERQ........................................................................
9
Instructions for completing the CERQ.......................................................
9
Scoring the CERQ................................................................................
10
Using the CERQ in different populations.....................................................
10
Using the CERQ for diagnostic purposes...................................................... 10
Using the CERQ for scientific purposes....................................................... 11
Chapter 3: Description of the norm groups.........................................................
13
Chapter 4: Psychometric Properties of the CERQ.................................................
15
Dimensional structure of the CERQ...........................................................
15
Internal consistency: Cronbach's alpha....................................................... 17
Item-rest correlations........................................................................... 17
Stability (test-retest reliabilities)............................................................
19
Correlations between the CERQ scales.......................................................
20
Factorial validity................................................................................
20
Discriminative properties......................................................................
22
Construct validity...............................................................................
22
Chapter 5: Standardization of the CERQ............................................................
29
Interpreting the CERQ scale scores...........................................................
29
Group differences: means and standard deviations of the norm groups...............
29
Standardization..................................................................................
30
Norm tables....................................................................................... 30
Instruction for use of the norm tables.......................................................
31
Interpretation of scores on the CERQ scales................................................
32
References................................................................................................. 35
APPENDIX: CERQ Norm Tables.........................................................................
37

4

5
Chapter1
Introduction
The CERQ (Cognitive Emotion Regulation Questionnaire) is a multidimensional questionnaire
constructed in order to identify the cognitive coping strategies someone uses after having
experienced negative events or situations. Contrary to other coping questionnaires that do not
explicitly differentiate between an individual's thoughts and his or her actual actions, the present
questionnaire refers exclusively to an individual's thoughts after having experienced a negative
event. The CERQ is a very easy to administer, self-report questionnaire consisting of 36 items. The
questionnaire has been constructed both on a theoretical and empirical basis and measures nine
different cognitive coping strategies. The CERQ makes it possible to identify individual cognitive
coping strategies and compare them to norm scores from various population groups. In addition, the
questionnaire offers the opportunity to investigate relationships between the use of specific
cognitive coping strategies, other personality variables, psychopathology and other problems.
The CERQ can be administered in normal populations and clinical populations, both with adults and
adolescents aged 12 years and over. The CERQ can be used to measure someone's general cognitive
style as well as someone's cognitive strategy after having experienced a specific event. The
questionnaire has a Dutch and an English version.
Background
The regulation of emotions through cognitions is inextricably associated with human life. Cognitions
or cognitive processes help people regulate their emotions or feelings and not get overwhelmed by
the intensity of these emotions, for example during or after experiencing a negative or stressful life
event. Cognitive processes can be divided into unconscious (e.g. projection or denial) and conscious
cognitive processes, such as self-blame, other-blame, rumination and catastrophizing. The CERQ
focuses on the latter category, i.e. the self-regulating, conscious cognitive components of emotion
regulation. Although not many studies have explicitly addressed the cognitive side of emotion
regulation, within general coping research some attention has been given to these strategies.
A generally accepted definition of coping is given by Monat & Lazarus (1991, p.5) as “an individual's
efforts to master demands (conditions of harm, threat or challenge) that are appraised (or
perceived) as exceeding or taxing his or her resources”. It is common use to distinguish two major
functions of coping: 1) problem-focused coping, which comprises all coping strategies directly
addressing the stressor; and 2) emotion-focused coping, which includes the coping strategies aimed
at regulating the emotions associated with the stressor (Compas, Orosan & Grant, 1993). In general,
problem-focused coping strategies are considered to be more functional than emotion-focused
coping strategies (Thoits, 1995).
Although the above division of coping strategies refers to a generally accepted and much used
division and many coping instruments are based on it, it gives rise to a major conceptual problem,
i.e. that the division into problem-focused and emotion-focused coping is not the only dimension by
which coping strategies can be classified.

6
In fact, there is another major dimension that goes right across the boundaries of this division,
namely the cognitive (what you think) versus the behavioural (what you do) dimension (see also
Holahan, Moss & Schaeffer, 1996). An example of cognitive problem-oriented coping is 'making
plans'; an example of behavioural problem-oriented coping is 'taking immediate action'. Although
'making plans' (thinking about what you will do) and 'taking action' (actually acting) clearly refer to
different processes that are used at different moments in time, and 'making plans' does not always
mean that they will actually be carried out, generally speaking they are categorized under one and
the same dimension. As for the existing coping instruments it therefore applies that most coping
scales are composed of a mixture of cognitive and behavioural coping strategies, until now it has
not been possible to measure cognitive coping strategies separately from the behavioural coping
strategies. Although in the past few decades the relationship between the various coping strategies
and psychopathology has clearly been established (for reviews, see: Compas, Connor-Smith,
Saltzman, Harding Thomsen & Wadsworth, 2001; Endler & Parker, 1990; Thoits, 1995), it has hardly
resulted in insight into the extent to which certain influences could be specifically attributed to the
cognitive aspects of coping. Although considerable attention has been given to cognitive processes
as regulating mechanisms for certain developmental processes, as yet we do not know much of the
degree to which cognitive coping strategies regulate emotions and how it influences the course of
emotional processing after having experienced negative life events.
The CERQ has been developed in order to fill in this gap. The CERQ therefore measures 'cognitive'
coping strategies exclusively, separate from the 'behavioural' coping strategies.

7
Chapter 2
Description of the CERQ
The CERQ is a self-report questionnaire measuring cognitive coping strategies of adults and
adolescents aged 12 years and more. In other words, with the help of this questionnaire it can be
assessed what people think after having experienced a negative or traumatic event.
Cognitive coping strategies are defined here as strategies for cognitive emotion regulation, that is,
regulating in a cognitive way the emotional responses to events causing the individual emotional
aggravation (Thompson, 1991).
Cognitive coping strategies are assumed to refer essentially to rather stable styles of dealing with
negative life events, however not to such an extent that they can be compared to personality
traits. It is assumed that in certain situations people may use specific cognitive strategies, which
may divert from the strategies they would use in other situations. It may also be assumed that
potentially cognitive coping strategies can be influenced, changed, learned or unlearned, for
example through psychotherapy, intervention programmes or one’s own experiences.
Meaning of the CERQ scales
The CERQ distinguishes nine different cognitive coping strategies, of which, independently from
one another, clinical psychological literature has established their association with
psychopathology. These are:
1. Self-blame, referring to thoughts of blaming yourself for what you have experienced (Anderson,
Miller, Riger & Sedikides, 1994);
2. Acceptance, referring to thoughts of resigning to what has happened (Carver, Scheier &
Weintraub, 1989);
3. Rumination, referring to thinking all the time about the feelings and thoughts associated with
the negative event (Nolen-Hoeksema, Parker & Larson,1994);
4. Positive Refocusing, which refers to thinking of other, pleasant matters instead of the actual
event (Endler & Parker, 1990);
5. Refocus on Planning, or thinking about what steps to take in order to deal with the event
(Carver, et al., 1989; Folkman & Lazarus, 1989);
6. Positive Reappraisal, or thinking of attaching a positive meaning to the event in terms of
personal growth (Carver, et al, 1989; Spirito, Stark & Williams, 1988);
7. Putting into Perspective or thoughts of playing down the seriousness of the event when
compared to other events (Allan & Gilbert, 1995);
8. Catastrophizing, referring to explicitly emphasizing the terror of the experience (Sullivan,
Bishop and Pivik, 1995); and
9. Other-blame, referring to thoughts of putting the blame for what you have experienced on
others (Tennen & Affleck, 1990).

8
Description of the CERQ items
The questionnaire consists of 36 items, each referring exclusively to what someone thinks and not
to what someone actually does, when experiencing threatening or stressful life events. The items
are divided up proportionally over the nine scales, so that all CERQ subscales consist of 4 items.
Below the names of the subscales with their matching items (numbers corresponding with the
numbers of the items in the questionnaire itself) are given.
1) Self-blame
1. I feel that I am the one to blame for it
10. I feel that I am the one who is responsible for what has happened
19. I think about the mistakes I have made in this matter
28. I think that basically the cause must lie within myself
2) Acceptance
2. I think that I have to accept that this has happened
11. I think that I have to accept the situation
20. I think that I cannot change anything about it
29. I think that I must learn to live with it
3) Rumination
3. I often think about how I feel about what I have experienced
12. I am preoccupied with what I think and feel about what I have experienced
21. I want to understand why I feel the way I do about what I have experienced
30. I dwell upon the feelings the situation has evoked in me
4) Positive Refocusing
4. I think of nicer things than what I have experienced
13. I think of pleasant things that have nothing to do with it
22. I think of something nice instead of what has happened
31. I think about pleasant experiences
5) Refocus on Planning
5. I think of what I can do best
14. I think about how I can best cope with the situation
23. I think about how to change the situation
32. I think about a plan of what I can do best
6) Positive Reappraisal
6. I think I can learn something from the situation
15. I think that I can become a stronger person as a result of what has happened
24. I think that the situation also has its positive sides
33. I look for the positive sides to the matter
7) Putting into Perspective
7. I think that it all could have been much worse
16. I think that other people go through much worse experiences
25. I think that it hasn’t been too bad compared to other things
34. I tell myself that there are worse things in life

9
8) Catastrophizing
8. I often think that what I have experienced is much worse than what others have experienced
17. I keep thinking about how terrible it is what I have experienced
26. I often think that what I have experienced is the worst that can happen to a person
35. I continually think how horrible the situation has been
9) Other-blame
9. I feel that others are to blame for it
18. I feel that others are responsible for what has happened
27. I think about the mistakes others have made in this matter
36. I feel that basically the cause lies with others
Administering the CERQ
The CERQ can be administered both individually and in groups, using a computer or a pen-and-
paper version. The room in which the questionnaire will be completed needs to offer good
conditions for the subjects to concentrate: no distractions, no interfering noise, sufficient light,
and in the case of administration in a group, a placing so that there is enough room to complete the
questionnaire undisturbed and in private. As a rule, completing the CERQ takes less than 10
minutes.
Instructions for completing the CERQ
The CERQ can be used to measure cognitive coping styles as well as to measure a specific response
to a specific event. In order to assess which cognitive coping strategies people usually use when
experiencing something-unpleasant (cognitive coping style) the following (standard) instruction is
given at completion:
Everyone gets confronted with negative or unpleasant experiences and everyone responds to
them in his or her own way. By the following questions, you are asked to indicate what you
generally think, when you experience negative or unpleasant events. Please read the
sentences below and indicate how often you have the following thoughts by circling the
most suitable answer.
To assess which cognitive coping strategies people use when dealing with a specific event,
situation, trauma or illness, the instruction is adjusted to the specific circumstances. An example of
a specific (standard) instruction to be given at completion:
You have experienced (fill in the specific event). More people have had similar experiences,
and everyone deals with them in his or her own way. By means of the following questions,
you are asked what you think about experiencing (fill in specific event). Please read the
sentences below and indicate how often you have the following thoughts by circling the
most suitable answer.
Explain clearly that completing the questionnaire is about people's own views and that right or
wrong answers do not exist.

10
Scoring the CERQ
When completing the questions subjects themselves indicate on a five-point scale to which extent –
'(almost) never' (1), 'sometimes' (2), 'regularly' (3), 'often' (4), or '(almost) always' (5) – they make
use of certain cognitive coping strategies.
Of the 4 items included in a scale a sum score is made (simple straight count), which can range
from 4 (never used) to 20 (often used cognitive coping strategy). Not more than 1 of the 4 items
included in a scale may be 'missing'. In that case, the 'missing' score is replaced by the average of
the three remaining scores. In this manner, even in the case of a missing value, a scale score
ranging from 4 to 20 is obtained.
Using the CERQ in different populations
The CERQ is suitable for use in different populations such as adolescents, adults, elderly people,
students and psychiatric patients. Besides, experience has been gained in administering the
questionnaire to groups of various educational backgrounds. It has also turned out that the CERQ
can be very well administered in a number of specific populations, such as chronically ill
adolescents, individuals with fear of flying, groups of people characterized by having experienced
similar types of traumatic events (stalking, foot-and-mouth crisis).
The CERQ is also available in a Dutch version (Garnefski, Kraaij & Spinhoven, 2002).
Using the CERQ for diagnostic purposes
The CERQ can be used to diagnose individuals, with the purpose of assessing to which extent
someone deviates from his or her norm group regarding the use of the nine specific cognitive coping
strategies. In this manner the extent can be assessed to which someone uses adaptive and non-
adaptive cognitive coping strategies when dealing with negative events. This information can be
important to decide about the aim and content of treatment. For example, a starting point for
treatment could be to unlearn non-adaptive cognitive coping strategies and to learn adaptive
strategies.
Empirical research with the CERQ shows that especially the extents of Rumination, Catastrophizing
and Self-blame are related to reporting symptoms of psychopathology. These apparently non-
adaptive types of cognitive coping could therefore be an important line of approach for prevention
and/or treatment. Also, outcomes of the above research suggest a sort of 'protective' effect from
other cognitive coping strategies, such as Positive Reappraisal and Positive Refocusing. These could
perhaps be good starting points to learn functional cognitive coping strategies (Garnefski, Boon, &
Kraaij, 2003; Garnefski, van den Kommer, Kraaij, Teerds, Legerstee & Onstein, 2002
a
; Garnefski,
Kraaij & Spinhoven, 2001
a
; Garnefski, Kraaij & Spinhoven, 2001
b
; Garnefski, Legerstee, Kraaij, van
den Kommer & Teerds, 2002
c
; Garnefski, Teerds, Kraaij, Legerstee & van den Kommer, 2003;
Kraaij, Garnefski & van Gerwen, 2003; Kraaij, Garnefski, de Wilde, Dijkstra, Gebhardt, Maes & ter
Doest; 2003; Kraaij, Pruymboom & Garnefski, 2002).

11
Using the CERQ for scientific purposes
A major motive underlying scientific research is the identification of risk factors and protective
factors associated with the development and continuation of emotional and behavioural problems.
So far, empirical research involving the CERQ has demonstrated that cognitive coping strategies
themselves, i.e. without the behavioural component, are very well capable of predicting a
considerable part of the variance in scores of depression, anxiety and suicidality (e.g., Garnefski et
al, 2001
a
; Garnefski et al, 2001
b
; Garnefski et al, 2002
a
). This suggests, therefore, that the
cognitive side of coping is an important component deserving further research in a conceptually
unadulterated manner, i.e. without being mixed with behavioural components. It also suggests that
cognitive coping strategies should play an important and central role in theoretical models intended
to explain mental health problems.
The outcomes of the research carried out so far show that for various problems it is true that
symptom 'promoting' and 'protective' cognitive coping strategies can be identified. This is an
important finding, suggesting that in order to obtain a proper picture of the relationship between
cognitive coping and emotional dysfunctioning the combined action of the different strategies
requires further investigation. In this regard it could be of importance to investigate to what extent
cognitive coping profiles can be distinguished as well as the relationship between certain profiles
and psychopathology. For instance, the outcomes of the above research suggest that the presence
of symptoms of depression, anxiety or suicidality could point at the use of – perhaps long-
established – non-adaptive cognitive coping strategies like Rumination, Catastrophizing and Self-
blame.

12

13
Chapter 3
Description of the norm groups
Table 1 gives an overview of the norm groups used in this manual. Below, four samples from the
general population are listed: 1) 586 adolescents 13-to-15 years of age; 2) 986 adolescents 16-to-18
years of age; 3) 611 adults from the general population, 18-to-65 years of age; and 4) 99 individuals
aged 66 years and over. In addition, data were collected from 218 adult psychiatric patients aged
18-to-65 years (5). From the Adults General Population follow-up data have also been collected.
Table 1: CERQ norm groups
Sample
Males
Females
Follow-up?
1. Early Adolescents (13-15)
253
333
-
2. Late Adolescents (16-18)
417
562
-
3. Adults General Population (18-65)
242
369
yes
4. Elderly People (66-97)
51
47
-
5. Psychiatric Patients(18-65)
92
121
-
Below, more specific information is given with regard to the data collection and characteristics of
the above samples.
1) Early Adolescents
The data for this sample have been collected at three different secondary schools in the west of
the Netherlands. This group completed the questionnaires during school hours in their own
classroom, under the supervision of a teacher and two psychology students. The study took place in
March 1998. The sample consisted of 586 adolescents aged between 13 and 15 years. The mean age
was 13 years and 11 months, the standard deviation being 0.69. There were 253 (43%) boys and 333
(57%) girls. The division over the various educational levels was as follows: 21 (4%) pupils attending
lower vocational education (VBO), 104 (18%) pupils attending lower secondary general education
(MAVO), 229 (39%) pupils attending higher general secondary education (HAVO) and 232 (40%) pupils
attending pre-university education (VWO). The sample consisted of second and third grade pupils.
2) Late Adolescents
This sample comes from a large school for intermediate vocational education in the south-east of
the Netherlands. Here, too, the questionnaires were completed at school, under the supervision of
two psychology students. This survey was carried out in October 1999. The sample consisted of 986
adolescents in the age group 16-to-18 years. The mean age was 16 years, 11 months, the standard
deviation being 0.75. There were 417 (43%) boys and 562 (57%) girls, all of whom were first-year
students.

14
3) Adults General Population
This sample comes from the directory of a family practice in a medium-sized town in the west of
the Netherlands. Following a written mailing in January 2000, 611 people aged between 18 and 65
years participated in the study on an individual basis. 242 (40%) of them were male and 369 (60%)
female. The mean age was 41 years, 11 months, the standard deviation being 11.51. Of the
respondents 383 (63%) individuals indicated to be married, engaged or living together. 216 (35%)
were either single or divorced. The educational level ranged from primary school (4%), lower
vocational (LBO) or lower general secondary education (MAVO/MULO) (20%), intermediate
vocational education (MBO) (16%), higher general secondary and pre-university education
(HBS/MMS/HAVO/VWO) (11%), to higher vocational and university education (48%).
From this sample follow-up data were collected after 14 months, again by means of a written
mailing. 290 individuals participated, of which 109 (38%) were male and 181 (62%) female.
4) Elderly People
This group comes from an earlier sample of people aged 65 years and over from the municipal
directory of a medium-sized town in the west of the Netherlands. Following a written mailing and a
telephone call in March 2000, 99 people aged 66-to-97 years participated individually in the survey.
52% of them were female, 48% male. The mean age was 77 years, 2 months, the standard deviation
being 6.12. Of the respondents 50 (52%) indicated to be married or living together, 41 (42%) had
been widowed, and 6 (6%) were divorced or had never married. The majority (92%) lived on their
own, the others lived in an old people's home (3%), sheltered accommodation (3%) or in different
conditions (2%).
5) Psychiatric Patients
The data of this group were collected among outpatients of a psychiatric institution in the west of
the Netherlands. With this group, completing the CERQ was part of a larger set of questionnaires
that they had to fill out before the interview on admission to this clinic. For that reason the
questionnaire was completed on an individual basis. The survey took place between November 1999
and June 2001. 218 people aged 18-to-65 years participated, of whom 92 (43%) were male and 121
(57%) female. The mean age was 35 years, 8 months, the standard deviation being 11.32. Of the
respondents 113 (53%) indicated to be married, engaged or living together, 101 (47%) people were
either widowed, single or divorced. The educational level ranged from primary school (16%), lower
vocational (LBO) or lower general secondary education (MAVO/MULO) (32%), intermediate
vocational education (MBO) (10%), higher general secondary and pre-university education
(HBS/MMS/HAVO/VWO) (22%), to higher vocational and university education (18%).

15
Chapter 4
Psychometric properties of the CERQ
This chapter deals with various aspects concerning the internal structure, reliability and validity of
the CERQ.
Dimensional structure of the CERQ
First of all, in order to define the dimensional structure a Principal Component Analysis with
Varimax-rotation on item level was performed for the group of Early Adolescents aged 13-to-15
years, as this was the first group involved in a publication about the CERQ (Garnefski et al., 2001
a
;
Garnefski et al., 2001
b
; Garnefski et al., 2002
a
). The factor loadings matrix for this group is
represented in Table 2. This table shows all factor loadings >.40. From the curves of the plotted
eigenvalues it appeared that the nine-factor solution was quite justifiable. Eight factors had an
eigenvalue > 1, while the ninth factor had an eigenvalue of .97. The values of the communalities
ranged from .47 to .74. In the population of Early Adolescents the nine factors together explained
in all 64.4% of the variance. Table 2 shows also that the factors found were consistent with the
intended nine-factor structure. Almost all items included in one and the same dimension on a
theoretical basis, turned out to actually load on one and the same dimension on an empirical basis,
in most cases with a factor loading exceeding .40. Some deviations from the proposed structure
were found, though. For instance, one of the items of the scale 'Other-blame' loaded .34, i.e.
below .40. Also, the scales Refocus on Planning and Positive Reappraisal turned out to show some
overlap. Two of the items that theoretically should load on the dimension belonging to the other
items of Positive Reappraisal, appeared to load much stronger on the dimension made up by the
items belonging to Refocus on Planning. The two remaining items of the Positive Reappraisal scale
did indeed have a high factor loading on 'their own' dimension. This overlap could be explained by
strong correlations between items of the Refocus on Planning and Positive Reappraisal scales. For
further interpretation it is important to examine carefully whether the two scales separately still
show enough internal consistency.
In a further phase of the study the generalisability of these factors was examined. For this purpose
Principal Component Analyses were also performed for the remaining populations we studied,
namely the Late Adolescents (age 16-18), the Adults General Population (age 18-65), the Elderly
People (age 66-97) and the Psychiatric Patients (age 18-65). The Principal Component Analysis of
the Late Adolescents showed that in this group nine factors explained 62.2% of the variance. The
factor structure in this group proved to be roughly similar to the group of Early Adolescents. In this
group, too, the first two items of Positive Reappraisal ended up on one dimension with Refocus on
Planning, while the two remaining items of Positive Reappraisal made up their own dimension.
Apart from this, no deviations from the intended structure were found in this group, while almost
all factor loadings belonging to the dimension in question had values exceeding .40.
With the Adults the nine factors also explained a considerable part of the variance (68.1%). Here,
too, almost all factors were in accordance with the proposed structure, with factor loadings which
all turned out to exceed .59. The only deviation from the structure (also compared with the Early
Adolescents group) was that in the Adults group all items belonging to the Refocus on Planning and
Positive Reappraisal scales ended up on one dimension.
Here again, it is true that a careful inspection of the internal consistency of the two scales is
important.

16
Table 2: Factor loadings PCA after Varimax rotation, Early Adolescents age 13-15 years
Components
1
2
3
4
5
6
7
8
9
Self-blame
CERQ1
.72
CERQ10
.77
CERQ19
.57
CERQ28
.80
Acceptance
CERQ2
.66
CERQ11
.69
CERQ20
.59
CERQ29
.69
Rumination
CERQ3
.78
CERQ12
.73
CERQ21
.61
CERQ30
.60
Positive Refocusing
CERQ4
.81
CERQ13
.81
CERQ22
.66
CERQ31
.65
Refocus on Planning
CERQ5
.65
CERQ14
.62
(.44)
CERQ23
.50
(.41)
CERQ32
.59
Positive Reappraisal
CERQ6
.62
(.28)
CERQ15
.60
(.04)
CERQ24
.64
CERQ33
.58
Putting into Perspective
CERQ7
.72
CERQ16
.67
CERQ25
.55
CERQ34
.67
Catastrophizing
CERQ8
.58
CERQ17
.69
CERQ26
.77
CERQ35
.59
Other-blame
CERQ9
.78
CERQ18
.54
CERQ27
(.46)
(.34)
CERQ36
.79

17
With the Elderly People the nine factors explained 69.8% of the variance. As with the Adults group,
with this group the items belonging to the Refocus on Planning and Positive Reappraisal scales
turned out to have ended up on one dimension. Furthermore, with this group the items belonging
to Rumination and Catastrophizing also appeared to load on one and the same dimension. The
remaining dimensions were fully in accordance with the intended structure, with factor loadings of
.40 and more.
With the Psychiatric Patients group yet again the general tendency was confirmed that items
belonging to the Refocus on Planning and Positive Reappraisal scales loaded on one dimension. All
of the remaining items turned out to load on the intended dimension, in all cases with a factor
loading exceeding .40. In this group the percentage of explained variance was 68.1%
From the various Principal Component Analyses there clearly emerge comparable pictures. In all
cases the dimensions explain over 60% of the variance. In most cases the dimensions are in full
accord with the scales established on a theoretical basis. The only consistent exception is the
overlap between the items belonging to the Refocus on Planning and Positive Reappraisal scales. In
most cases these items ended up on one and the same dimension. This is probably due to the rather
strong correlation between these two scales (varying from .62 with the Early Adolescents to .75
with the Elderly People). However, the internal consistency coefficients in the next section
demonstrate that the two scales in question can in fact be distinguished as two separate, reliable
scales. Also on a theoretical basis it is important to keep distinguishing these two subscales clearly
as two different concepts. While the concept of Refocus on Planning clearly focuses on thinking
about what steps to take in order to cope with the event (action-oriented), the concept of Positive
Reappraisal focuses on attributing a positive meaning to the event in terms of personal growth
(emotion-oriented). Also in the existing literature in the field of coping the two concepts are
clearly distinguished from each other. Still, the Principal Components Analyses and the correlation
analyses make it clear that the two concepts are closely linked. Therefore, this is certainly
important to take into account when interpreting the scores.
Internal consistency: Cronbach's alpha
To assess the internal consistency of the nine CERQ scales alpha coefficients were computed in all
research populations, the outcomes of which are given in Table 3. Generally speaking it can be
concluded that the alpha coefficients of the various subscales across the diverse populations can be
called good to very good (in most cases well over .70 and in many cases even over .80). Even the
lowest values, like .68 for Self-blame with the Late Adolescents and .68 for Other-blame with the
Early Adolescents are still acceptable when the number of items per scale is considered.
Item-rest correlations
Also, to assess the degree to which a certain item fits with the rest of the scale the item-rest
correlations were computed for the different groups (i.e. the correlations between an item and the
total score of the corresponding scale without adding the item involved). Table 4 gives an overview
of these item-rest correlations by indicating for each research population which range of item-rest
correlations has been found. Most item-total correlations turn out to be well over .40, whereas the
lowest value is not less than .35. These results confirm yet again that the scales are homogenous
and no items within the scales can be pointed at that would not fit and/or had better be removed.

18
Table 3: Cronbach’s alpha coefficients of the CERQ scales in five subgroups
Subscales (4 items per scale)
Early
Adolescents
Alpha
Late
Adolescents
Alpha
Adults
Alpha
Elderly
People
Alpha
Psychiatric
Patients
Alpha
Self-blame
.81
.68
.75
.77
.85
Acceptance
.80
.73
.76
.82
.72
Rumination
.83
.79
.83
.78
.81
Positive Refocusing
.81
.78
.85
.82
.81
Refocus on Planning
.81
.76
.86
.77
.84
Positive Reappraisal
.72
.76
.85
.80
.81
Putting into Perspective
.79
.76
.82
.76
.81
Catastrophizing
.71
.74
.79
.80
.80
Other-blame
.68
.73
.82
.80
.83
Table 4: Item-rest correlations of the nine CERQ scales in five subgroups (range of values)
Subscales
Early
Adolescents
Item-rest
correlation
Late
Adolescents
Item-rest
correlation
Adults
Item-rest
correlation
Elderly People
Item-rest
correlation
Psychiatric
Patients
Item-rest
correlation
Self-blame
.59-.61
.35-.53
.48-.61
.50-.70
.67-.72
Acceptance
.49-.65
.44-.62
.38-.65
.56-.66
.38-.61
Rumination
.62-.70
.57-.62
.62-.69
.57-.62
.50-.71
Positive Refocusing
.61-.65
.48-.64
.62-.72
.51-.75
.59-.65
Refocus on Planning
.61-.66
.53-.60
.67-.72
.45-.63
.63-.75
Positive Reappraisal
.47-.55
.52-.59
.65-.72
.56-.68
.60-.66
Putting into Perspective
.58-.64
.49-.59
.56-.74
.48-.66
.55-.66
Catastrophizing
.41-.58
.44-.63
.41-.71
.45-.68
.45-.65
Other-blame
.43-.52
.46-.58
.59-.71
.54-.75
.57-.74

19
Stability (test-retest reliabilities)
The CERQ was administered twice to the Adults General Population. Therefore, the data of this
group have been used to compute the test-retest correlations. There was a 14-month interval
between the two measurements. For the interpretation of the test-retest data it is, therefore,
important to take into account this relatively long intervening period of time, because it is
reasonable to assume that in such an interval a change of circumstance will occur more easily or
more often than had there been a shorter intervening period of time. Table 5 shows the results of
test-retest correlations and paired t-tests.
The test-retest correlations range between .48 (Refocus on Planning) and .65 (Other-blame). These
values suggest that we are talking about reasonably stable styles, although certainly not
comparable to personality traits. This is confirmed by the outcomes of the paired t-tests, which
test whether the mean individual difference scores of the first and second measurements deviate
significantly from zero. Without a Bonferroni correction, in a number of cases a small, though
significant, difference turned out to exist between someone's pre- and post-measurement. After
the Bonferroni correction, the correction which needs to be applied to correct for the chance of
finding accidental differences when performing multiple bivariate t-tests, the existence of a
significant difference between pre-and post-measurement appeared to hold for only one of the nine
cognitive coping strategies. When using the Bonferroni correction, the normally applicable criterion
for significance, i.e. p<.05, is divided by the number of tests carried out, namely nine. The result,
the value of .006, is then used as the criterion to define whether a p-value found is significant or
not (p<.006). This significant difference concerns the cognitive coping strategy Acceptance. The
other mean difference scores do not significantly deviate from zero after the Bonferroni correction.
These findings correspond with the expectations that hold for the concept of cognitive coping
strategies and support the assumption that although cognitive coping strategies refer to personal
coping styles, it should potentially be possible to influence, change, learn and unlearn them. This is
an important point for mental health intervention. To obtain a definite answer about the degree of
stability of cognitive coping strategies, though, more data would have to be collected in different
research groups, with shorter intervening periods between test and retest.
Table 5: Test-retest reliabilities of the CERQ scales after14 months (Adults General Population age 18-65 years)
Subscales
r
1-2
N
Measurement
1
M (sd)
Measurement
2
M (sd)
t-test
(paired)
Self-blame
.54***
287
8.22 (2.95)
8.61 (3.03)
-2.30*
Acceptance
.49***
287
11.03 (3.51)
10.41 (3.25)
3.06**
Rumination
.60***
287
10.50 (3.73)
10.10 (3.57)
2.06*
Positive Refocusing
.51***
285
9.91 (3.45)
9.75 (3.46)
0.77
Refocus on Planning
.48***
287
13.08 (3.87)
12.59 (3.58)
2.23*
Positive Reappraisal
.57***
287
12.45 (4.06)
12.34 (3.70)
0.52
Putting into Perspective
.55***
288
11.63 (3.90)
11.23 (3.76)
1.82
Catastrophizing
.62***
287
6.07 (2.45)
6.01 (2.49)
0.45
Other-blame
.65***
287
6.37 (2.70)
6.02 (2.39)
2.79**
*: p<.05; **: p<.01; ***: p<.001

20
Correlations between the CERQ scales
In order to examine the extent to which the nine CERQ subscales are interrelated, Pearson
correlation coefficients have been computed for all populations. Table 6 presents an overview of
the correlations between the CERQ scales for all populations studied, indicating in bold print the
highest and lowest values found respectively. Generally speaking the correlations pattern
corresponds fairly well between the five groups. Yet, on the whole the adolescent groups show
slightly higher correlations between the scales, whereas with the Elderly People and Psychiatric
Patients the scales correlate somewhat less. For the research involving the CERQ it is especially
important that on the whole correlations be not too high, i.e. not structurally exceeding .70 to .80.
Table 6 shows that generally correlations range between .30 and .70 (moderately high to
substantial). Only for the correlation between Refocus on Planning and Positive Reappraisal two
values exceeding .70 are found, but for the correlation between these two subscales, too, it holds
that the majority of coefficients does not exceed .70 (the mean correlation being .67). The table
clearly demonstrates that some scales are less strongly interrelated than others. This can be
explained by the fact that some concepts are simply more closely related than others. As
mentioned before, the strongest relation has been found between Refocus on Planning and Positive
Reappraisal. Also, relatively high correlations were discovered for the relationship between Positive
Reappraisal and Putting into Perspective (a mean correlation of .58). For the remaining
combinations of scales the mean correlation coefficient values were less than .50. In general,
therefore, it can be concluded that the intercorrelations of the CERQ scales support the CERQ's
multidimensionality.
Factorial validity
The factor analyses in the various populations have already shown that apart from a few
exceptions the factor structure was almost invariant across the various subgroups. This finding
points to factorial validity of the CERQ scales. As the different populations at the same time
represent diverse age groups, it may also be concluded that the factor structure is also almost
invariant with respect to age. In order to examine the factorial validity with respect to gender, the
whole Early Adolescents group, the whole Late Adolescents group and the whole Adults General
Population group were divided into a male and a female group. Next, the factor structures obtained
in these groups were compared. This was not done for the Elderly People group nor the Psychiatric
Patients group, because division resulted in sample groups of less than 100 which would render the
factor analysis less reliable.
The results demonstrated that the CERQ's 9-factor structure is also invariant with regard to gender.
Also, the overlap between Refocus on Planning and Positive Reappraisal was found in all groups.
The only exception was that in the Late Adolescents group some overlap between the factors of
Other-blame and Catastrophizing was found for the girls, while the boys showed some overlap
between Putting into Perspective, Planning and Positive Reappraisal. With the Early Adolescents
both for the boys and the girls 65% of the variance was explained, while for the men as well as the
women from the Adults population 69% of the variance was explained. With the Late Adolescents,
in the case of the girls 64% and the boys 62% respectively of the variance was explained.

21
Table 6: Pearson correlations between the nine CERQ scales for five subgroups (Range of values)
Subscales
Group
1
Self
r
Acc
r
Rum
r
PRef
r
Plan
r
PosR
r
Pers
r
Cat
r
Self-blame (Self)
1
-
2
-
3
-
4
-
5
-
Acceptance (Acc)
1
.49***
-
2
.41***
-
3
.37***
-
4
.40***
-
5
.33***
-
Rumination (Rum)
1
.55***
.57***
-
2
.46***
.56***
-
3
.41***
.38***
-
4
.31**
.55***
-
5
.34***
.34***
-
Positive Refocusing
(PRef)
1
.23***
.46***
.29***
-
2
.10**
.32***
.19***
-
3
.12**
.32***
.13**
-
4
.29**
.25*
.14
-
5
-.01
.23**
.13
-
Refocus on Planning (Plan)
1
.51***
.58***
.56***
.38***
-
2
.39***
.53***
.51***
.42***
-
3
.41***
.43***
.49***
.39***
-
4
.41***
.54***
.44***
.47***
-
5
.24**
.36***
.35***
.35***
-
Positive Reappraisal (PosR)
1
.40***
.46***
.42***
.44***
.62***
-
2
.27***
.51***
.38***
.47***
.71***
-
3
.37***
.43***
.34***
.49***
.69***
-
4
.38***
.48***
.31**
.51***
.75***
-
5
.24**
.38***
.18*
.48***
.57***
-
Putting into Perspective (Pers)
1
.42***
.53***
.41***
.49***
.49***
.52***
-
2
.33***
.46***
.25***
.44***
.52***
.65***
-
3
.32***
.40***
.14**
.52***
.46***
.61***
-
4
.46***
.47***
.30**
.37***
.55***
.58***
-
5
.36***
.38***
.11
.32***
.40***
.57***
-
Catastrophizing (Cat)
1
.33***
.36***
.52***
.22***
.30***
.22***
.17***
-
2
.38***
.27***
.48***
.07*
.21***
.12***
.06
-
3
.21***
.19***
.49***
.00
.06
-.06
-.06
-
4
-.20
.09
.44***
-.03
.00
-.11
-.16
-
5
.10
.11
.46***
-.06
-.01
-.13
-.20**
-
Other-blame
1
.32***
.35***
.39***
.30***
.40***
.38***
.29***
.42***
2
.25***
.20***
.29***
.13***
.22***
.18***
.18***
.54***
3
.09*
.18***
.33***
.04
.16***
-.01
.04
.49***
4
.00
.04
.07
.19
.28**
.28**
.17
.07
5
-.12
-.03
.29***
.03
-.01
-.08
-.06
.47***
***:p<.001; **:P<.01; *:P<.05
1
Group 1: Early Adolescents; Group 2: Late Adolescents; Group 3: Adults General Population; Group 4: Elderly People;
Group 5: Psychiatric Patients

22
Discriminative properties
In determining its validity the discriminative properties of a test are also of importance. That is,
when specific scales in specific populations are expected to show higher means, this should be
reflected in the differences between the mean scores. On the basis of the literature it is expected
for the CERQ that the Psychiatric Patients' mean scores should be higher especially on scales like
Rumination, Self-blame and Catastrophizing. Another expectation in keeping with general findings
in the literature would be that on most of the CERQ scales women should show higher mean scores
than men. Furthermore, we expect that with age the use of most cognitive strategies will also
increase. The next chapter on the standardization of the CERQ includes a table (Table 16)
representing the differences between means.
In the first place, Table 16 clearly shows that, as expected, the Psychiatric Patients score higher on
Self-blame, Rumination and Catastrophizing than the Adults of the General Population do.
Secondly, women do in fact show a higher mean score than men on most scales. Thirdly, the use of
most cognitive strategies seems to increase with age. On the other hand, with the Elderly People
the use of certain cognitive coping strategies seems to decrease somewhat. With these results,
therefore, the CERQ scales demonstrate that the discriminative properties are in agreement with
the expectations.
Construct validity
Below, the correlations between the CERQ scales and various measures considered relevant are
described, with the purpose of gaining insight into the CERQ's construct validity. The following
sections clearly show that the strongest correlations are found between a number of CERQ scales
and the scales of the Coping Inventory for Stressful Situations (CISS) that are related as regards
content. With respect to the correlations between the CERQ scales and other concepts it is shown
that on the whole they are in line with expectations. Moderate to fairly strong relations have been
found for a number of CERQ scales and Personality, Self Esteem and Self-Efficacy, which shows that
although related concepts are involved, the extent of their relation is not such that they can be
called the same concepts. Also, some clear relations have been found between a number of CERQ
scales and various Psychopathology indicators, which is an important finding from the point of
intervention and/or treatment.
The CERQ and the Coping Inventory for Stressful Situations (CISS)
For validation purposes both in the survey among Late Adolescents and the survey among Adults
General Population the CERQ has been administered simultaneously with the Coping Inventory for
Stressful Situation (CISS: Endler & Parker, 1990). Table 7 shows the correlations between the nine
CERQ subscales and the three CISS subscales, Task-oriented Coping, Emotion-oriented Coping and
Avoidance-oriented Coping. On the whole it can be stated that the picture of the correlations found
in the Late Adolescents group matches the correlations found in the Adults General Population
group and that the correlations between the CERQ and CISS subscales can be interpreted in a
theoretically meaningful manner.

23
Table 7: Correlations between the CERQ and the CISS
Coping subscales (CISS)
Task-oriented Coping
Emotion-oriented Coping
Avoidance-oriented Coping
CERQ subscales
Late-
Adolescents
Adults
Late-
Adolescents
Adults
Late-
Adolescents
Adults
Self-blame
.37***
.24***
.54***
.39***
.12***
.15***
Acceptance
.50***
.32***
.32***
.23***
.22***
.19***
Rumination
.44***
.28***
.56***
.50***
.24***
.29***
Positive Refocusing
.27***
.35***
.06
.06
.37***
.38***
Refocus on Planning
.68***
.70***
.30***
.17***
.32***
.28***
Positive Reappraisal
.64***
.59***
.14***
-.02
.33***
.35***
Putting into Perspective
.48***
.40***
.20***
.08*
.31***
.28***
Catastrophizing
.21***
-.03
.52***
.57***
.17***
.20***
Other-blame
.22***
.13**
.38***
.47***
.16***
.13**
*:p<.05; **:p<.01; ***:p<.001
In both groups – as expected - high correlations were found between the CERQ Refocus on Planning
and Positive Reappraisal subscales on the one hand and the CISS Task-oriented Coping subscale on
the other hand. These scales all reflect the active coping with or management of the problem. Also
Acceptance and Putting into Perspective had reasonably high correlations with Task-oriented
Coping.
Also high correlations were found between CERQ subscales Self-blame, Rumination and
Catastrophizing on the one hand and the CISS Emotion-oriented Coping subscale on the other, all
referring to a certain way of being preoccupied with your emotions and in general considered less
functional strategies. In addition, Other-blame showed a reasonably high correlation with Emotion-
oriented Coping.
Less high correlations were found between the CERQ scales and the Avoidance-oriented scale. A
fairly high correlation, though, was found between Avoidance-oriented Coping and the Positive
Refocusing scale, the latter of which can of course also be considered as a sort of avoidance.
The CERQ and the NEO 5-Factor Personality Test (NEO-FFI)
In order to examine the relationship between cognitive coping strategies and personality, the CERQ
has been administered to one of the research populations, i.e. the Adults General Population,
simultaneously with the NEO-FFI. The NEO measures the five factors of personality: neuroticism,
extraversion, openness to experience, altruism and conscientiousness (Hoekstra, Ormel & de Fruyt,
1996). Not too high correlations are expected to be found between the five personality factors and
the cognitive coping strategies, because cognitive coping strategies pretend to measure something
else than personality. Some relationship is expected, though, with the Neuroticism factor, because
generally speaking this concept shows a considerable overlap with depressive complaints and/or
psychopathology symptoms. The highest correlations are indeed found between the CERQ
Rumination, Catastrophizing and Other-blame scales on the one hand and Neuroticism on the other
hand (Table 8).

24
Table 8: Correlations between the CERQ and the NEO-FFI
Personality Subscales (NEO-FFI) – Adults
CERQ subscales
Neuroticism
Extraversion
Openness
Altruism
Conscientiousness
Self-blame
.12*
-.11
.14*
-.02
-.14*
Acceptance
.12*
-.11
.07
.09
.02
Rumination
.30***
-.08
.23***
.08
-.07
Positive Refocusing
-.08
.17**
.06
.13*
.03
Refocus on Planning
-.06
.11
.29***
.17**
.12*
Positive Reappraisal
-.20**
.28***
.24***
.20**
.14*
Putting into Perspective
-.07
.13*
-.03
.15*
.09
Catastrophizing
.41***
-.18**
-.07
-.07
-.15*
Other-blame
.35***
-.19**
-.03
-.18**
-.05
*:p<.05; **:p<.01; ***:p<.001
The CERQ and the Rosenberg Self-Esteem Scale
Furthermore, the relationship between cognitive coping strategies and Self-Esteem has been
examined by administering the CERQ to the Late Adolescents group simultaneously with the
Rosenberg Self-Esteem Scale (Rosenberg, 1965). The Rosenberg Self-Esteem Scale has one outcome
measure, in which a high score refers to a high self-esteem. Cognitive coping strategies that are
assumed to be less functional are expected to correlate negatively to the self-esteem measure,
whereas cognitive coping strategies considered to be more functional will not correlate or do so
positively. In Table 9 the correlations are represented. The results show that Self-blame,
Rumination and Catastrophizing do in fact correlate significantly and negatively with Self-Esteem,
whereas Positive Refocusing and Positive Reappraisal correlate with Self-Esteem positively and
significantly, although not very strongly.
Table 9: Correlations between the CERQ en de Rosenberg Self-Esteem Scale
CERQ subscales
Self-Esteem (SES) -
Late-Adolescents
Self-blame
-.31***
Acceptance
-.06
Rumination
-.24***
Positive Refocusing
.14***
Refocus on Planning
.04
Positive Reappraisal
.17***
Putting into Perspective
.07*
Catastrophizing
-.29***
Other-blame
-.14***
*:p<.05; **:p<.01; ***:p<.001

25
The CERQ and the Generalized Self-Efficacy Scale
In addition, in the Late Adolescents group the CERQ was administered simultaneously with
Schwartzer's (1993) Generalized Self-Efficacy Scale. A high score on the Self-Efficacy Scale refers to
a high extent of self-efficacy. Some relationship is expected to be found between the strategies
that are considered more positive and the measure of self-efficacy, while the strategies that are
considered more negative are assumed not correlate or to correlate negatively with this measure.
As expected, the highest correlations are found for Acceptance, Positive Refocusing, Refocus on
Planning and Putting into Perspective, while the concept seems hardly or not related to the use of
the 'more negative' strategies (Table 10).
Table 10: Correlations between the CERQ and the Generalized Self-Efficacy Scale
CERQ subscales
Self-Efficacy -
Late-Adolescents
Self-blame
.01
Acceptance
.24***
Rumination
.07*
Positive Refocusing
.23***
Refocus on Planning
.32***
Positive Reappraisal
.41***
Putting into Perspective
.29***
Catastrophizing
-.10**
Other-blame
.04
*:p<.05; **:p<.01; ***:p<.001
The CERQ and Depression (SCL-90/GDS)
In all five research populations the relationship with depression has been examined. For the Early
Adolescents, Late Adolescents, Adults General Population and Psychiatric Patients this was done by
administering the CERQ simultaneously with the Depression subscale of the SCL-90 (Arrindell &
Ettema, 1986; Derogatis, 1977). Only for the Elderly People depression has been measured with the
use of the GDS (Geriatric Depression Scale: Brink, Yesavage, Heersema, Adey & Rose, 1982) instead
of the SCL-90.
Relationships in the various populations are expected to correspond more or less. It is also expected
that the less functional strategies will correlate negatively to Depression, while the more functional
strategies will show a positive correlationship. On the whole, strong relationships appear to exist
between the Self-Blame (Elderly People excepted), Rumination and Catastrophizing strategies on
the one hand and Depression on the other hand. Regarding the 'more positive' strategies the
expectation is confirmed only for Adults and Elderly People that Positive Reappraisal has a negative
relationship with the measure of depression (see Table 11).

26
The CERQ and Anxiety (SCL-90)
In four of the five research populations also the relationship with Anxiety has been examined, i.e.
in the Early Adolescents, Late Adolescents, Adults General Population and Psychiatric Patients
groups. This was done by administering the CERQ simultaneously with the SCL-90 Anxiety subscale
(Arrindell & Ettema, 1986; Derogatis, 1977). Expectations here correspond to the expectations that
apply to the relationship between cognitive coping strategies and Depression. Here too, strong
relationships in all four groups appear to exist between the Self-blame, Rumination and
Catastrophizing strategies on the one hand and Anxiety on the other (see Table 12). In addition, as
regards the 'more positive' strategies a negative relationship between Positive Reappraisal and
Anxiety is found only for the Adults (see Table 12).
Table 11: Correlations between the CERQ and the SCL-90 Depression subscale / Geriatric Depression Scale
Depression (SCL-90) / Geriatric Depression Scale (GDS)
CERQ subscales
Early
Adolescents
Late
Adolescents
Adults
Elderly
People
Psychiatric
Patients
Self-blame
.49***
.41***
.26***
.01
.39***
Acceptance
.30***
.24***
.18***
.27*
.18**
Rumination
.54***
.45***
.44***
.42***
.44***
Positive Refocusing
.07
-.07*
-.07
-.15
-.10
Refocus on Planning
.28***
.12***
.01
-.01
-.01
Positive Reappraisal
.14**
-.02
-.15***
-.27*
-.06
Putting into Perspective
.22***
.03
-.09*
.07
.06
Catastrophizing
.36***
.43***
.57***
.46***
.43***
Other-blame
.16***
.23***
.33***
-.03
.28***
*:p<.05; **:p<.01; ***:p<.001
Table 12: Correlations between the CERQ and the SCL-90 Anxiety Scale
Anxiety (SCL-90)
CERQ subscales
Early
Adolescents
Late-
Adolescents
Adults
Psychiatric
Patients
Self-blame
.40***
.32***
.20***
.38***
Acceptance
.27***
.21***
.17***
.17*
Rumination
.54***
.36***
.35***
.45***
Positive Refocusing
.15***
-.02
-.02
-.08
Refocus on Planning
.29***
.13***
-.01
.06
Positive Reappraisal
.19***
.03
-.17***
.01
Putting into Perspective
.23***
.06
-.08*
.05
Catastrophizing
.26***
.38***
.54***
.45***
Other-blame
.15***
.21***
.29***
.23**
*:p<.05; **:p<.01; ***:p<.001

27
The CERQ at first measurement and Anxiety and Depression (SCL-90) at follow-up
Follow-up data have been collected from the Adults General Population. During this second
measurement the SCL-90 Depression and Anxiety scales have once again been administered
(Arrindell & Ettema, 1986; Derogatis, 1977). The correlations between the CERQ scales and the
Depression and Anxiety scores at follow-up are given in Table 13. The interval between first
measurement and follow-up amounted to 14 months. Despite this relatively long period of time a
number of CERQ subscales can very clearly predict Depression and Anxiety scores over a longer
period of time. Significantly positive relationships are found once more between Self-blame,
Rumination and Catastrophizing on the one hand and Depression and Anxiety on the other, with
Positive Reappraisal showing once more a significantly negative relationship with both SCL-90
subscales.
Table 13: Correlations between the CERQ and SCL-90 Depression and Anxiety scales at follow-up
CERQ subscales
Depression second
measurement
(SCL-90)
Adults
Anxiety second
measurement
(SCL-90)
Adults
Self-blame
.20**
.12*
Acceptance
.15*
.14*
Rumination
.28***
.27***
Positive Refocusing
-.04
-.05
Refocus on Planning
.02
-.01
Positive Reappraisal
-.13*
-.16**
Putting into Perspective
-.06
-.06
Catastrophizing
.47***
.52***
Other-blame
.32***
.33***
*:p<.05; **:p<.01; ***:p<.001
The CERQ and Hostility (SCL-90)
In two of the five research populations the relationship with hostility has also been examined,
namely in the Late Adolescents and the Psychiatric Patients groups. This has been done by
administering the CERQ simultaneously with the SCL-90 Hostility subscale (Arrindell & Ettema,
1986; Derogatis, 1977). Especially the Other-blame subscale was expected to show a correlation
with Hostility, which proved to be the case for both groups. In addition, for both groups
Catastrophizing, Self-blame, and Rumination also showed significant relationships with Hostility
(see Table 14).
The CERQ and other measures of Psychopathology (SCL-90)
The Psychiatric Patient group was the only research population to whom the whole SCL-90 was
administered (Arrindell & Ettema, 1986; Derogatis, 1977). Regarding Depression, Anxiety and
Hostility, we refer to the previous sections. The correlations between the remaining SCL-90
subscales with the CERQ are given in Table 15.

28
The picture that emerges is very clear: positive, significant relationships are found between the
CERQ Self-blame, Rumination, Catastrophizing and Other-blame scales on the one hand and the
various measures of Psychopathology on the other. There seems to be a sort of general relationship
between the use of specific cognitive strategies and various kinds of psychopathology. It is not
possible to indicate cognitive strategies that are or are not specifically related to certain forms of
psychopathology.
Table 14: Correlations between the CERQ and the SCL-90 Hostility subscale
Hostility (SCL-90)
CERQ subscales
Late-Adolescents
Psychiatric
Patients
Self-blame
.29***
.18*
Acceptance
.15***
.01
Rumination
.19***
.19**
Positive Refocusing
-.05
.02
Refocus on Planning
.09**
-.08
Positive Reappraisal
.04
-.10
Putting into Perspective
.05
-.03
Catastrophizing
.35***
.23**
Other-blame
.32***
.32***
*:p<.05; **:p<.01; ***:p<.001
Table 15: Correlations between the CERQ and the remaining SCL-90 scales
Other Psychopathology measures (SCL-90) – Psychiatric Patients
CERQ subscales
Phobic
Anxiety
Somatization
Obsession-
Compulsion
Interpersonal
Sensitivity
Sleeping
Disturbances
Global
Severity
Self-blame
.17*
.27***
.34***
.30***
.20**
.39***
Acceptance
.02
.12
.15*
.08
.13
.16*
Rumination
.28***
.34***
.43***
.40***
.30***
.47***
Positive Refocusing
-.11
-.01
.01
-.08
-.09
-.07
Refocus on Planning
-.13
.00
.05
.00
.02
.00
Positive Reappraisal
-.12
.05
.06
-.06
.05
-.02
Putting into Perspective
-.10
.03
.14*
-.01
.01
.04
Catastrophizing
.41***
.36***
.36***
.43***
.33***
.48***
Other-blame
.15*
.17*
.25***
.40***
.21**
.31***
*:p<.05; **:p<.01; ***:p<.001

29
Chapter 5
Standardization of the CERQ
Interpreting the CERQ scale scores
To all CERQ scales it applies that the higher the score on a specific subscale, the more the person
in question uses this cognitive coping strategy. Of course, in different research populations
different means and standard deviations are found. In the following section on group differences
these data of the different norm groups are represented.
Group differences: means and standard deviations of the norm groups
The means and standard deviations of the various research populations are listed in Table 16, the
data for males and females being presented separately.
Table 16: Means and standard deviations of the five subgroups for each CERQ subscale
Subscales
Early
Adolescents
Late
Adolescents
Adults
Elderly People
Psychiatric
Patients
Males
Females
Males
Females
Males
Females
Males
Females
Males
Females
Self-blame
M
6.81
7.57
7.78
8.20
8.37
8.21
7.94
6.89
10.44
10.88
sd
2.83
2.87
2.69
2.96
2.83
3.19
2.87
3.59
4.33
4.39
Acceptance
M
8.60
9.18
9.66
10.48
10.43
10.89
11.93
12.44
11.34
11.97
sd
3.53
3.12
3.51
3.53
3.67
3.58
4.64
4.52
3.47
3.74
Rumination
M
7.11
8.83
8.34
10.26
9.49
10.80
8.81
10.13
11.95
12.90
sd
2.70
3.58
3.34
3.68
3.56
3.86
3.46
3.47
4.30
3.88
Positive Refocusing
M
8.79
9.51
10.43
11.26
9.37
10.13
11.22
11.71
9.00
9.30
sd
3.49
3.29
3.81
3.65
3.70
3.51
4.26
3.81
3.42
3.20
Refocus on Planning
M
9.13
10.01
10.92
11.46
12.76
12.92
11.93
11.49
12.79
12.24
sd
3.73
3.39
3.73
3.45
3.85
3.88
4.10
3.49
4.19
3.83
Positive Reappraisal
M
8.38
8.67
10.91
10.93
11.86
12.45
11.33
10.92
10.03
10.40
sd
0.19
2.92
3.79
3.61
4.01
4.11
4.25
3.98
4.06
3.83
Putting into Perspective
M
8.89
9.48
10.55
10.93
11.29
11.62
11.83
11.91
9.81
10.62
sd
3.69
3.08
3.66
3.66
3.81
3.92
4.00
3.63
3.53
4.04
Catastrophizing
M
5.66
5.88
6.77
6.93
5.67
6.62
6.42
7.62
8.77
8.42
sd
2.13
2.34
2.71
3.05
2.31
3.02
3.46
3.16
3.88
3.77
Other-blame
M
6.10
5.84
7.04
6.34
6.20
6.53
5.82
6.23
7.67
7.26
sd
2.11
1.96
2.81
2.51
2.50
2.93
2.71
2.86
3.50
3.15

30
Comparison between the various groups clearly shows that the mean CERQ scale values can clearly
distinguish between the diverse research populations. The general picture emerging from the table
is that on the whole Late Adolescents make more use of the diverse cognitive coping strategies
than Early Adolescents and that in turn Adults make more use of the majority of cognitive coping
strategies than Late Adolescents. Exceptions are the Positive Refocusing, Catastrophizing and
Other-blame strategies, the use of which seems to have decreased somewhat in adulthood. To both
Early and Late Adolescents it applies that females make more use of all strategies, except for
Other-blame. Although the distinction between males and females seems to decrease as they grow
older, females keep making use of the majority of strategies more often than males. This does not
hold for Self-Blame. For Adults, aged 18-to-65 years, males report this strategy more often than
females. With the Elderly People, the use of some cognitive strategies seems to decrease, whereas
others are reported more often. For instance, there is less Self-Blame and Rumination, as opposed
to more Acceptance and Positive Refocusing. Still, a difference between males and females remains
visible. With the Psychiatric Patients the gender differences seem to be smaller. Compared to the
Adults General Population norm group the Psychiatric Patients group score considerably higher on –
among other things – the Self-Blame, Rumination and Catastrophizing strategies, whereas they
make less use of the Positive Refocusing, Positive Reappraisal and Putting into Perspective
strategies.
Standardization
In order to assess whether an individual uses a specific strategy more or less often in comparison to
other people, his or her raw score will have to be compared to the mean scores of the people in the
population comparable to him or her, the so-called norm group. The five research populations, i.e.
the Early Adolescents, the Late Adolescents, the Adults General Population, the Elderly People and
the Psychiatric Patients, are used as norm groups. For further descriptions of these norm groups we
refer to Chapter 3. For the females and males in these populations separate tables have been
made. Therefore, there are ten different tables in all. These norm tables are listed at the end of
this chapter, in the Appendix. How the norm tables have been developed and how they are to be
read, will be discussed in the following sections.
As for the interpretation regarding content as well as the practical meaning of the CERQ scales we
refer to the section 'Interpretation of scores on the CERQ scales' further on in this chapter.
Norm tables
Norm tables are made up by converting the distribution of raw scores in a specific research
population into normalised standard scores. In this case the t-distribution has been used. For the
conversion into t-scores, the raw scores are sorted out marking exactly those percentages belonging
to the standard score units in a normal distribution. In a t-distribution a mean of 50 and a standard
deviation of 10 are assumed. Each t-score represents a specific raw score, with the corresponding
percentage showing the chance of someone scoring less than or the same as the score in question.
A t-score of 50 corresponds to a (cumulative) chance of 50%. I.e., there is a 50% chance that
someone will obtain this score or less. A t-score of 30 matches 2 per cent. This indicates that
someone belongs to the bottom 2% who score such a low value. A cumulative chance percentage of
98 corresponds to a t-score of 70. I.e., when a person obtains this score, he or she belongs to the
uppermost 2% (100% minus 98%) who obtain such a high score, in other words 98% of the individuals
have scored less.

31
In order to simplify interpretation, the t-scores and their corresponding percentages can also be
expressed in stanines. Stanines are attributed to the different distribution segments in accordance
with the following table, also based on the standard distribution:
4%
7%
12%
17%
20%
17%
12%
7%
4%
Stanine
1
2
3
4
5
6
7
8
9
The fifth stanine is the middle segment of the distribution. When someone comes within the fifth
stanine, this indicates that this individual has obtained an 'average' score. Scores coming within the
fourth or sixth stanine can be considered as 'below average' and 'above average' respectively. The
third and seventh stanine represent 'low' and 'high' scores respectively, whereas scores that come in
either the first two or the last two stanines can be considered as 'very low' and 'very high'
respectively.
The research on the CERQ uses the above stanines in order to assess whether an individual has
obtained either an average, a high or a low score. Table 17 summarizes the general rules of thumb
that are applied in the CERQ research to assess norm scores:
Table 17: Interpretation of t-scores and stanines for the norm tables:
t-score
stanine
Interpretation
Score 62 and more
8 en 9
Very high score
Score 58 to 62
7
High score
Score 53 to 58
6
Above average score
Score 48 to 53
5
Average score
Score 43 to 48
4
Below average score
Score 39 to 43
3
Low score
Score 38 and less
1,2
Very low score
On the basis of t-scores, corresponding percentages and stanines, it has been assessed for each of
the five norm groups whether specific scores can be considered 'very low', 'low', 'below average',
'average', 'above average', 'high', 'very high'. This information has been classified in ten separate
norm tables (two for each norm group), that are to be found in the Appendix.
Instruction for use of the norm tables
When a specific score is found for an individual, the table concerned can be referred to in order to
assess whether this score is 'very low', 'low', 'below average', 'average', 'above average', 'high', 'very
high' in comparison to his or her norm group. For example: a boy aged 16 has scored 9 on the Self-
blame scale. In this case his score will have to be compared to the norm table for males aged 16-to-
18 years. Score 9 is looked up in the column below Self-blame. The right side of the table indicates
how this score must be interpreted. In this case, score 9 for Self-blame classifies under the 'above
average' category. This means that – in comparison to his age group and gender – this boy makes an
above average use of the Self-blame cognitive coping strategy.

32
Interpretation of scores on the CERQ scales
For all cognitive coping strategies high scores refer to frequent use of a specific strategy, whereas
low scores refer to less frequent use of this strategy. Whether a specific score found is high or low
in comparison to the norm group concerned, can be looked up in the norm tables. However, it is
always important, too, to set the score levels alongside the nature and seriousness of the events
experienced. Therefore, the norm tables should be considered especially as a means to assess the
degree to which an individual deviates from others with regard to his or her cognitive coping
strategies. The final decision about the extent to which it holds that for a certain individual it is
important to learn or unlearn specific cognitive coping strategies, will always have to be taken
from individual circumstances, taking into account the current context and problems. Below, the
interpretation as regards content of the nine different CERQ subscales is given.
Self-blame
Self-blame is a cognitive coping strategy in which thoughts are central of holding yourself
responsible for what you have experienced, putting the blame and/or the cause for what happened
on yourself and being preoccupied with thoughts about the mistakes you yourself have made. When
someone has obtained a high score on Self-blame, it means that this person is highly preoccupied
with his or her sense of guilt. A low score on Self-blame means that one is preoccupied to a low
extent with his or her sense of guilt.
A high extent of preoccupation with guilt can possibly be connected with symptoms of
psychopathology.
Acceptance
Acceptance refers to thoughts where you resign yourself to what has happened and accept it,
thinking that it cannot be changed and life goes on. A high score refers to the frequent use of
Acceptance as a strategy. A low score refers to a less frequent use of this strategy. Although in
itself Acceptance is a good process for most events, a very high level of Acceptance may also
indicate a sort of resignation in the sense of not feeling able anymore to influence events, a
negative feeling of 'not being able to change things anyhow'. A high level of Acceptance may
therefore refer to a negative form of resigning to the situation. In that case, a high score on
Acceptance could be connected to symptoms of psychopathology.
A low score on Acceptance, too, could be related to symptoms of psychopathology, certainly when
the latter can be connected to undigested events.
Rumination
Rumination refers to thinking all the time of and/or being preoccupied with the feelings and
thoughts associated with the negative event. A high score refers to the frequent use of Rumination
as a strategy. A low score refers to a less frequent use of this strategy. In processing negative life
events, a certain extent of Rumination is not uncommon. A high score on Rumination, however, is
almost certainly connected with having emotional problems or symptoms of psychopathology.

33
Positive Refocusing
This concept refers to thinking about other, pleasant matters instead of the event in question. A
high score refers to a frequent use of this strategy. A low score refers to a less frequent use of this
strategy. In general, research has shown that this strategy in itself may have a positive effect on
people's well being. In other words: a low score on Positive Refocusing could be related to a low
sense of emotional well being.
Refocus on Planning
Refocus on Planning refers to thinking about which steps to take in order to deal with the event or
thinking up a plan to change the situation. A high score refers to the frequent use of this strategy.
A low score refers to a less frequent use of this strategy. Essentially this is considered to be a
positive cognitive coping strategy, provided that the problem is actually dealt with. If an individual
scores high on this strategy, without acting, a high score could possibly be connected with
emotional problems (thoughts without action). On the other hand, a very low score on Refocus on
Planning is almost certainly related to the presence of problems.
Positive Reappraisal
This strategy refers to mentally attributing a positive meaning to an event in terms of personal
growth, thinking that the event makes you stronger, looking for the positive sides of an event. A
high score refers to the frequent use of Positive Reappraisal as a strategy. A low score refers to the
less frequent use of this strategy. Basically, this is seen as a positive coping strategy, but here, too,
it is only true provided that at the same time something is actually done about the problem at
hand. When an individual scores high on this strategy, without taking action, a high score could
possibly be connected with emotional problems.
A low degree of Positive Reappraisal could also be connected with problems.
Putting into Perspective
Putting into Perspective refers to thoughts that play down the seriousness of the event when
compared to other events and to emphasising in your mind that there are worse things in the world.
A high score refers to the frequent use of Putting into Perspective as a strategy. A low score refers
to a less frequent use of this strategy.
Catastrophizing
Catastrophizing refers to recurring thoughts about how terrible the event has been and about what
you have gone through being the worst thing to happen to a person, much worse than what others
experience. A high score refers to a frequent use of Catastrophizing as a strategy. A low score
refers to a less frequent use of this strategy. Generally speaking it applies that a high score on
Catastrophizing is almost certainly related with having emotional problems or symptoms of
psychopathology.
Other-blame
Other-blame refers to thoughts of putting the blame for what you have experienced on others,
holding others responsible for what has happened and/or thinking about the mistakes others have
made in this respect. A high score refers to the frequent use of this strategy. A low score refers to
the less frequent use of this strategy.

34

35
References
Allan, S., & Gilbert, P. (1995). A social comparison scale: psychometric properties and relationship
to psychopathology. Personality and Individual Differences, 19, 293-299.
Anderson, C. A., Miller, R. S., Riger, A. L., Dill, J. C., & Sedikides, C. (1994). Behavioral and
characterological styles as predictors of depression and loneliness: review, refinement, and
test. Journal of Personality and Social Psychology, 66, 549-558.
Arrindell, W. A., & Ettema, J. H. M. (1986). SCL-90. Manual for a multidimensional indicator of
Psychopathology (Handleiding bij een multidimensionele psychopathologie-indicator). Lisse,
The Netherlands: Swets & Zeitlinger.
Brink, T.L., Yesavage, J.A., Heersema, P.H., Adey, M. & Rose, T.L. (1982). Screening tests for
geriatric depression. Clinical Gerontologist, 1, 37-43.
Carver, C. S., Scheier, M. F., & Weintraub, J. K. (1989). Assessing coping strategies: a theoretically
based approach. Journal of Personality and Social Psychology, 56, 267-283.
Compas, B.E., Connor-Smith, J.K., Saltzman, H., Harding Thomsen, A. & Wadsworth, M.E. (2001).
Coping with stress during Childhood and Adolescence: problems, progress and potential in
theory and research. Psychological Bulletin, 127, 87-127.
Compas, B. E., Orosan, P. G., & Grant, K. E. (1993). Adolescent stress and coping: Implications for
psychopathology during adolescence. Journal of Adolescence, 16, 331-349.
Derogatis, L. R. (1977). SCL-90: Administration, Scoring and Procedures Manual-I for the R(evised)
Version. Baltimore: John Hopkins University School of Medicine, Clinical Psychometrics
Research Unit.
Endler, N. S. & Parker, J. D. A. (1990). Multidimensional assessment of coping: a critical evaluation.
Journal of Personality and Social Psychology, 58, 844-854.
Folkman, S., & Lazarus, R. S. (1988). Manual of the Ways of Coping Questionnaire. Palo Alto:
Consulting Psychologists Press.
------, N., Boon, S. & Kraaij, V. (2003). Relationships between cognitive strategies of adolescents and
depressive symptomatology across different types of life events. Journal of Jouth and
Adolescence, 32,401-408.
Garnefski, N., van den Kommer, T., Kraaij, V., Teerds, J., Legerstee, J., & Onstein, E. (2002
a
). The
relationship between cognitive emotion regulation strategies and emotional problems.
European Journal of Personality, 16, 403-420.
Garnefski, N., Kraaij, V. & Spinhoven, Ph. (2001
a
). Negative life events, cognitive emotion regulation
and depression. Personality and Individual Differences, 30, 1311-1327.
Garnefski, N., Kraaij, V. & Spinhoven, Ph. (2001
b
). The relationship between cognitive coping
strategies and symptoms of depression, anxiety and suicidality (De relatie tussen cognitieve
copingstrategieën en symptomen van depressie, angst en suïcidaliteit). Gedrag en
Gezondheid, 29, 166-176.
Garnefski, N., Kraaij, V. & Spinhoven, Ph. (2002
b
). Manual for the use of the Cognitive Emotion
Regulation Questionnaire: Dutch Version (Handleiding voor het gebruik van de Cognitive
Emotion Regulation Questionnaire). Leiderdorp, The Netherlands: DATEC
Garnefski, N., Legerstee, J., Kraaij, V., Van den Kommer, T., & Teerds, J. (2002
c
). Cognitive coping
strategies and symptoms of depression and anxiety: a comparison between adolescents and
adults. Journal of Adolescence, 25, 603-611.
Garnefski, N., Teerds, J. , Kraaij, V., Legerstee, J. & Van den Kommer, T. (2003). Cognitive
emotion regulation strategies and depressive symptoms: differences between males and
females. Personality and Individual Differences, 25, 603-611.
Hoekstra, H.A., Ormel, J. & de Fruyt, F. (1996). NEO Personality Questionaires: Manual (NEO
Persoonlijkheids vragenlijsten: Handleiding). Lisse: Swets & Zeitlinger.

36
Holahan, C. J., Moos, R. H., & Schaeffer, J. A. (1996). Coping, stress resistance and growth:
Conceptualizing adaptive functioning. In: M. Zeidner & N.S. Endler (Eds). Handbook of
coping. New York: John Wiley & Sons, Inc.
Kraaij, V., Garnefski, N. & van Gerwen, L. (2003). Cognitive coping and anxiety symptoms among
People who seek help for fear of flying. Aviation, Space, and Environmental Medicine, 74,
273-277.
Kraaij, V., Garnefski, N., Wilde, E.J. de, Dijkstra, A., Gebhardt, W., Maes, S., & Doest, L. ter
(2003). Negative life events and depressive symptoms in late adolescence: Bonding and
cognitive coping as vulnerability factors? Journal of Youth and Adolescence, 32, 185-193.
Kraaij, V., Pruymboom, E., & Garnefski, N. (2002). Cognitive coping and depressive symptoms in
the elderly: A longitudinal study. Aging & Mental Health, 6, 275-281.
Lazarus, R. & Folkman, S. (1984). Stress, appraisal and coping. New York: Springer.
Monat, A., & Lazarus, R. S. (1991). Stress and coping: an anthology. New York: Columbia University
Press.
Nolen-Hoeksema, S. , Parker, L. E., & Larson, J. (1994). Ruminative coping with depressed mood
following loss. Journal of Personality and Social Psychology, 67, 92-104.
Rosenberg (1965). Society and the Adolescent Self-Image. Princeton, New Jersey: Princeton
University Press.
Schwarzer, R. (1993). Measurement of perceived self-efficacy. Psychometric scales for cross-
cultural research. Berlin, Germany: Freie Universität Berlin.
Spirito, A., Stark, L. J., & Williams, C. (1988). Development of a brief coping checklist for use with
pediatric populations. Journal of Pediatric Psychology, 13, 555-574.
Sullivan, M. J. L., Bishop, S. R.,& Pivik, J. (1995). The Pain Catastrophizing Scale: development and
validation. Psychological Assessment, 7, 524-532.
Tennen, H., & Affleck, G. (1990). Blaming others for threatening events. Psychological Bulletin,
108, 209-232.
Thoits, P. A. (1995). Stress, coping, and social support processes: Where are we? What next?
Journal of Health and Social Behavior, (Extra Issue), 53-79.
Thompson, R. A. (1991). Emotional regulation and emotional development. Educational Psychology
Review, 3, 269-307.

37
APPENDIX
CERQ Norm tables
To assess whether a specific individual makes frequent or less frequent use of a specific cognitive
coping strategy in comparison to others, his or her raw score will need to be compared to the mean
scores of persons in the population comparable to him or her, the so-called norm group. In all, five
norm groups are available. Each of these has been divided into separate norm tables for males and
females. Therefore, there are 10 separate norm tables in all. How to use and/or interpret the norm
tables is explained in Chapter 5. The following pages list the norm tables of the following groups
respectively:
A. Early Adolescents, age 13-to-15 years: males
B. Early Adolescents, age 13-to-15 years: females
C. Late Adolescents, age 16-to-18 years: males
D. Late Adolescents, age 16-to-18 years: females
E. Adults General Population, age 18-to-65 years: males
F. Adults General Population, age 18-to-65 years: females
G. Elderly People, age 66 years and more: males
H. Elderly People, age 66 years and more: females
I. Psychiatric Patients, age 18-to-65 years: males
J. Psychiatric Patients, age 18-to-65 years: females
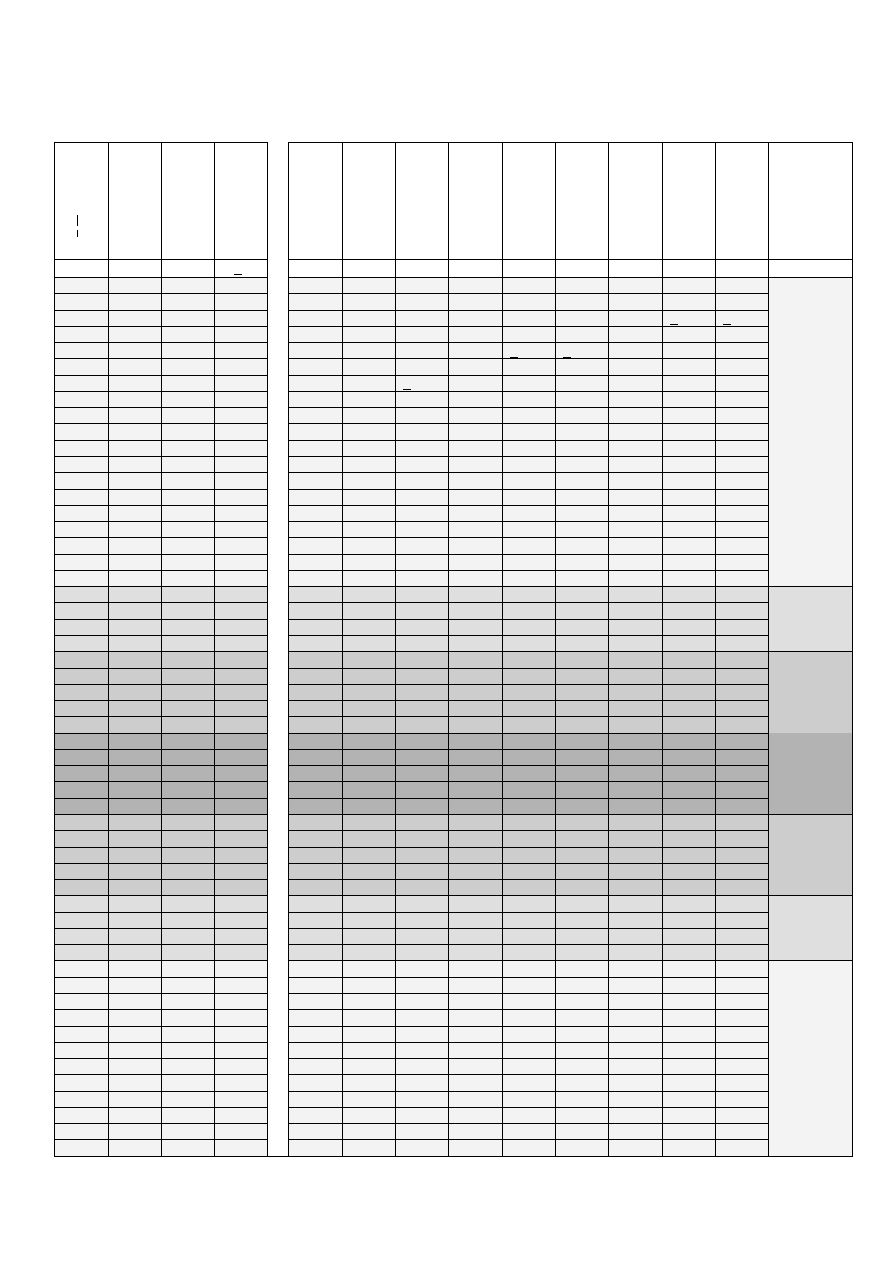
38
A. Norm group Early Adolescents age 13-to-15 years: males
P(z <
z)
t-score
stanin
e
distanc
e to M
(sd)
Self-blame
Acceptanc
e
R
umi
na
tion
Positive
Refocus
ing
Refocus on
Plan
nin
g
Positive
Rea
ppra
isal
Putting into
Perspectiv
e
Catastrop
hizi
ng
Other-blam
e
%ile
t
s
M+sd
99
80
9
+3s
99
79
9
99
78
9
20
>15
>16
99
77
9
99
76
9
20
20
>19
>18
99
75
9
18-19
20
14
13-15
99
74
9
>15
99
73
9
17
19
19
99
72
9
18
18
19
13
12
98
71
9
16
17
16-17
18
98
70
9
+2s
17-18
14
17
12
97
69
9
15
11
96
68
9
13
16
15
17
11
96
67
9
14
16
16
16
95
66
8
13
12
14
10
10
93
65
8
12
15
15
15
92
64
8
15
13
9
90
63
8
11
14
11
14
14
9
88
62
8
10
14
Very high
86
61
7
13
13
13
12
84
60
7
+1s
9
10
13
8
82
59
7
12
12
12
11
12
8
79
58
7
High
76
57
6
11
9
11
11
7
73
56
6
8
11
10
69
55
6
10
10
7
66
54
6
8
10
6
62
53
6
7
9
10
9
Above
Average
58
52
5
9
9
54
51
5
7
5
6
50
50
5
0
9
8
46
49
5
6
8
8
8
42
48
5
Average
38
47
4
6
8
5
34
46
4
7
7
7
7
31
45
4
5
27
44
4
5
7
24
43
4
6
6
6
Below
Average
21
42
3
6
6
4
18
41
3
5
16
40
3
-1s
5
4
14
39
3
5
5
Low
12
38
2
4
5
10
37
2
4
8
36
2
7
35
2
4
4
6
34
2
4
33
2
4
4
4
32
1
3
31
1
4
2
30
1
-2s
2
29
1
1
28
1
1
25
1
Very Low

39
B. Norm group Early Adolescents age 13-to15 years: females
P(z <
z)
t-score
stanin
e
distanc
e to M
(sd)
Self-blame
Acceptanc
e
R
umi
na
tion
Positive
Refocus
ing
Refocus on
Plan
nin
g
Positive
Rea
ppra
isal
Putting into
Perspectiv
e
Catastrop
hizi
ng
Other-blam
e
%ile
t
s
M+sd
99
80
9
+3s
99
79
9
20
20
20
>17
>15
99
78
9
99
77
9
>19
20
99
76
9
19
20
18-19
16
99
75
9
13-14
99
74
9
18
19
14-15
99
73
9
17-18
19
19
17
99
72
9
12
98
71
9
17
>17
98
70
9
+2s
16
18
18
18
16
13
11
97
69
9
15
16
17
96
68
9
17
15
12
10
96
67
9
14
16
95
66
8
15
16
17
14
16
11
93
65
8
13
15
10
9
92
64
8
12
14
15
16
13
15
90
63
8
14
15
14
9
88
62
8
11
13
14
Very High
86
61
7
13
14
12
84
60
7
+1s
10
13
13
8
8
82
59
7
12
79
58
7
12
12
13
11
12
High
76
57
6
9
11
7
73
56
6
11
11
12
11
7
69
55
6
10
10
66
54
6
10
11
10
62
53
6
8
10
6
6
Above
Average
58
52
5
9
9
54
51
5
9
9
10
9
50
50
5
0
46
49
5
7
8
9
5
42
48
5
8
5
Average
38
47
4
8
8
34
46
4
6
7
8
31
45
4
8
7
27
44
4
24
43
4
7
Below
Average
21
42
3
6
7
18
41
3
5
7
6
7
4
16
40
3
-1s
6
4
14
39
3
5
Low
12
38
2
6
6
10
37
2
6
5
8
36
2
5
7
35
2
6
34
2
4
5
5
4
33
2
4
5
4
32
1
3
31
1
4
4
2
30
1
-2s
2
29
1
4
1
28
1
4
1
25
1
4
Very Low

40
C. Norm group Late Adolescents age 16-to18 years: males
P(z <
z)
t-score
stanin
e
distanc
e to M
(sd)
Self-blame
Acceptanc
e
R
umi
na
tion
Positive
Refocus
ing
Refocus on
Plan
nin
g
Positive
Rea
ppra
isal
Putting into
Perspectiv
e
Catastrop
hizi
ng
Other-blam
e
%ile
t
s
M+sd
99
80
9
+3s
>18
>19
>19
99
79
9
99
78
9
17
99
77
9
20
18
18
99
76
9
16
20
99
75
9
20
17
99
74
9
19
17
99
73
9
15
18
20
20
16
16
99
72
9
19
17
20
19
15
15
98
71
9
14
18
98
70
9
+2s
16
19
19
14
14
97
69
9
17
18
19
18
96
68
9
13
15
18
13
13
96
67
9
16
17
18
17
95
66
8
14
17
17
12
12
93
65
8
12
15
16
11
92
64
8
13
16
16
11
90
63
8
14
16
88
62
8
11
12
15
15
10
Very High
86
61
7
13
15
15
10
84
60
7
+1s
10
14
14
14
14
9
82
59
7
11
9
79
58
7
12
13
13
High
76
57
6
9
10
13
13
73
56
6
11
12
12
8
69
55
6
12
12
8
66
54
6
10
9
11
11
62
53
6
8
11
7
Above
Average
58
52
5
10
11
54
51
5
9
8
10
7
50
50
5
0
10
10
6
46
49
5
7
9
9
6
42
48
5
8
7
9
9
Average
38
47
4
8
5
34
46
4
6
6
8
8
5
31
45
4
7
8
27
44
4
24
43
4
5
5
7
7
7
7
Below
Average
21
42
3
6
6
18
41
3
6
6
6
16
40
3
-1s
5
5
4
14
39
3
5
5
5
4
Low
12
38
2
4
10
37
2
4
8
36
2
7
35
2
4
6
34
2
4
4
4
4
33
2
4
4
32
1
3
31
1
2
30
1
-2s
Very Low

41
D. Norm group Late Adolescents age 16-to-18 years: females
P(z <
z)
t-score
stanin
e
distanc
e to M
(sd)
Self-blame
Acceptanc
e
R
umi
na
tion
Positive
Refocus
ing
Refocus on
Plan
nin
g
Positive
Rea
ppra
isal
Putting into
Perspectiv
e
Catastrop
hizi
ng
Other-blam
e
%ile
t
s
M+sd
99
80
9
+3s
20
99
79
9
99
78
9
99
77
9
99
76
9
20
20
16-19
99
75
9
20
20
20
99
74
9
20
20
19
15
99
73
9
20
99
72
9
19
18
98
71
9
17-18
19
17
14
98
70
9
+2s
16
19
19
19
19
16
97
69
9
15
18
19
13
96
68
9
14
18
18
18
15
96
67
9
18
14
12
95
66
8
17
17
18
17
13
11
93
65
8
13
17
17
12
10
92
64
8
16
16
17
90
63
8
12
16
16
11
88
62
8
15
16
16
9
Very High
86
61
7
15
10
84
60
7
+1s
11
14
15
15
15
82
59
7
14
15
9
79
58
7
10
13
14
14
14
8
High
76
57
6
13
14
73
56
6
12
13
13
8
69
55
6
9
12
13
13
12
66
54
6
12
7
62
53
6
11
11
12
7
Above
Average
58
52
5
12
11
54
51
5
8
10
11
11
6
50
50
5
0
10
11
46
49
5
10
10
10
6
42
48
5
9
9
Average
38
47
4
7
10
5
34
46
4
9
9
9
31
45
4
8
27
44
4
8
9
5
24
43
4
6
8
8
Below
Average
21
42
3
7
8
18
41
3
8
16
40
3
-1s
7
7
7
4
14
39
3
5
6
Low
12
38
2
7
7
10
37
2
6
6
4
8
36
2
5
6
7
35
2
5
6
6
34
2
4
6
5
5
4
33
2
4
4
32
1
5
5
3
31
1
2
30
1
-2s
4
2
29
1
4
1
27
1
4
4
4
Very Low

42
E. Norm group Adults General Population age 18-to-65 years: males
P(z <
z)
t-score
stanin
e
distanc
e to M
(sd)
Self-blame
Acceptanc
e
R
umi
na
tion
Positive
Refocus
ing
Refocus on
Plan
nin
g
Positive
Rea
ppra
isal
Putting into
Perspectiv
e
Catastrop
hizi
ng
Other-blam
e
%ile
t
s
M+sd
99
80
9
+3s
99
79
9
99
78
9
≥19
≥18
20
99
77
9
99
76
9
20
20
99
75
9
16-18
17
17-19
99
74
9
99
73
9
20
19
20
16
14-16
99
72
9
18
19
15
98
71
9
15
20
14
13
98
70
9
+2s
19
18
20
13
97
69
9
18
17
19
12
96
68
9
14
11
12
96
67
9
17
17
18
95
66
8
16
19
19
17
10
11
93
65
8
13
16
18
9
92
64
8
16
15
10
90
63
8
15
18
16
88
62
8
12
15
14
14
17
8
9
Very High
86
61
7
17
84
60
7
+1s
13
13
16
82
59
7
11
14
15
7
79
58
7
12
12
16
8
High
76
57
6
13
15
14
73
56
6
10
14
69
55
6
12
11
11
15
6
7
66
54
6
13
62
53
6
9
10
14
13
Above
Average
58
52
5
11
10
6
54
51
5
13
12
50
50
5
0
8
10
9
9
12
5
46
49
5
11
42
48
5
12
11
5
Average
38
47
4
9
8
10
34
46
4
7
8
10
31
45
4
11
27
44
4
8
7
9
24
43
4
7
10
9
Below
Average
21
42
3
6
8
18
41
3
7
6
6
9
4
16
40
3
-1s
8
4
14
39
3
5
7
Low
12
38
2
5
6
5
8
7
10
37
2
6
8
36
2
7
6
7
35
2
5
5
5
6
34
2
4
33
2
4
4
6
4
32
1
4
5
3
31
1
4
2
30
1
-2s
4
4
`
1
28
1
4
Very Low
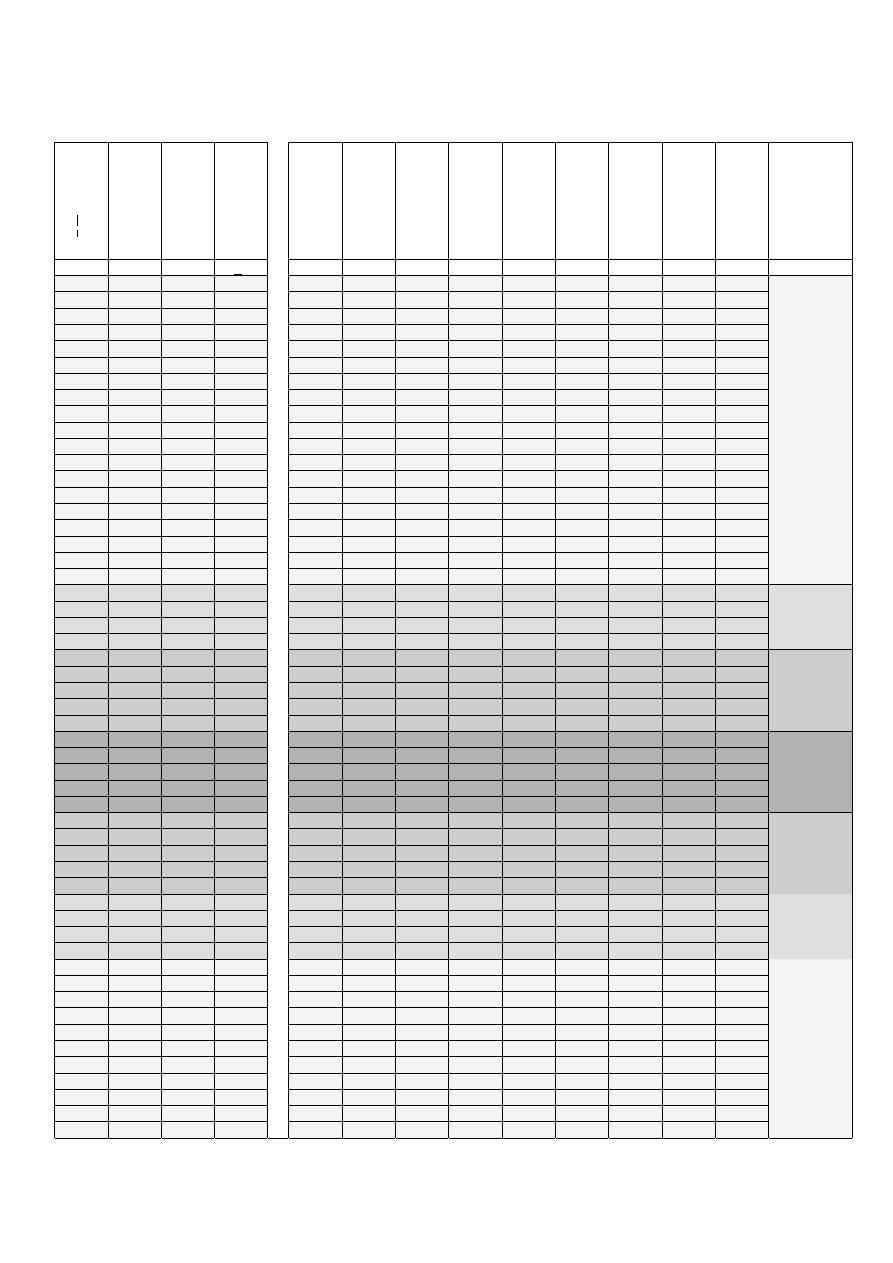
43
F. Norm group Adults General Population age 18-to-65 years: females
P(z <
z)
t-score
stanin
e
distanc
e to M
(sd)
Self-blame
Acceptanc
e
R
umi
na
tion
Positive
Refocus
ing
Refocus on
Plan
nin
g
Positive
Rea
ppra
isal
Putting into
Perspectiv
e
Catastrop
hizi
ng
Other-blam
e
%ile
t
s
M+sd
99
80
9
+3s
99
79
9
20
20
99
78
9
99
77
9
20
20
99
76
9
19
99
75
9
18-19
99
74
9
18
20
19
99
73
9
20
18
99
72
9
17
19
19
20
17
17
98
71
9
16
98
70
9
+2s
16
18
20
20
16
15
97
69
9
18
19
15
14
96
68
9
17
19
14
13
96
67
9
15
95
66
8
17
18
13
12
93
65
8
14
16
19
19
18
11
92
64
8
13
17
12
90
63
8
16
15
17
11
88
62
8
12
16
18
18
10
Very High
86
61
7
15
14
10
84
60
7
+1s
15
17
17
16
9
9
82
59
7
11
13
79
58
7
14
14
16
15
8
High
76
57
6
10
16
8
73
56
6
13
13
12
15
14
69
55
6
15
66
54
6
9
12
14
13
7
7
62
53
6
12
11
14
Above
Average
58
52
5
12
54
51
5
8
11
10
13
13
6
6
50
50
5
0
11
46
49
5
10
12
11
42
48
5
7
10
9
12
5
Average
38
47
4
11
5
34
46
4
9
9
10
31
45
4
11
10
27
44
4
6
8
8
9
24
43
4
8
Below
Average
21
42
3
10
9
18
41
3
7
8
16
40
3
-1s
5
7
9
8
4
14
39
3
7
4
Low
12
38
2
6
8
7
10
37
2
6
7
8
36
2
6
6
7
35
2
5
7
6
6
34
2
5
4
33
2
4
5
6
5
4
32
1
3
31
1
5
5
2
30
1
-2s
4
2
29
1
4
4
1
28
1
4
4
4
Very Low

44
G. Norm group Elderly People age 66 years and more: males
P(z <
z)
t-score
stanin
e
distanc
e to M
(sd)
Self-blame
Acceptanc
e
R
umi
na
tion
Positive
Refocus
ing
Refocus on
Plan
nin
g
Positive
Rea
ppra
isal
Putting into
Perspectiv
e
Catastrop
hizi
ng
Other-blam
e
%ile
t
s
M+sd
99
80
9
+3s
99
79
9
99
78
9
99
77
9
99
76
9
99
75
9
99
74
9
99
73
9
99
72
9
≥ 17
20
98
71
9
98
70
9
+2s
≥ 15
20
20
20
20
20
≥ 18
97
69
9
96
68
9
10-19
96
67
9
16
95
66
8
14
19
18-19
19
16-17
93
65
8
19
15
19
18
13-15
9
92
64
8
13
18
90
63
8
14
17
11-12
88
62
8
12
18
13
18
10
Very High
86
61
7
17
17
9
84
60
7
+1s
11
16-17
16
8
82
59
7
17
12
15
8
79
58
7
10
16
15
16
High
76
57
6
16
11
14
73
56
6
9
15
7
7
69
55
6
15
13
14
15
66
54
6
10
14
6
62
53
6
14
12
13
6
Above
Average
58
52
5
8
13
9
13
14
54
51
5
11
12
12
13
5
50
50
5
0
11-12
10
11
46
49
5
11
12
5
42
48
5
10
8
10
Average
38
47
4
7
9
10
34
46
4
9
11
31
45
4
9
7
9
27
44
4
6
24
43
4
6
8
10
Below
Average
21
42
3
8
8
4
18
41
3
5
9
4
16
40
3
-1s
5
8
14
39
3
7
7
8
Low
12
38
2
6
7
6
10
37
2
5
7
5
7
8
36
2
7
35
2
4
5-6
6
6
34
2
4
4
33
2
4
4
6
4
32
1
3
31
1
2
30
1
-2s
≤5
2
29
1
4
1
28
1
≤5
Very Low

45
H. Norm group Elderly People age 66 years and more: females
P(z <
z)
t-score
stanin
e
distanc
e to M
(sd)
Self-blame
Acceptanc
e
R
umi
na
tion
Positive
Refocus
ing
Refocus on
Plan
nin
g
Positive
Rea
ppra
isal
Putting into
Perspectiv
e
Catastrop
hizi
ng
Other-blam
e
%ile
t
s
M+sd
99
80
9
+3s
99
79
9
99
78
9
99
77
9
99
76
9
99
75
9
99
74
9
99
73
9
99
72
9
20
≥19
20
≥15
98
71
9
≥19
20
≥15
98
70
9
+2s
97
69
9
96
68
9
19
20
96
67
9
19
17-18
18-19
≥19
14
12-14
95
66
8
16-18
93
65
8
13-18
92
64
8
11-12
17-18
17
13
90
63
8
19
15
16
11
88
62
8
16
Very High
86
61
7
16
16-18
84
60
7
+1s
9-10
14
12
10
82
59
7
18
13
15
15
9
79
58
7
8
15
15
11
High
76
57
6
17
12
14
10
8
73
56
6
15-16
14
14
9
69
55
6
14
13
66
54
6
14
13
13
8
6-7
62
53
6
7
11
13
12
Above
Average
58
52
5
13
54
51
5
12
12
11
12
7
50
50
5
0
6
12
5
46
49
5
10
11
10
42
48
5
11
11
Average
38
47
4
9
10
11
6
34
46
4
5
10
9
31
45
4
10
10
27
44
4
8
9
24
43
4
9
5
Below
Average
21
42
3
9
7-8
9
18
41
3
7
8
4
16
40
3
-1s
8
8
8
14
39
3
4
Low
12
38
2
6-7
6
7
6
7
10
37
2
5
7
4
8
36
2
7
35
2
5
6
6
34
2
6
4
33
2
4
≤6
≤5
4
32
1
3
31
1
≤5
2
30
1
-2s
2
29
1
≤5
1
28
1
4
Very Low

46
I. Norm group Psychiatric Patients age 18-to-65 years: males
P(z <
z)
t-score
stanin
e
distanc
e to M
(sd)
Self-blame
Acceptanc
e
R
umi
na
tion
Positive
Refocus
ing
Refocus on
Plan
nin
g
Positive
Rea
ppra
isal
Putting into
Perspectiv
e
Catastrop
hizi
ng
Other-blam
e
%ile
t
s
M+sd
99
80
9
+3s
99
79
9
99
78
9
99
77
9
99
76
9
99
75
9
20
20
≥19
99
74
9
99
73
9
99
72
9
20
98
71
9
20
20
20
98
70
9
+2s
18-19
17-19
20
≥19
18
97
69
9
19
96
68
9
96
67
9
16
17
19
15-18
95
66
8
18-19
17
15-18
93
65
8
19
15
16
14
92
64
8
17
14
19
17-18
14
90
63
8
16
18
15
88
62
8
16
13
16
13
12-13
Very High
86
61
7
17
18
14
84
60
7
+1s
15
15
82
59
7
15
16
12
17
14
13
12
11
79
58
7
13
High
76
57
6
14
14
15
12
10
73
56
6
11
16
11
69
55
6
13
13
15
12
9
66
54
6
12
14
10
11
10
62
53
6
11
14
11
Above
Average
58
52
5
12
13
9
10
10
9
8
54
51
5
13
50
50
5
0
10
12
9
46
49
5
11
8
9
8
7
42
48
5
9
12
6
Average
38
47
4
11
7
34
46
4
8
10
11
8
8
5
31
45
4
10
6
27
44
4
9
9
7
10
24
43
4
7
7
7
Below
Average
21
42
3
8
18
41
3
8
6
9
5
16
40
3
-1s
6
6
14
39
3
7
8
4
Low
12
38
2
5
7
6
5
6
10
37
2
5
7
5
8
36
2
7
35
2
6
5
4
6
34
2
4
4
6
4
33
2
5
4
5
4
32
1
3
31
1
4
4
2
30
1
-2s
2
29
1
4
1
28
1
4
Very Low

47
J. Norm group Psychiatric Patients age 18-to-65 years: females
P(z <
z)
t-score
stanin
e
distanc
e to M
(sd)
Self-blame
Acceptanc
e
R
umi
na
tion
Positive
Refocus
ing
Refocus on
Plan
nin
g
Positive
Rea
ppra
isal
Putting into
Perspectiv
e
Catastrop
hizi
ng
Other-blam
e
%ile
t
s
M+sd
99
80
9
+3s
99
79
9
99
78
9
99
77
9
99
76
9
20
20
≥19
99
75
9
99
74
9
99
73
9
20
≥18
99
72
9
20
17-19
98
71
9
20
20
19
17-18
98
70
9
+2s
20
16
16-17
97
69
9
18-19
96
68
9
15
96
67
9
19
15
18-19
18
95
66
8
19
17
16
14
93
65
8
19
13
92
64
8
18
18
14
15
90
63
8
17
18
17
16
17
12
88
62
8
17
14
Very High
86
61
7
17
13
15
16
11
84
60
7
+1s
16
16
14
13
82
59
7
16
15
12
9-10
79
58
7
15
16
12
14
High
76
57
6
15
15
13
11
73
56
6
14
14
13
69
55
6
15
11
10
8
66
54
6
13
13
14
12
12
62
53
6
12
10
9
Above
Average
58
52
5
11
14
11
11
54
51
5
12
13
8
7
50
50
5
0
10
9
10
46
49
5
13
12
10
42
48
5
9
11
9
7
6
Average
38
47
4
12
9
34
46
4
10
8
11
6
31
45
4
8
11
8
8
27
44
4
10
5
24
43
4
9
10
7
Below
Average
21
42
3
7
9
7
5
18
41
3
9
7
16
40
3
-1s
8
6
8
14
39
3
6
8
6
Low
12
38
2
7
6
10
37
2
7
5
4
8
36
2
5
7
6
5
5
7
35
2
4
6
34
2
4
33
2
4
4
32
1
6
5
3
31
1
6
4
4
2
30
1
-2s
4
5
1
27
1
5
4
4
1
25
1
4
Very Low
Document Outline
Wyszukiwarka
Podobne podstrony:
biuletyn katechetyczny pdf id 8 Nieznany
BOIE Cewka pdf id 91559 Nieznany
LINK pdf id 268780 Nieznany
PRZ OPI wyklad 3 v2 pdf id 4033 Nieznany
odpowiedzi pdf id 332621 Nieznany
BATczesc od Trawy pdf id 80765 Nieznany
Optymalizacja w2 pdf id 338946 Nieznany
cukrzyca miazdzyca pdf id 12087 Nieznany
fizyka cz 2 pdf id 176637 Nieznany
Finlandia Kuchnia Przepisy [PL] [pdf] id 172464
Prezentacja pdf id 391045 Nieznany
I KOLO INSTALACJE pdf id 208281 Nieznany
farm 3 PDF id 168032 Nieznany
historia pracy socjalnej pdf id Nieznany
Optymalizacja w1 pdf id 338945 Nieznany
PDF id 352778 Nieznany
Kieliszek tresc w pdf id 234535 Nieznany
PRZ OPI wyklad 1 IIe v3 pdf id Nieznany
więcej podobnych podstron