
ISLAMIC DEVELOPMENT BANK
IMPACT OF GLOBAL FINANCIAL AND ECONOMIC CRISIS
ON OIC MEMBER COUNTRIES
Paper distributed at the 25
th
Session of COMCEC Senior Officials Meeting
Istanbul, Turkey
17 Dhul Qa’da 1430H (5 November 2009)

2
IMPACT OF GLOBAL FINANCIAL AND ECONOMIC CRISIS
ON OIC MEMBER COUNTRIES
1
I. INTRODUCTION
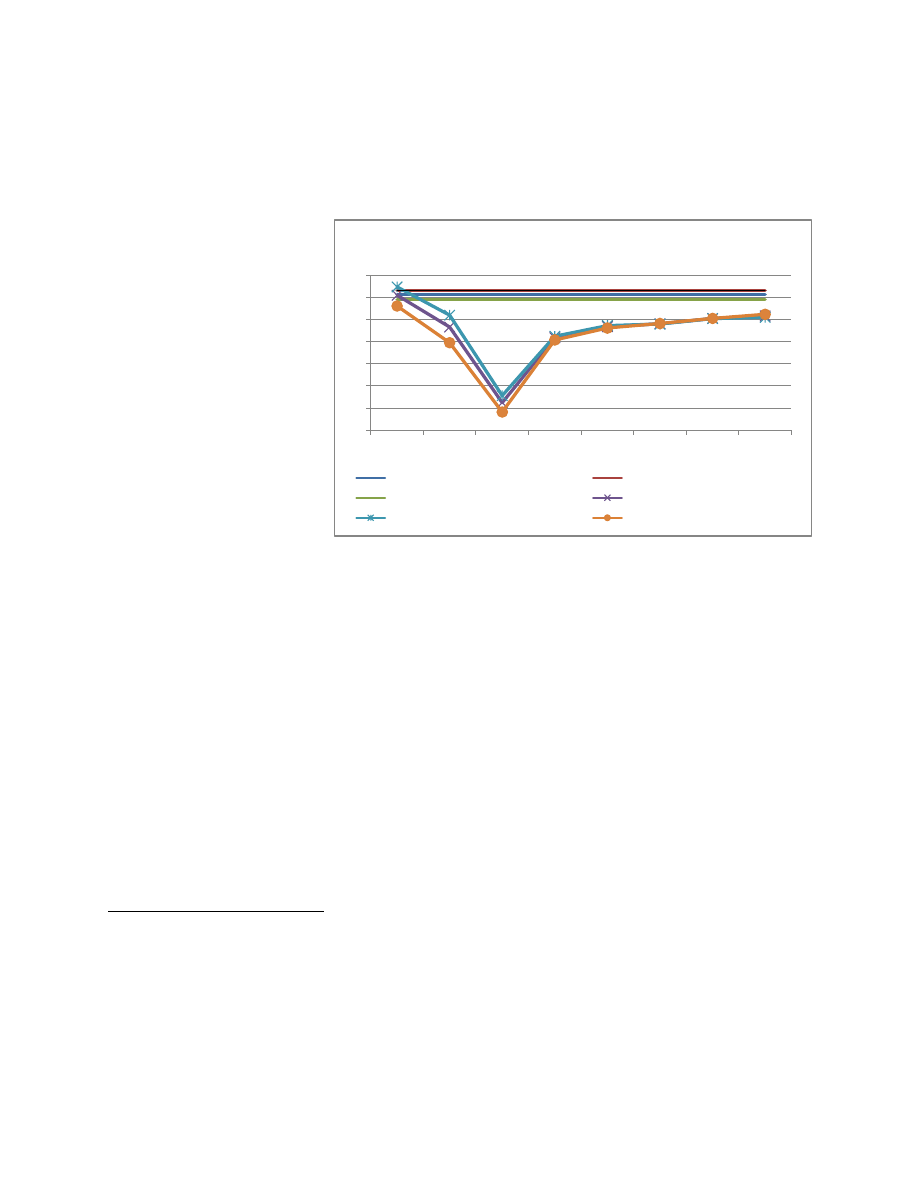
1. The global financial and economic crisis has been the most serious crisis after the Great
Depression of the 1930s. The crisis has gone far beyond the financial sector and has seriously
affected the real economy. Despite wide-ranging policy actions at international, regional, and
national levels, financial and economic strains remain acute in 2009.
2
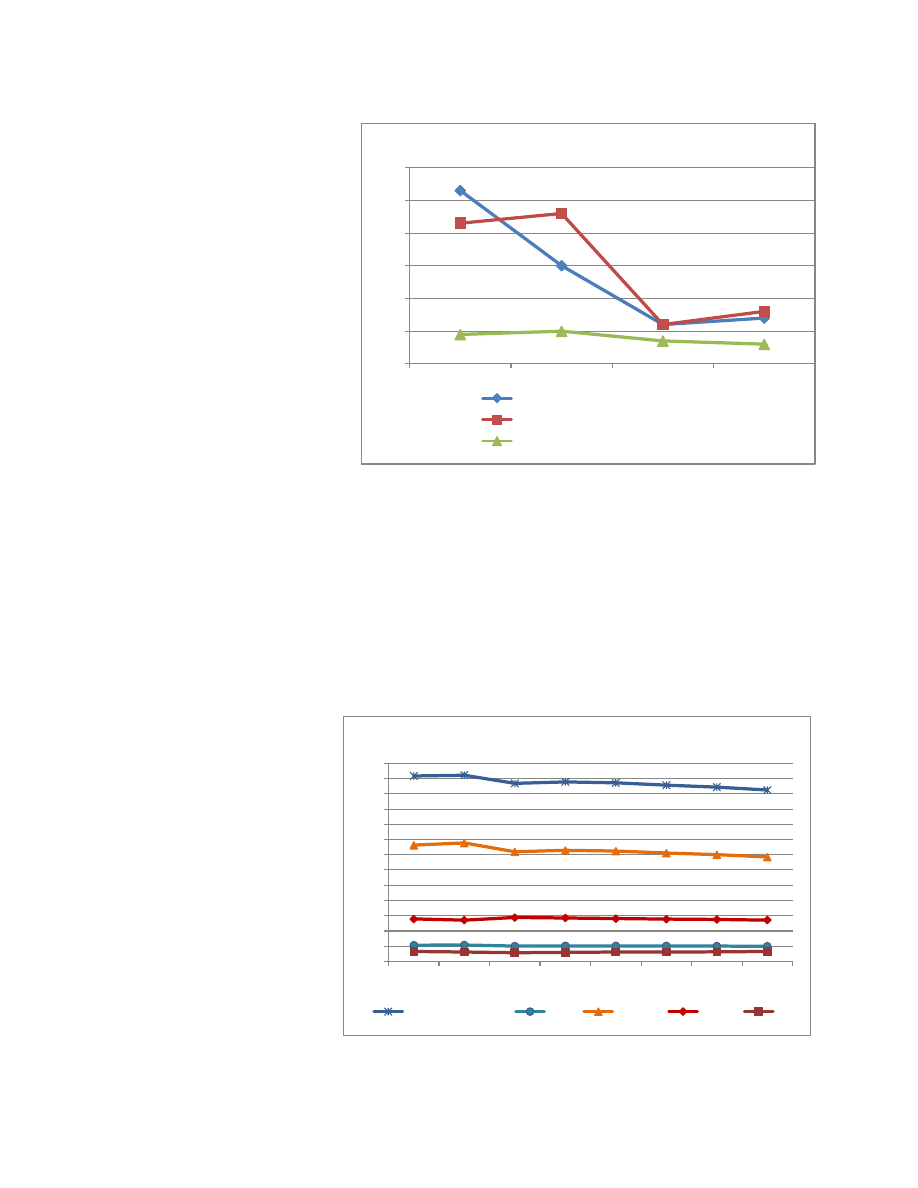
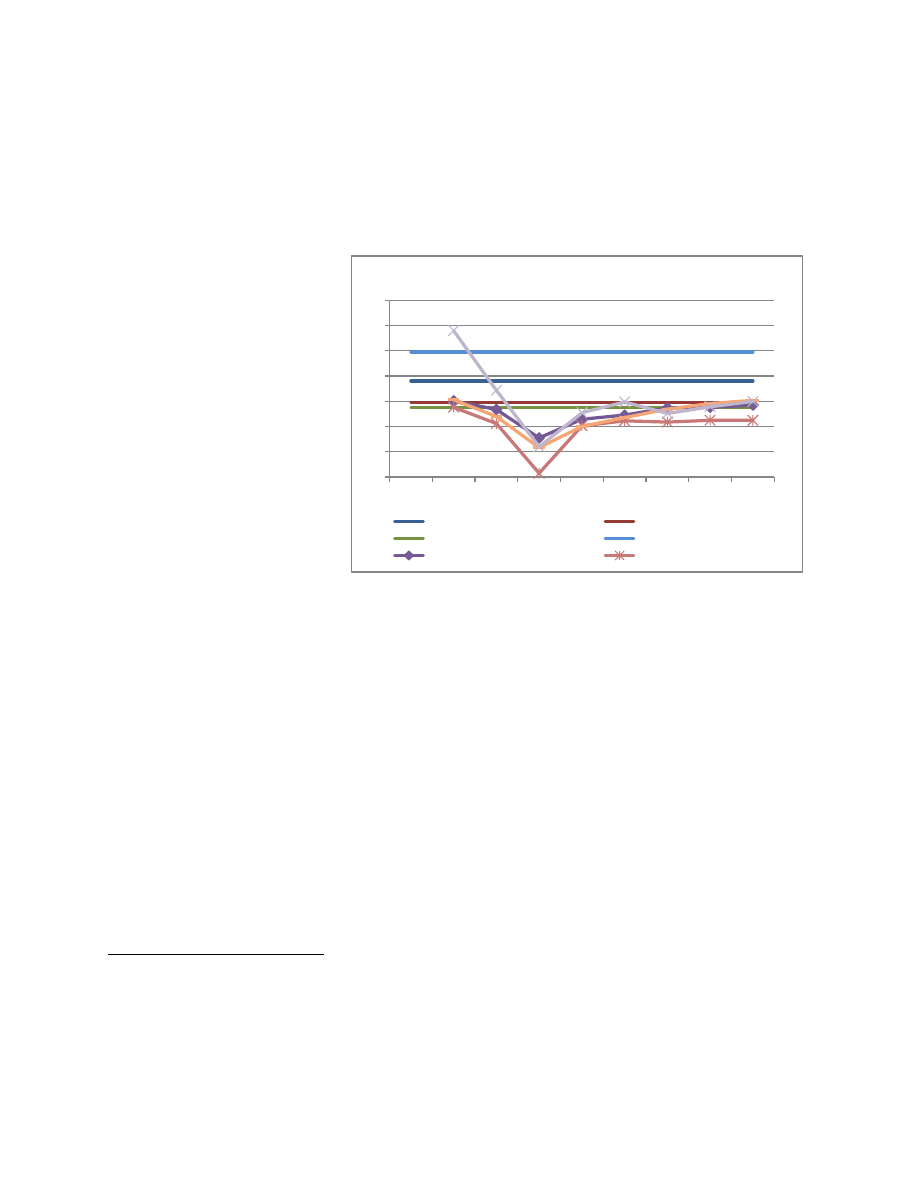
Virtually no country,
developing or developed, has escaped from the impact of economic crisis, although countries
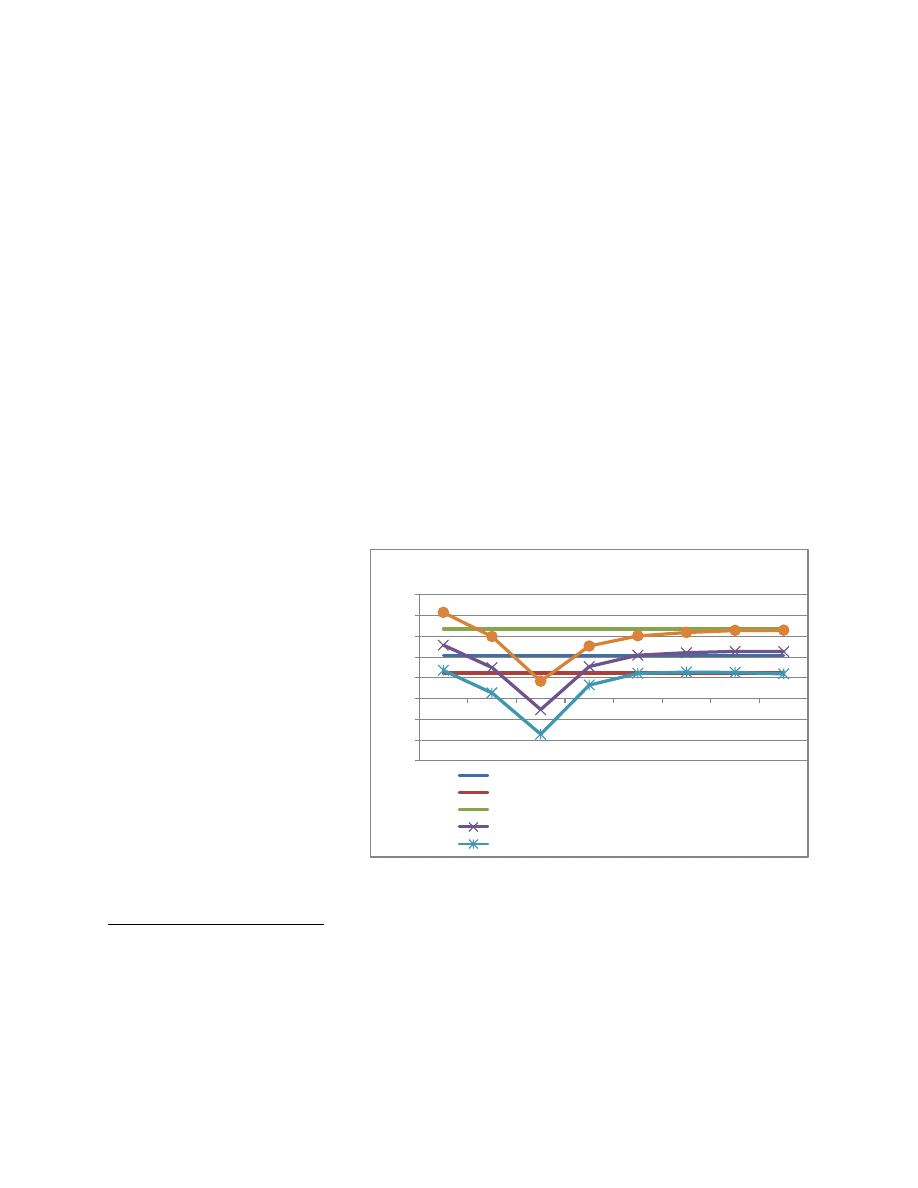
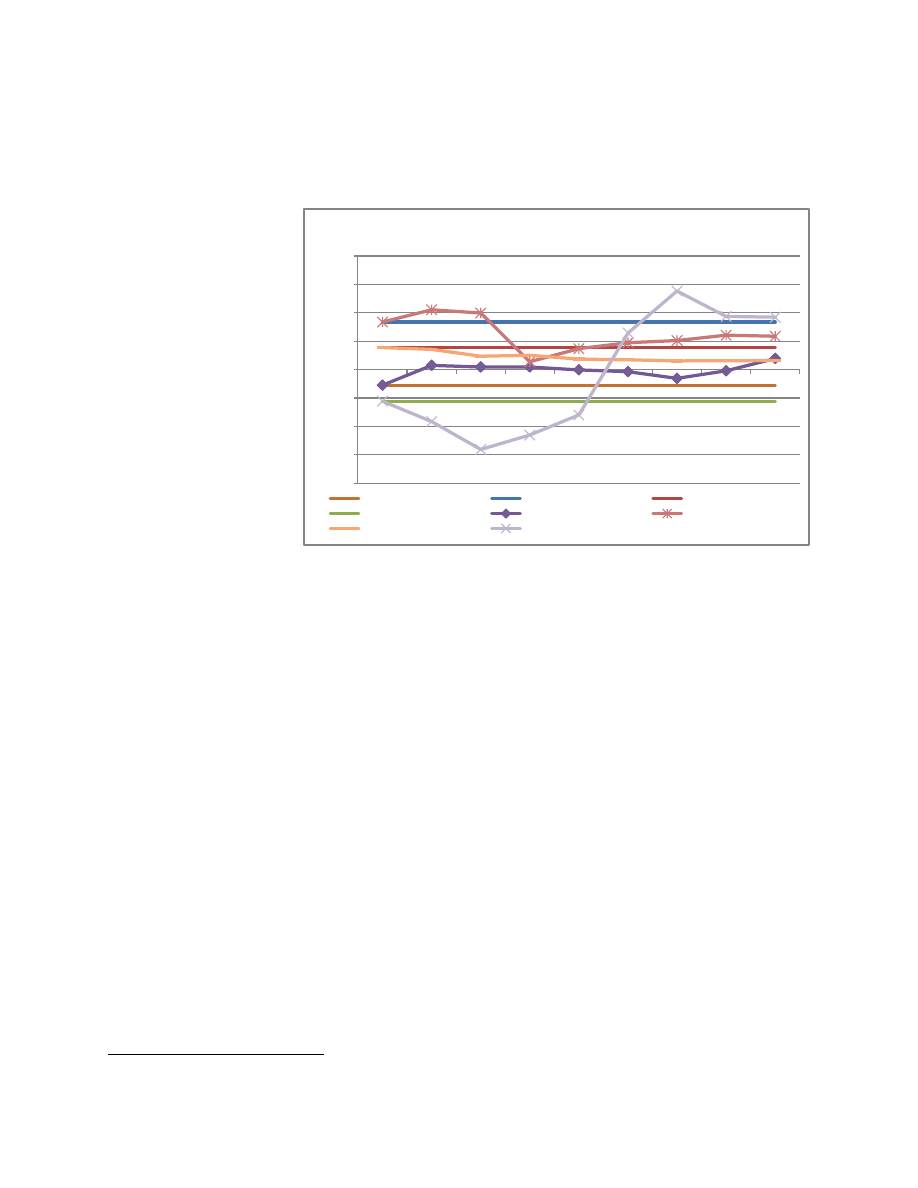
that were relatively less integrated into the global economy have generally been less affected.
However, policy actions taken in the second half of 2008 and in 2009 cushion the impact of
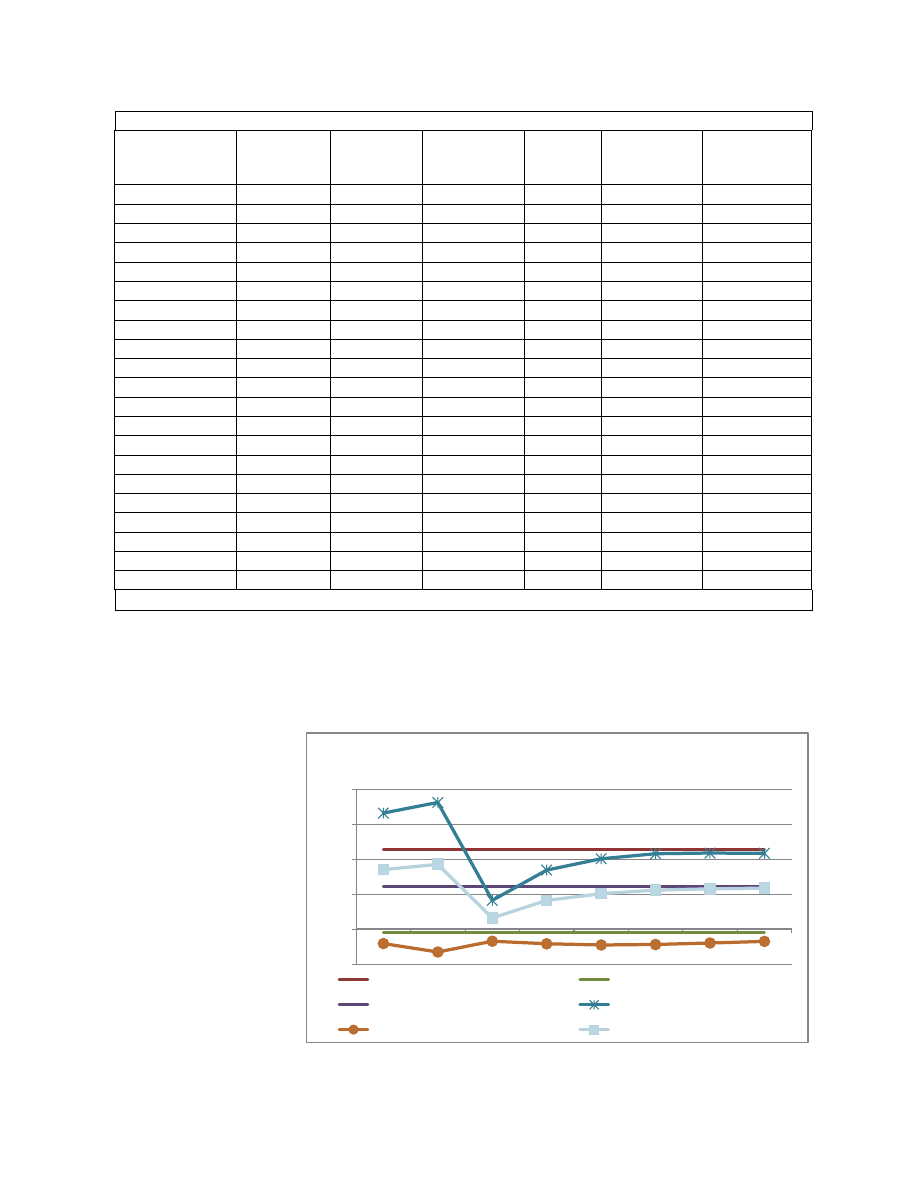
economic crisis and are expected help to recover global economic growth and enhance volume of
world trade in the short-term, through the shape of medium-term global recovery (whether V-,
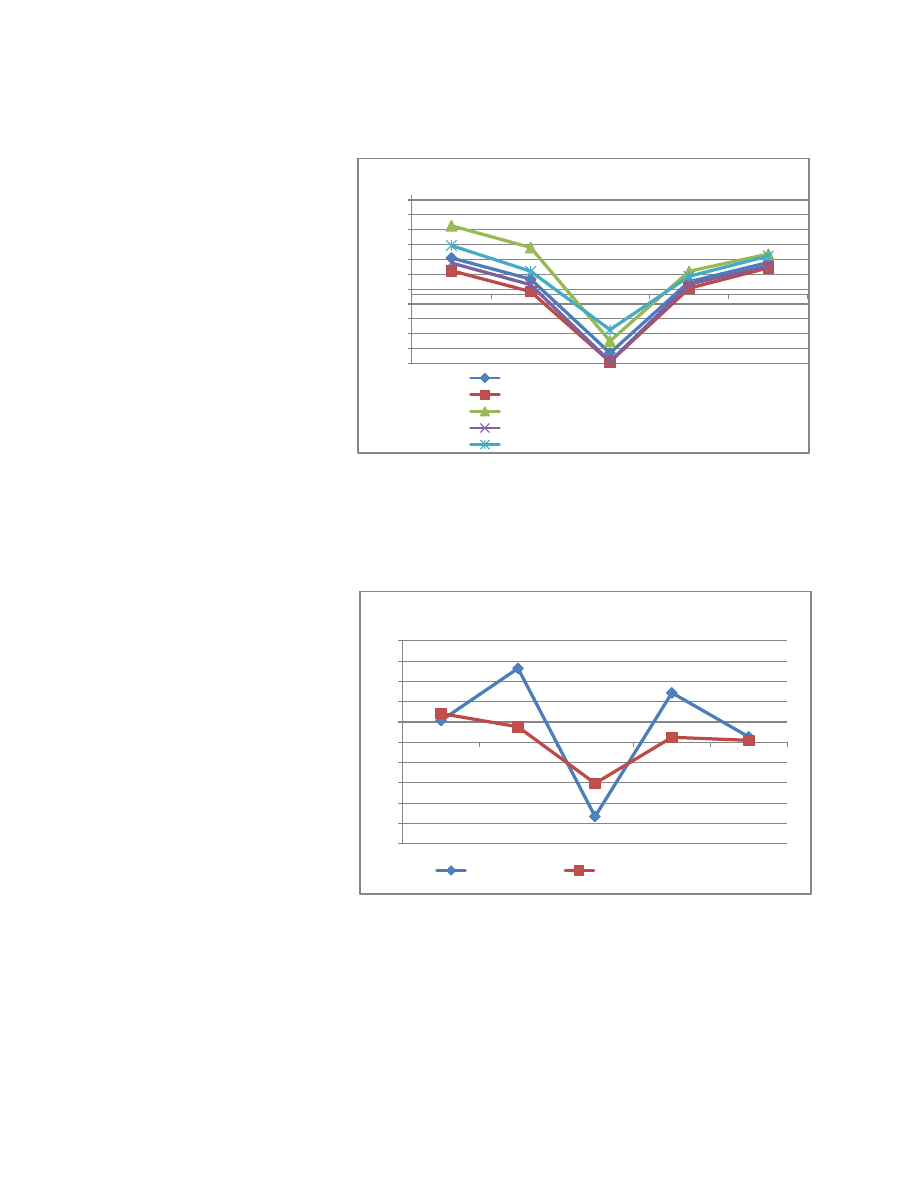
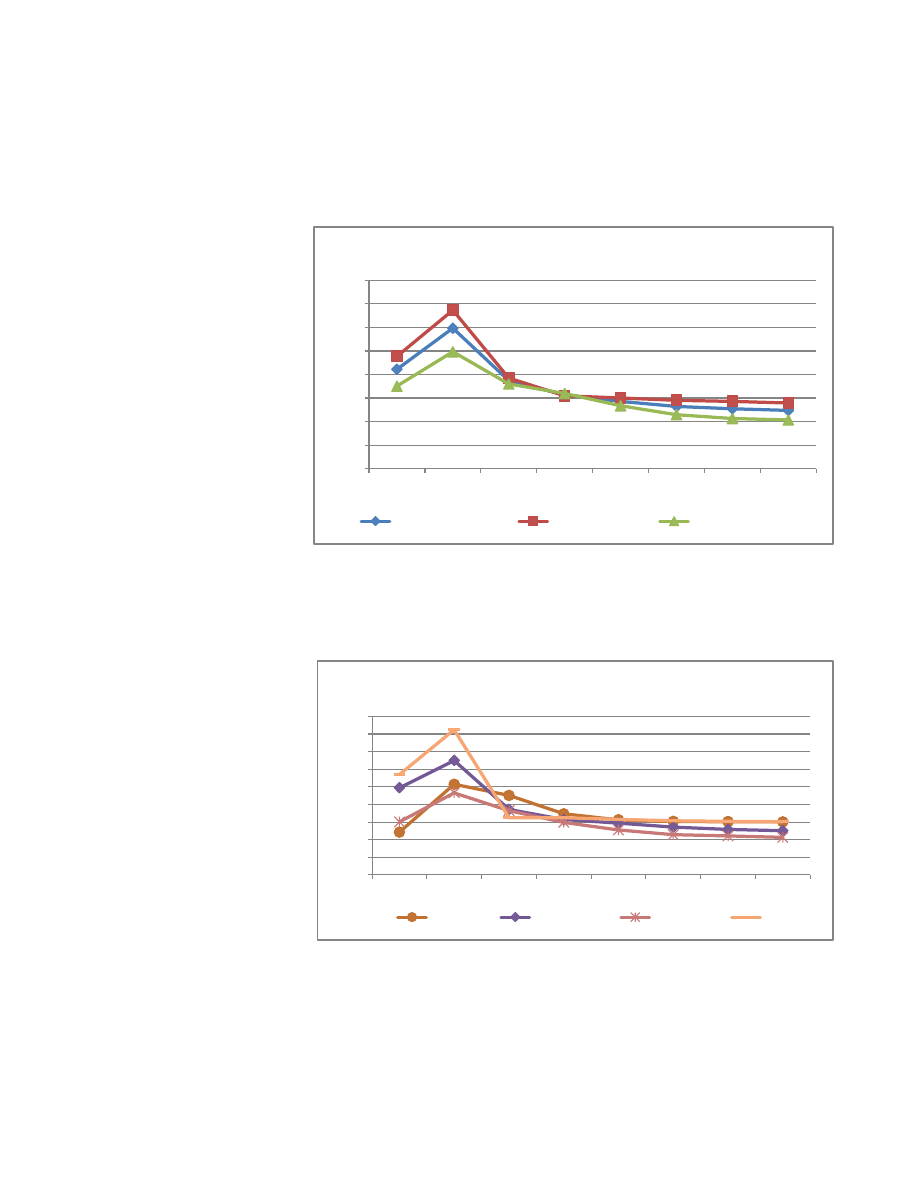
U-, or W-shaped) is uncertain yet.
2. Like other developing countries, the impact of the crisis has also been increasingly felt in
OIC member countries. They have been affected both directly and indirectly, although the
channels of transmission are different from those in relatively more developed member
countries. Some OIC member countries had already been affected by the high food and fuel
prices and the global financial and economic recession has added to economic strains seriously
affecting their socio-economic development. Consequently, they have been affected by slowing
down in economic growth, deteriorating current account balances, shrinking remittances and
development assistance, and rising unemployment and poverty. However, timely fiscal stimulus,
money injections, interest rate cuts, and rise in oil- and non-oil commodity prices have helped
spurred recovery in OIC member countries.
3. The human cost of the economic crisis has also imperiled the social stability and future
economic emancipation of the people in OIC member countries. In particular, the Millennium
Development Goals (MDGs) appear to suffer a serious setback as the decade-long gains
achieved by member countries are under stress.
4. The analysis focuses on OIC 57 member countries (as a group) disaggregated into oil-
exporting and non-oil exporting member countries. Since the impact of economic crisis varies
across regions, the analysis also focuses on four regional economic groupings of OIC member
countries namely Middle East and North Africa (MENA), Asia, Sub-Saharan Africa (SSA), and
Countries in Transition (CIT). The paper presents key external and domestic factors affecting
economic outlook of OIC member countries and its various regions. In particular, it focuses on
the impact of economic crisis on economic growth, current account balances, and inflation.
1
The Paper has been prepared by Zafar Iqbal, Senior Economist, Economic Policy and Research Department under
the supervision of Ifzal Ali, Chief Economist, Islamic Development Bank. Abdullateef Bello, Director, Data
Resources and Statistics Department is gratefully acknowledged for his constructive comments and data support.
2
For detail, see IDB (May 2009), Issue Paper on “Shaping the Post-Crisis World: Regional Implications and
Coordinated Responses by Member Countries”.
3
Further, it also highlights some social aspects of the crisis. Finally, the paper suggests a number
of medium- and long-term measures to be considered by member countries.
II.
KEY GLOBAL FACTORS AFFECTING ECONOMIC OUTLOOK OF OIC
MEMBER COUNTRIES
5. The major global factors that have affected the economic performance of OIC member
countries include sharp drop in world output; collapse in the volume of world trade; highly
volatile oil-and non-oil commodities prices; and cost and availability of external financing.
6. World real GDP growth dropped sharply but is expected to recover in the short-term. In
2009, the world economy recorded an unprecedented contraction. According to the IMF World
Economic Outlook (October 2009), global output growth is likely to fall from 3 percent in 2008
to negative 1.1 percent in 2009 - for the first time in 60 years. The most serious and immediate
impact of the financial turmoil has been on the advanced economies, whose real output growth is
estimated to decline from 0.6 percent in 2008 to negative 3.4 percent in 2009. The global
economic downturn also resulted in the deceleration of growth in developing economies, which
is estimated to drop from 6 percent in 2008 to 1.7 percent in 2009 (Figure 1).
7. In the medium-term (2010-2014), the global economy as well as advanced economies are
projected to achieve the pre-crisis level of growth (trend growth of 2002-2006) by 2011 and will
resume thereafter. However, the
recovery of trend growth of
developing countries may take a
little longer time as they are
projected to achieve it by 2013
(Figure 1). The medium-term
recovery will very upon the
movement in oil and non-
commodity prices, exchange
rates, cost and availability of
external financing, and the
policies adopted by the national
authorities.
3
Therefore,
the
shape of medium-term recovery
of world economy (V-, U-, or
W-shaped) is uncertain yet.
4
3
IMF World Economic Outlook (October 2009) is based on a number of assumptions such as: (i) Real effective
exchange rates will remain constant at their average levels during July 30–August 27, 2009; (ii) Established policies
of national authorities will be maintained; (iii) Average price of oil will be $61.5 a barrel in 2009 and $76.5 a barrel
in 2010, and will remain unchanged in real terms over the medium-term; and (iv) The six-month London Interbank
Offered Rate (LIBOR) on U.S. dollar deposits will average 1.2 percent in 2009 and 1.4 percent in 2010; the three-
month euro deposit rate will average 1.2 percent in 2009 and 1.6 percent in 2010; and the six-month Japanese yen
deposit rate will yield an average of 0.7 percent in 2009 and 0.6 percent in 2010.
4
For more detail on this issue, see Economist (20 August 2009)
-6.0
-4.0
-2.0
0.0
2.0
4.0
6.0
8.0
10.0
2007
2008
2009
2010
2011
2012
2013
2014
Figure 1. Real GDP Growth in World, Advance and
Developing Economies (% per annum)
Trend growth (World)
Trend growth (Advanced economies)
Trend growth (developing economies)
World
Advanced economies
Data Source: IMF World Economic Outlook October 2009
4
8. The impact of the economic crisis on world trade is even more pronounced. The year 2008
and 2009 witnessed collapse in the volume of world trade as both advanced and developing
economies
were
badly
affected
by
the
global
financial and economic crisis.
The growth in volume of
world trade declined from 7.3
percent in 2007 to 3 percent in
2008
and
negative
11.9
percent in 2009. Both imports
and exports of advanced
economies declined by 13.7
percent and 13.6 percent,
respectively,
in
2009.
Similarly,
imports
of
developing
economies
dropped by 9.5 percent and
exports by 7.2 percent in
2009. In the medium-term, in
line with the global economic recovery, the global trade is also projected to recover (Figure 2).
9. Economic recovery has reversed plunging prices of oil- and non-oil commodities. The oil
price, which increased by 36.4 percent in 2008, is estimated to decline by 36.6 percent in 2009.
Similarly, weakening global
demand
is
depressing
commodity prices and creating
deflationary conditions around
the
globe.
The
non-oil
commodity
prices,
which
increased by 7.5 percent in
2008, are estimated to fall by
20.3 percent in 2009. With the
moderate
global
economic
recovery
and
increasing
demand, the oil prices are
expected to rise by 24.3
percent
and
non-oil
commodity prices by 2.4
percent in 2010. In the
medium-term, the movement
in oil- and non-oil commodity
prices will depend upon the speed and scale of global economic recovery (Figure 3).
10. Low policy interest rates also help to recover global economy. In order to stabilize
economies in the face of global economic crisis, monetary authorities reacted quickly with
exceptionally large interest rate cuts in 2008 and 2009 as well as unconventional measures to
inject liquidity and sustain credit. In particular, policy interest rates have been brought down
considerably in many advanced economies. In particular, LIBOR on US$ deposits has declined
-14.0
-11.0
-8.0
-5.0
-2.0
1.0
4.0
7.0
10.0
13.0
16.0
19.0
2007
2008
2009e
2010f
Average
(2011-2014)
Figure 2. Trade (good and services) Volume of Wolrd,
Advanced and Developing Countries (% change per annum)
World Trade Volume
Imports of Advances economies
Imports of developing economies
Exports of Advances economies
Exports of developing economies
Data Source: IMF World Economic Outlook October 2009
-50
-40
-30
-20
-10
0
10
20
30
40
50
2007
2008
2009e
2010f
Average
(2011-2014)
Figure 3. Oil and Non-Oil Commodities Prices
(% p.a)
Oil prices
Non-Oil Commodities Prices
Data Source: IMF World Economic Outlook October 2009
Data Source: IMF World Economic Outlook October 2009
5
from 5.3 percent in 2007 to 3
percent in 2008 and further to
1.2 percent in 2009. Similarly,
LIBOR on euro deposits has
declined from 4.6 percent in
2008 to 1.2 percent in 2009,
while the LIBOR on Japanese
Yen deposits has declined
from one percent to 0.7
percent
during
the
same
period. In the short-term,
policy
interest
rates
are
expected to remain lower.
However, in the medium-term,
the large increases in fiscal
deficits and public debt are
likely to put upward pressure
on long-term interest rates as
the
global
recovery
is
sustained (Figure 4).
III.
ECONOMIC PERFORMANCE AND OUTLOOK OF OIC MEMBER
COUNTRIES
11. Due to the above mentioned external factors, economic performance of OIC member
countries has been adversely affected in terms of weakening economic strength, slowing down
real output growth, and deteriorating current account balances of both oil-exporting and non-oil
exporting member countries as well as in its four regions.
12. Global
economic
recession has weakened
economic strength of OIC
member
countries.
It
appears that global financial
and economic crisis has
permanently
damaged
economic strength of OIC
member
countries.
The
share of these countries in
developing countries’ GDP
has declined from 24.4
percent in 2008 to 23.4
percent in 2009 and is
projected to decline further
to 22.5 percent by 2014. In
particular, MENA’s share is
projected to decline from
0
2
4
6
8
10
12
14
16
18
20
22
24
26
2007
2008
2009
2010
2011
2012
2013
2014
Figure 5. OIC Member States' Economic Strength
(% share in GDP of developing countries)
OIC (as a group)
SSA
MENA
ASIA
CIT
IDB estimates based on data from the IMF WEO database of October 2009
0.0
1.0
2.0
3.0
4.0
5.0
6.0
2007
2008
2009e
2010f
Figure 4. London Interbank Offered Rates (LIBOR)
(% per annum)
LIBOR (US$ deposits)
LIBOR (euro deposits)
LIBOR (Japanese yen deposits)
Data Source: IMF World Economic Outlook October 2009
6
15.5 percent in 2008 to 14.4 percent in 2009 and 13.7 percent by 2014, while shares of other
regions will remain more or less unchanged (Figure 5).
13. Recovery in OIC member countries faces major downward risks. OIC member countries
(as a group) had experienced impressive real GDP growth of above 6.1 percent during the pre-
crisis period (2002-2006),
while
oil-exporting
member countries
5
trend
growth
remained
6.3
percent
and
non-oil
exporting
member
countries
6
5.9
percent
during the same period.
Due to spillovers first from
the food crisis and later
from global financial and
economic crisis, the real
GDP
growth
in
OIC
member countries (as a
group) is likely to drop to
1.2 percent, oil-exporting
1.6 percent, and non-oil
exporting
member
countries 0.8 percent in
2009. With the global recovery and positive trends in commodity prices, growth is expected to
pick up in 2010. However, both oil-exporting and non-oil exporting member countries will not
be able to achieve the pre-crisis level of growth by 2014. It appears that the economic crisis has
permanently damaged the potential output of OIC member countries as a group (Figure 6).
14. Although strong public policies have supported OIC member countries’ economic recovery,
the short-term V-shaped recovery through economic painkillers (i.e. stimulus packages and
money injections) appears to be fragile. A number of major risks are also associated with
medium-term recovery, and whether V-, U-, or W-shaped recovery will depend upon the
underlying factors mentioned above.
15. Among various regions of OIC member countries, Middle East and North Africa (MENA)
7
was hit hard by the economic crisis as its real GDP growth dropped from normal growth rate of
5.9 percent to 0.3 percent in 2009. The MENA region has been adversely affected mainly due to
5
Oil-exporting member countries include Algeria, Azerbaijan, Cameroon, Chad, Cote d’Ivoire, Egypt, Gabon, Iran,
Iraq, Kazakhstan, Kuwait, Libya, Malaysia, Nigeria, Qatar, Saudi Arabia, Sudan, Syria, Turkmenistan, U.A.E,
Uzbekistan and Yemen.
6
Non-oil exporting member countries include Afghanistan, Albania, Bahrain, Bangladesh, Benin, Brunei, Burkina
Faso, Comoros, Djibouti, Gambia, Guinea, Guinea-Bissau, Guyana, Indonesia, Jordan, Kyrgyz, Lebanon, Maldives,
Mali, Mauritania, Morocco, Mozambique, Niger, Oman, Pakistan, Palestine, Senegal, Sierra-Leone, Somalia,
Suriname, Tajikistan, Togo, Tunisia, Turkey and Uganda.
7
MENA region includes Algeria, Bahrain, Egypt, Iran, Iraq, Jordan, Kuwait, Lebanon, Libya, Morocco, Oman,
Palestine, Qatar, Saudi Arabia, Syria, Tunisia, Turkey, UAE, and Yemen.
IDB estimates based on data from the IMF WEO database of October 2009
0
1
2
3
4
5
6
7
2007
2008
2009
2010
2011
2012
2013
2014
Figure 6. Real GDP Growth Rate in OIC Member States
(% per annum)
Trend growth (OIC as a group)
Trend growth (Oil-Exporting)
Trend growth (Non-Oil Exporting)
OIC (as a Group)
Oil-Exporting
Non-Oil Exporting
7
collapse in oil and asset prices, significant decline in domestic demand and sharp drop in FDI
flows. The second region affected badly by the economic crisis is Countries in Transition (CIT)
8
,
whose output decelerated sharply from 9.9 percent in 2008 to 2.3 percent in 2009. The fallout of
the economic crisis on CIT member countries has been immense mainly due to sharp drop in
demand, currency devaluations, decline in foreign capital inflows, workers’ remittances, and
lower energy prices. The growth in Sub-Saharan Africa (SSA)
9
has dropped from 7.6 percent in
2008 to 3.1 percent in 2009,
mainly due to collapse of
global
trade,
decline
in
capital flows (FDI, ODA, and
remittances),
and
sharp
decline in oil- and non-oil
commodity
prices.
Economies
of
member
countries in Asia
10
were
relatively less affected as
their growth decelerated from
5.5 percent to 2.3 percent
during the same period. In
particular, drop in global
domestic for durable goods,
and a decline in investment in
the export-oriented emerging
economies in the Asia region
hurt manufacturing exports.
However, the expansionary fiscal and monetary policies and rebound in the financial markets
and capital inflows are helping the region’s fast recovery.
16. In the medium-term scenario, only Asia is projected to achieve normal growth by 2013 as
the region appears to be more resilient shock absorber due to sound macro reform adopted
during the Asian crisis of late 1990s. While other MENA, SSA, and CIT do not seem to achieve
pre-crisis level of economic growth by 2014 (Figure 7).
17.
With regard to individual member countries, it appears that potential output in 21 out of
57 member countries has dropped permanently as they are projected to remain far behind from
their normal trend growth path by 2014, while four countries’ recovery will be W-shaped. The
other countries are projected to achieve their pre-crisis growth before 2014 (Table 1).
8
CIT region includes Albania, Azerbaijan, Kazakhstan, Kyrgyz Republic, Tajikistan, Turkmenistan, and
Uzbekistan.
9
SSA region includes Benin, Burkina Faso, Cameroon, Chad, Comoros, Côte d’Ivoire, Djibouti, Gabon, Gambia,
Guinea, Guinea Bissau, Mali, Mauritania, Mozambique, Niger, Nigeria, Senegal, Sierra Leone, Somalia, Sudan,
Togo, and Uganda.
10
Asia region includes Afghanistan, Bangladesh, Brunei, Indonesia, Malaysia, Maldives, Pakistan, and Suriname.
0
2
4
6
8
10
12
14
2007 2008 2009 2010 2011 2012 2013 2014
Figure 7. Real GDP Growth by Regions of OIC States
(% per annum)
Trend growth (SSA)
Trend growth (MENA)
Trend growth (Asia)
Trend growth (CIT)
SSA
MENA
IDB estimates based on data from the IMF WEO database of October 2009
8
18.
By 2014, both oil- exporting and non-oil exporting member countries will not be able to
achieve the pre-crisis level of current account balances (CABs). Current account balances of
OIC member countries are hit hard by the economic crisis. The CAB surplus of OIC member
countries (as a group) dropped from 9.3 percent in 2008 to 1.6 percent of GDP in 2009. In
particular,
CAB
surplus of oil-exporting
member
countries
dropped
from
18.1
percent of GDP in
2008 to 4.1 percent in
2009. In contrast, the
current account deficit
of non-oil exporting
member
countries
improved
from
3.3
percent to 1.7 percent
of GDP during the
same period (Figure 8).
19. However, with the
expected revival of the
Table 1. Status of Member Countries of OIC for Achieving Trend/ Pre-Crisis Growth (2002-2006)
Already
achieved/
will maintain
2010
2011
2012
2013
Not
achievable
by 2014
W-Shaped
Recoveries
Côte d’Ivoire
Gabon
Albania
Burkina Faso
Malaysia
Afghanistan
Oman
Djibouti
Guinea
Bangladesh
Indonesia
Algeria
Qatar
Egypt
Niger
Benin
Libya
Azerbaijan
Turkmenistan
Guinea-Bissau
Syria
Cameroon
Mauritania
Bahrain
Uzbekistan
Iraq
Togo
Comoros
Morocco
Brunei
Yemen
Lebanon
Gambia
Saudi Arabia
Chad
Oman
Kyrgyz
Suriname
Iran
Mali
Jordan
Senegal
Kazakhstan
Tunisia
Kuwait
Maldives
Mozambique
Nigeria
Pakistan
Sierra Leone
Sudan
Tajikistan
Turkey
Turkmenistan
Uganda
U.A.E
Data source: IMF World Economic Outlook database of October 2009
-5.0
0.0
5.0
10.0
15.0
20.0
2007
2008
2009
2010
2011
2012
2013
2014
Figure 8. Current Acvcount Balance of OIC States
(% of GDP)
Average (Oil-Exporting)
Average (Non-Oil Exporting)
Average (OIC as a group)
Oil-Exporting
Non-Oil Exporting
OIC (as a group)
IDB estimates based on data from the IMF WEO database of October 2009
9
global economy and increase in oil and non-oil commodity prices, current account surplus of
OIC member countries (as a group) and oil-exporting countries is projected to improve but they
will not be able to achieve the pre-crisis level of CAB surplus by 2014. In the medium-term,
improvement in CAB will mainly depend upon the movement in oil and non-oil commodity
prices
and
their
exchange rates.
20. The impact of the
economic crisis is not
uniform across all four
regions of the OIC
member
countries.
They are experiencing
a marked deterioration
in their current account
balances. Among four
regions
of
OIC
member
countries,
CAB deficits of SSA
and CIT regions are
projected to improve
faster and they are
expected to achieve
normal
CABs
after
2010. In particular, in the medium-term, the increasing trade links with the European Union,
China, India and other emerging markets are likely to help the SSA region in economic recovery
and achieving sustainable growth. However, MENA and Asia will not be able to achieve the
normal CAB surpluses by 2014. Their medium-term recovery in CABs will depend upon the
movement in oil prices, global oil demand, and volume of trade (Figure 9).
21. Although, the global financial and economic crisis appears to have adverse impacts on
exports of OIC member countries, it has also created an opportunity for them to reconsider their
trade and investment strategies and learn how to cope with a dramatically transformed
international financial landscape. For instance, member countries need to enhance intra-trade
through additional measures aimed at providing greater access to their markets. The OIC Ten-
Year Programme, adopted in December 2005, called on member countries to expand the scope of
intra-trade in order to achieve greater economic integration by raising its level to 20 percent of
the overall trade volume by 2015. The intra-trade performance of member countries (as a group)
has improved overtime, reaching 16.3 percent in 2008 and the 20 percent intra-trade target can
be achieved through strengthening and expanding the scope of OIC-Trade Preferential System
(TPS) in its full spirit. The OIC-TPS has been signed so far by thirty-one member countries but
ratified by twenty-two members, having the required number of ratifications for its
enforcement.
11
Another opportunity is in the area of encouraging investments by the Sovereign
Wealth Funds in long-term infrastructure projects in member countries with adequate and
competitive risk-return profile. Further, enhancing intra-trade and intra-investment also require
11
Report on “Twenty Fifth Meeting of the Follow-up Committee of the COMCEC, 12-14 May 2009.
-20.0
-15.0
-10.0
-5.0
0.0
5.0
10.0
15.0
20.0
2007
2008
2009
2010
2011
2012
2013
2014
Figure 9. Current Account Balance by Regions of OIC States
(% of GDP)
Average (SSA)
Average (MENA)
Average (Asia)
Average (CIT)
SSA
MENA
ASIA
CIT
IDB estimates based on data from the IMF WEO database of October 2009
10
to remove tariff and non-tariff barriers, particularly free movement of labour and capital across
regions.
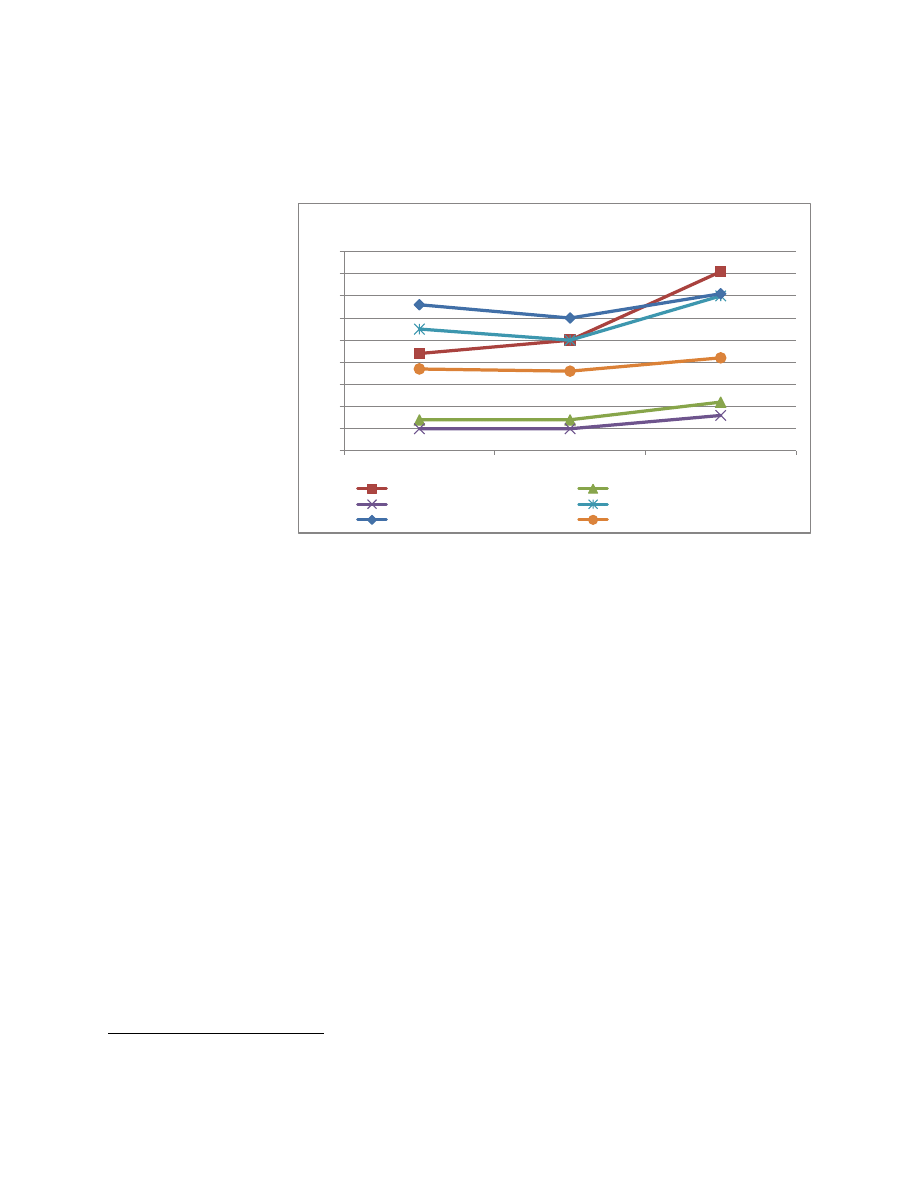
22. Inflationary pressure has been significantly released in OIC member countries. The sharp
decline in domestic economic activities and wide gap between actual and potential output in OIC
member countries have
released
inflationary
pressures in both oil-
exporting and non-oil
exporting
member
countries. At the OIC
level, inflation rate has
declined
from
11.9
percent in 2008 to 7.5
percent in 2009. The
oil-exporting
member
countries
experienced
relatively sharp drop in
inflation
(from
13.5
percent to 7.7 percent)
and
non-oil-exporting
member state from 9.9
percent to 7.2 percent
during the same period
(Figure 10).
23. The drop in inflation remained uneven across various regions. In CIT, inflation rate fell
from 16.5 percent in
2008 to 6.5 percent in
2009,
followed
by
MENA (from 13 percent
to 7.4 percent), SSA
(from 10.3 percent to 9
percent) and Asia (9.3
percent to 7.3 percent).
Due to excess capacity
and slow economic
recovery,
the
inflationary pressure is
expected
to
remain
moderate in the medium-
term (Figure 11).
IV.
SOCIAL INDICATORS
24. Rising unemployment is posing a major challenge for OIC member countries. The current
speed of economic recovery is insufficient to decrease unemployment. The impact of global
0.0
2.0
4.0
6.0
8.0
10.0
12.0
14.0
16.0
2007
2008
2009
2010
2011
2012
2013
2014
Figure 10. Inflation in OIC Member States
(% per annum)
OIC (as a group)
Oil-Exporting
Non-Oil Exporting
0.0
2.0
4.0
6.0
8.0
10.0
12.0
14.0
16.0
18.0
2007
2008
2009
2010
2011
2012
2013
2014
Figure 11. Inflation Rates by Regions of OIC Member States
(% per annum)
SSA
MENA
ASIA
CIS
IDB estimates based on data from the IMF WEO database of October 2009
IDB estimates based on data from the IMF WEO database of October 2009
11
economic recession on unemployment varies across regions of the globe. The latest estimates by
the ILO (May 2009)
12
indicate that all regions are projected to experience higher unemployment
rates in 2009 compared to 2007. Region-wise unemployment trends show that Non-EU States
and Countries in Transition are projected to experience the highest increase in unemployment
rate from 8.4 percent
in
2007
to
12.1
percent
in
2009,
followed
by
the
Middle East from 9.5
percent to 11 percent;
North Africa from
10.6 percent to 11.1
percent; Sub-Saharan
Africa
from
7.7
percent to 8.2 percent;
Southeast Asia and
Pacific
from
5.4
percent to 6.2 percent
and South Asia from 5
percent to 5.6 percent
during
the
same
period (Figure 12).
Creation
of
jobs
requires new investment, the pre-requisites of which include political and economic stability,
existence of proper legal and regulatory framework, appropriate policy environment, existence of
basic infrastructure, and adequate economic incentives.
25. While most OIC member countries were already facing the negative effects of food and fuel
crises, the economic recession further compounded their socio-economic problems; in particular,
it made the unemployment situation more serious. However, there is no easy and short-term
solution to fix this problem.
26. The economic crisis has also led to rise in poverty in OIC member countries. The global
economic slowdown threatens to reverse the gains made in terms of poverty and human
development indicators. Recent estimates suggest that the food crisis has caused 130-155 million
people to fall back into poverty and global financial and
economic crisis will trap 53 million
more people in poverty in developing countries, which
will need an additional $38 billion to lift
the incomes of the poor to the poverty line.
13
The sharp slowdown in economic growth in 2009
will substantially expand the resource requirements to put hard hit member countries back on
track. According to the latest estimates by the UN (May 2009), between 73 and 103 million more
people would fall into poverty due to financial crisis. Most of this setback will be felt in East and
South Asia, with between 56 million and 80 million likely to be affected. The crisis could keep
12 million to 16 million more people in poverty in Africa, another 4 million in Latin America
and the Caribbean, and about one million more in Economies in Transition. If the economic
12
ILO (May 2009), Global Employment Trends Update.
13
World Bank, Global Economic Prospects, 2009.
4
5
6
7
8
9
10
11
12
13
2007
2008
2009p
Figure 12. Unemployment Rates by Regions, 2007-2009
(percent per annum)
Non-EU States and CIT
South-East Asia and Pacific
South Asia
Middle East
North Africa
Sub-Saharan Africa
Data source: ILO (May 2009), Global Employment Trends Update.

12
crisis has translated into a human crisis in the developing world, it will have a severe impact on
the poor people in various regions of OIC member countries in the medium-term.
27. The adverse external factors have been compounded by a number of domestic factors
resulting in weak socio-economic performance of OIC member countries. These domestic
factors include:
Resistance to macro reforms (i.e. generalized subsidies instead of targeted subsidies)
and micro reforms (i.e. poor business climate for firm-level investment)
Lack of focus on inclusive growth (i.e. lack of productive employment opportunities,
unequal access to opportunities, and inadequate social safety nets)
Weak linkage between the financial sector and real sector
Weak corporate governance in the financial institutions
No common policy to improve OIC regional imbalances
28. There are a number of risks to medium-term socio-economic outlook of member
countries. These risks include:
As accommodative fiscal, monetary, and financial policies have played a critical role
in mitigating the adverse effects of economic recession, their premature exit may
reverse V-shaped recovery into U-shaped or W-shaped.
Long-lasting stimulus packages and money injections may result in higher fiscal
deficit and unsustainable public debt.
Oil price risk due to geopolitical situation may increase the risk to current account
balance.
Increase in domestic and foreign cost of financing may discourage much needed
private investment activities and reduce private consumption.
A strong return of H1N1flu (Swine flu) may slow growth through affecting tourism
industry, travel, and business sector.
With regard to achieving intra-OIC trade target and enhancing intra-investment, not
removing barriers on mobility of labour and capital across regions.
V.
PROPOSED MEASURES TO IMPROVE SOCIO-ECONOMIC OUTLOOK OF
OIC MEMEBR COUNTRIES
In order to mitigate the adverse impact of economic recession and improve socio-
economic outlook of OIC member countries, following medium-and long-terms measures
are suggested.
Medium-term Measures
Rescue through stimulus packages and money injections, which need to be continued
until private domestic demand/consumption fully recovers but in a fiscally sustainable

13
way with keeping the inflation under close check by the monetary authorities. In this
context, policymakers need to choose the right time for starting tightening the fiscal and
monetary policies.
Recovery is expected from 2010 but the question remains whether V-, U-, or W-shaped
recovery, therefore, the member countries need to adjust their policies accordingly.
Rebalancing regional imbalances of OIC member countries is essential (i.e. shifting
resources from resource-rich regions to resource-deficient regions through enhancing
intra-trade and intra-investment).
Long-Term Measures
Re-regulation of the financial sector in order to make it stable and respond to the needs
of the priority economic sectors and support economic recovery.
Expanding Islamic financial institutions would be a best alternate as Islamic financial
structure creates clear link between the financial sector and real sector and contributes
more to the development of an economy.
Adopt macro reform (i.e. targeted subsidies instead of generalized subsidies) and micro
reform (i.e. improve the efficiency of firm-level investment through improving business
climate).
Re-assure inclusive growth The economic recession is also fueling rising
unemployment and poverty in OIC member countries. Therefore, increasing employment
opportunities, providing equal access to opportunities and adequate social safety nets will
be essential.
Wyszukiwarka
Podobne podstrony:
eur country id 165434 Nieznany
4553 (On) id 38902 Nieznany (2)
GUIDANCE ON DISTRESS ALERTS id Nieznany
Abolicja podatkowa id 50334 Nieznany (2)
4 LIDER MENEDZER id 37733 Nieznany (2)
katechezy MB id 233498 Nieznany
metro sciaga id 296943 Nieznany
perf id 354744 Nieznany
interbase id 92028 Nieznany
Mbaku id 289860 Nieznany
Probiotyki antybiotyki id 66316 Nieznany
miedziowanie cz 2 id 113259 Nieznany
LTC1729 id 273494 Nieznany
D11B7AOver0400 id 130434 Nieznany
analiza ryzyka bio id 61320 Nieznany
pedagogika ogolna id 353595 Nieznany
więcej podobnych podstron