
DISCUSSION / DISCUSSION
Discussion of “Probabilistic slope stability analysis
for practice”
1
J. Michael Duncan, Michael Navin, and Thomas F. Wolff
Duncan et al.
850
The authors have made an important contribution to the
literature on the reliability of slopes. This discussion focuses
on four aspects of the paper, in this order: (1) the importance
of spatial correlation in reducing variance associated with
the physical properties of soil strata, (2) the relationship be-
tween reliability index (
β
) and probability of unsatisfactory
performance (P
u
), (3) the importance of identifying the criti-
cal failure mechanism, and (4) the advantages and disadvan-
tages of using Microsoft® Excel and @Risk for evaluating
the reliability of slopes.
Variance reduction due to spatial averaging
In the opinion of the discussers, the most significant con-
tribution of the paper is that it shows very clearly the impor-
tance of the reduction in the uncertainty due to soil
variability as a result of spatial correlation of soil properties.
This is illustrated by the results in Table 3, where the com-
puted value of P
u
is reduced 70–80% when variance reduc-
tion is incorporated in the calculations to account for spatial
correlation.
It is not necessary to use Microsoft® Excel and @Risk to
take this reduction in variance into account. It can be done
as well using existing slope stability programs combined
with the first-order second-moment (FOSM) method. As
noted below, using the FOSM method has significant advan-
tages.
In the opinion of the discussers, the greatest need in this
area is for simple methods for evaluating autocorrelation dis-
tance. If this important concept is to be widely incorporated
in probabilistic analyses of slope stability, it is imperative
that simple methods be available for estimating auto-
correlation distance, using the types and amounts of data
that are available in practice. The amount of data available
for the James Bay project is unusually large. Methods that
require such large amounts of data will not find widespread
use in practice.
Relationship between
 and P
u
Although the differences are of little practical signifi-
cance, the discussers point out that they have not been able
to confirm the values of P
u
shown in Table 3. Those values
are shown in Table D1, together with the values the
discussers believe are correct.
Also, for the FOSM analysis with assumed lognormal dis-
tribution of the factor of safety, the discussers find P
u
=
2.13 × 10
–3
, rather than the value P
u
= 2.5 × 10
–3
shown in
the note below Table 3.
Although differences in values if P
u
of these magnitudes
(27–63%) are of marginal significance with respect to practi-
cal applications, they could lead to confusion for readers
interested in using the information in Table 3.
Importance of identifying the critical failure
mechanism
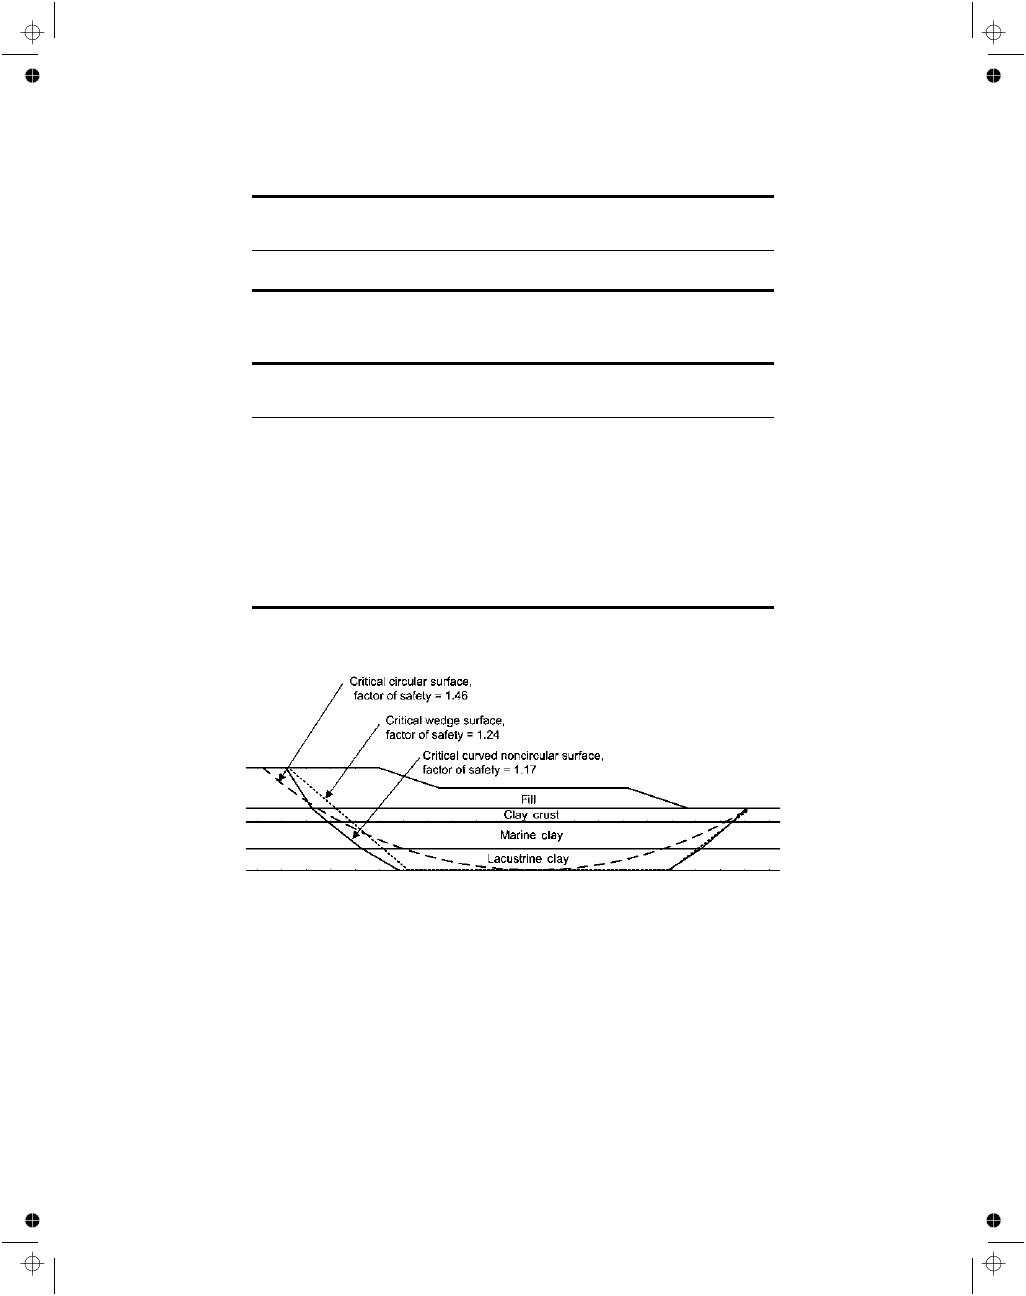
Because the authors used the Bishop method of slices,
they were only able to analyze circular slip surfaces. The
minimum factor of safety from their analyses was 1.46. The
discussers used Spencer’s method (Spencer 1967), with
UTEXAS4 (Shinoak Software, Austin, Tex.), to compute
factors of safety for wedge-shaped and curved noncircular
surfaces, and found a more critical failure mechanism, with
a factor of safety equal to 1.17. The critical circular,
wedge-shaped and curved noncircular surfaces are shown in
Fig. D1.
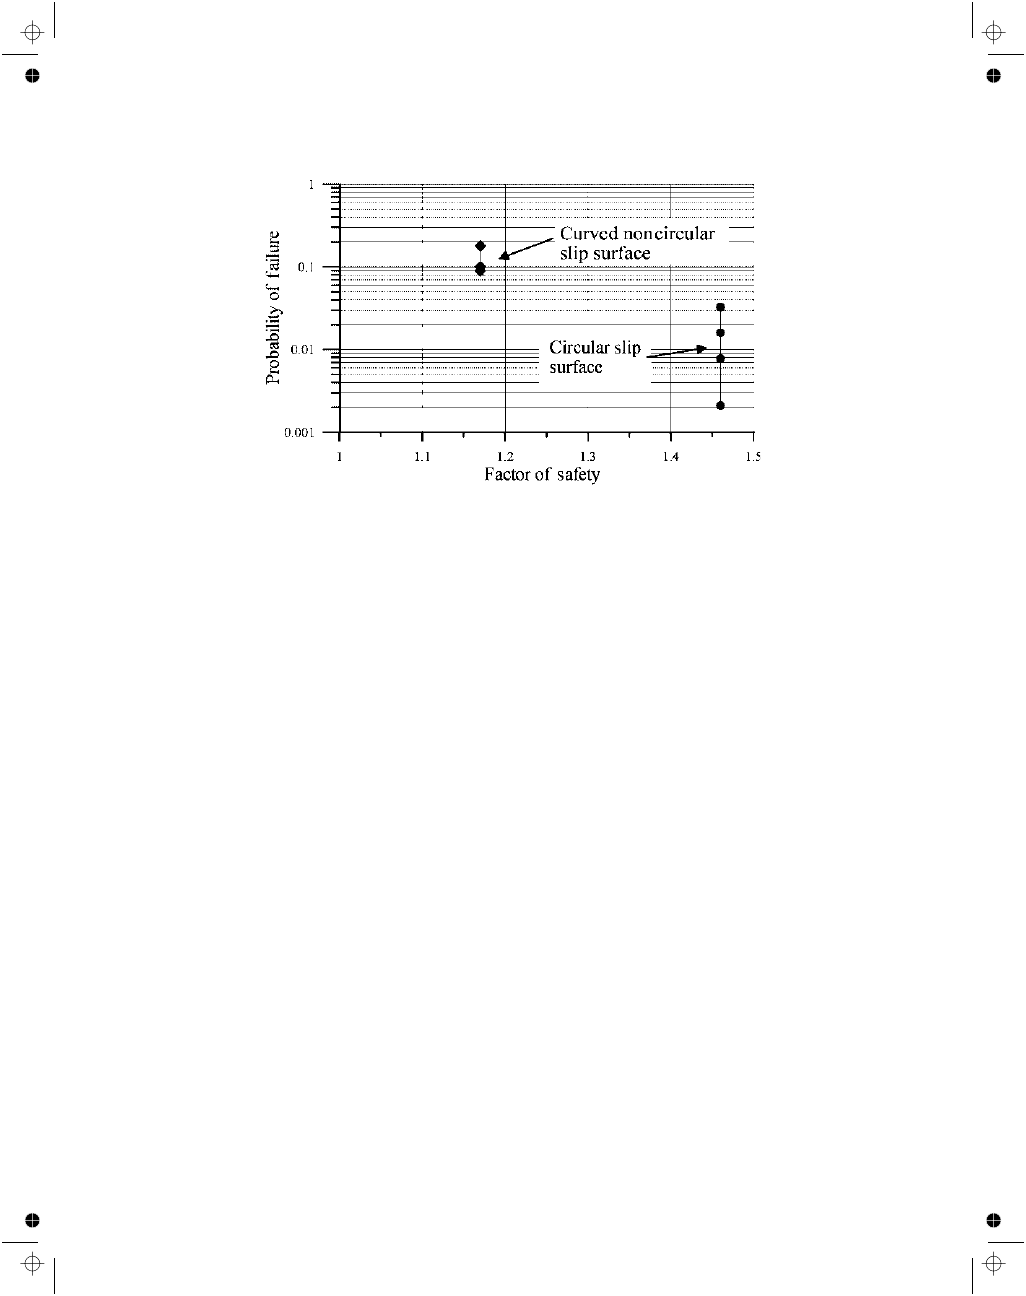
The lower factor of safety for the curved noncircular sur-
face results in a significantly higher probability of unsatis-
factory performance, as shown in Table D2 and Fig. D2.
Values of P
u
for the curved noncircular surface range from
0.19 to 0.26, i.e., 8–90 times the values for the circular slip
surface. This large difference shows the critical importance
of correctly identifying the critical failure mechanism. No
matter how sophisticated the methodology used for comput-
ing values of P
u
, the results of a reliability analysis will not
Can. Geotech. J. 40: 848–850 (2003)
doi: 10.1139/T03-030
© 2003 NRC Canada
848
Received 29 November 2002. Accepted 13 March 2003.
Published on the NRC Research Press Web site at
http://cgj.nrc.ca on 11 August 2003.
J.M. Duncan
2
and M. Navin. Department of Civil and
Environmental Engineering, Virginia Tech, Blacksburg, VA
24061, U.S.A.
T.F. Wolff. Michigan State University, East Lansing, MI
48824, U.S.A.
1
Appears in Canadian Geotechnical Journal, 39: 665–683.
2
Corresponding author (e-mail: jmd@vt.edu).
I:\cgj\CGJ40-04\T03-030.vp
August 7, 2003 11:46:26 AM
Color profile: Generic CMYK printer profile
Composite Default screen
be meaningful unless they are based on the critical failure
mechanism.
Advantages and disadvantages of using
Microsoft® Excel and @Risk for evaluating
reliability of slopes
In the opinion of the discussers, the advantages of using
Microsoft® Excel and @Risk for evaluating reliability of
slopes are outweighed by the disadvantages, for the follow-
ing reasons:
(1) Microsoft® Excel with @Risk can only be used to ana-
lyze circular slip surfaces in the form that is described
in the paper. In many conditions, like those at the James
Bay dykes, noncircular surfaces are significantly more
critical than circular surfaces. Basing reliability analyses
on a noncritical failure mechanism can greatly underes-
timate the value of P
u
, as shown in Table D2 and
Fig. D2.
(2) The very important effect of variance reduction due to
spatial averaging, shown clearly in the paper, does not
require the use of Microsoft® Excel and @Risk. As
shown in Table 3, essentially the same value of P
u
is
calculated when variance reduction due to spatial aver-
aging is included in the FOSM method. The important
effects illustrated in the paper are due to variance reduc-
tion caused by spatial averaging, not by the use of
Microsoft® Excel and @Risk.
(3) The simplified method that has been described by the
discussers (Wolff 1994; U.S. Army Corps of Engineers
1999; Duncan 2000), combining a slope stability pro-
gram with the FOSM method, is applicable to a wider
variety of problems and conditions than are Microsoft®
© 2003 NRC Canada
Duncan et al.
849
Value of
β
shown
in Table 3
Value of P
u
shown
in Table 3
Discussers’ values of P
u
, from Ang and Tang
(1975), and the Microsoft® Excel function
NORMSDIST; same values from both sources
2.42
8.40×10
–3
7.76×10
–3
1.84
2.37×10
–2
3.29×10
–2
Table D1. Values of reliability index,
β
, and corresponding values of unsatisfactory perfor-
mance, P
u
.
Variance reduction
due to spatial
averaging?
Distribution of
factor of safety
Failure
mechanism
P
u
Ratio of P
u
:
noncircular/
circular
No
Normal
Noncircular
2.5×10
–1
8
Circular
3.3×10
–2
Yes
Normal
Noncircular
1.9×10
–1
24
Circular
7.8×10
–3
No
Lognormal
Noncircular
2.6×10
–1
16
Circular
1.6×10
–2
Yes
Lognormal
Noncircular
1.9×10
–1
90
Circular
2.1×10
–3
Note: Variance reduction using the reduced value of standard deviation shown in Table 3.
Table D2. Values of P
u
for circular and noncircular failure surfaces computed using vari-
ous assumptions regarding variance reduction and distribution of factor of safety.
Fig. D1. Critical circular, wedge, and noncircular slip surfaces for the James Bay dykes.
I:\cgj\CGJ40-04\T03-030.vp
August 7, 2003 11:46:26 AM
Color profile: Generic CMYK printer profile
Composite Default screen
© 2003 NRC Canada
850
Can. Geotech. J. Vol. 40, 2003
Excel and @Risk. The FOSM method can be used as an
adjunct to any method of deterministic analysis, includ-
ing analyses performed using any slope stability com-
puter program.
References
Ang, A.H-S., and Tang, W.H. 1975. Probability concepts in engi-
neering planning and design. Vol. 1. Basic principles. John
Wiley, New York.
Duncan, J.M. 2000. Factors of safety and reliability in geotechnical
engineering. Journal of Geotechnical and Geoenvironmental
Engineering, ASCE, 126: 307–316.
Spencer, E. 1967. A method of analysis of the stability of embank-
ments assuming parallel inter-slice forces. Géotechnique, 17(1):
11–26.
U.S. Army Corps of Engineers.1999. Risk based analysis in geo-
technical engineering for support of planning studies, ETL
1110–2–556, Department of the Army, U.S. Army Corps of
Engineers, Washington, DC. [Available online at www.usace.
army.mil/usace-docs.]
Wolff, T.F.1994. Evaluating the reliability of existing levees. Re-
port of a research project entitled: Reliability of existing levees,
prepared for U.S. Army Engineer Waterways Experiment Sta-
tion Geotechnical Laboratory, September 1994.
Fig. D2. Variation of P
u
with factor of safety (FS) for circular and noncircular slip surfaces.
I:\cgj\CGJ40-04\T03-030.vp
August 7, 2003 11:46:27 AM
Color profile: Generic CMYK printer profile
Composite Default screen
Wyszukiwarka
Podobne podstrony:
Probabilistic slope stability analysis by finite elements
Probabilistic slope stability analysis by finite elements
a probalilistic investigation of c f slope stability
Slope Stability 2008
a probalilistic investigation of c f slope stability
Schuppener Stability analysis for shallow foundations Eurocode 7 and the new generation of DIN cod
Intraindividual stability in the organization and patterning of behavior Incorporating psychological
Elastic Stability of Plates(Plate Buckling Analysis
Intraindividual stability in the organization and patterning of behavior Incorporating psychological
Tutorial 08 Probabilistic Analysis
GbpUsd analysis for July 06 Part 1
vii w stabilnosc prionow
4 stabilnosc
Decline of Contrastive Analysis Pedagogy
An%20Analysis%20of%20the%20Data%20Obtained%20from%20Ventilat
5 STABILNOSC id 40487 Nieznany (2)
więcej podobnych podstron