
i
APPLICATION OF MEMBRANE BIOREACTOR SYSTEMS FOR
LANDFILL LEACHATE TREATMENT
by
Boonchai Wichitsathian
A dissertation submitted in partial fulfillment of the requirements for the
degree of Doctor of Technical Science
Examination Committee: Prof. C. Visvanathan (Chairman)
Dr. Preeda Parkpian
Dr. Josef Trankler
Prof. Athapol Noomhorm
External Examiner: Prof. F.W. Günthert
Institut für Wasserwesen
Fakultät für Bauingenieur- und Vermessungswesen
Universität der Bundeswehr München
Neubiberg, Germany
Nationality: Thai
Previous Degrees: Bachelor of Industrial Chemistry
King Mongkut’s Institute of Technology Thonburi
Bangkok, Thailand
Master of Environmental Technology
King Mongkut’s Institute of Technology Thonburi
Bangkok, Thailand
Scholarship Donor: Royal Thai Government
Asian Institute of Technology
School of Environment, Resources and Development
Thailand
August 2004

ii
Acknowledgements
I would like to deeply express my profound gratitude to his advisor, Prof. C.
Visvanathan for kindly giving his stimulating ideas, valuable guidance, numerous
constructive suggestions and encouragement through his study at AIT. The author also
would like to thank Dr. Preeda Parkpian, Dr. Josef Trankler, Dr. David A. Luketina, Dr.
Lee Seung-Hwan, and Prof. Athapol Noomhorm for their valuable comments, critical ideas
and serving as members of examination committee.
I am greatly indebted to Prof. F.W. Gunthert for kindly accepting to serve as
External Examiner. His valuable advice, guidance and professional comments are highly
appreciated.
I gratefully acknowledge to Royal Thai Government for the financial support.
I am very grateful to Ms. Sindhuja Sankaran and Ms. Loshnee Nair for providing
comments and helping throughout my study at AIT.
I sincerely would like to thank all staffs and my lab colleagues in the
Environmental Engineering Program for friendship, help, and moral support, which
contributed in various ways to the completion of this dissertation.
Sincere gratitude is expressed to the Pathumthani municipality and Ram-indra
transfer station office, Thailand, for the useful information and assistance on the leachate
and sample collection.
Finally, I would like to express my deepest gratitude and dedicate this research
work to my parents, all family members and special friends, whose love, assisted me
through difficult times and contributed to the success of this study.

iii
Abstract
Landfill leachate is a complex wastewater with considerable variation in both quality
and quantity. The composition and concentration of pollutants are influenced by the types
of waste deposited, hydrogeological factors, and more significantly by the age of the
landfill site. In general, leachate is highly contaminated with organic contaminants
measured as chemical oxygen demand (COD) and biochemical oxygen demand (BOD),
and also with high ammonium nitrogen concentration. Biological processes have been
found ineffective for leachate from relatively old landfill. In leachate containing high
concentrations of organic and nitrogen compounds such cases result in possible serious
environmental problems near the landfill site.
This research was undertaken to investigate the performance of a membrane
bioreactor (MBR) using mixed yeast culture (YMBR) and mixed bacteria culture (BMBR)
in treating raw leachate containing high organic and nitrogen concentrations. The
inhibition effects of ammonium nitrogen and lead on yeast and bacteria cultures were
determined by measuring the oxygen uptake rate (OUR) using the respirometric method.
Furthermore, for both YMBR and BMBR, treating the stripped leachate, they were
assessed the treatment efficiency to compare the results with those treating the raw
leachate.
The inhibition experiment revealed that a bacteria culture was very sensitive to
ammonium nitrogen when it was compared to a yeast culture. Also the values of biokinetic
coefficients showed that the specific growth rate (µ) in bacteria system was influenced. At
ammonium concentration of 2,000 mg/L, the response of OUR inhibition in a bacteria
system was approximately 37% whereas it was around 6% in a yeast system. Furthermore,
both yeast and bacteria cultures were also sensitive to lead.
In a MBR, treating raw leachate, the COD removal rate for BMBR was slightly
lower than the YMBR for varied hydraulic retention time (HRT) at high volumetric
loading rate. The average COD removal efficiency in BMBR was 62±2% while in YMBR
was 65±2%. The YMBR could obtain higher COD removal rate at higher volumetric
loading rate than the BMBR. This indicated that the yeast system can treat leachate
containing high organic and nitrogen concentrations. The average TKN removal efficiency
for both BMBR and YMBR systems was from 14-25% and 19-29%, respectively. The
nitrite and nitrate concentrations (NO
2
-
and NO
3
-
) were found to be very low.
The comparative evaluation of treatment performance of MBR, treating stripped
leachate, was examined. The COD removal of both BMBR and YMBR was above 70% at
HRT 16 h and 24 h. As a result, the pretreatment with ammonia stripping prior to BMBR
showed more significant improvement in terms of COD removal when it was compared to
YMBR. This could be confirmed that the trend of inhibition effect on bacteria was
dependent upon the ammonium nitrogen concentration. The range of BOD concentration
of effluents from both YMBR and BMBR, treating the stripped leachate was from 30-55
mg/L. This level followed the present effluent standard. Although BOD could be reduced
to lower values with these methods, the treated leachate still contained a large quantity of
refractory organic compounds. This might be due to the contribution of the slowly
biodegradable organics and non-biodegradable organics contained in the leachate.
Therefore, they should be further treated in a post treatment for elevating the final effluent
to meet the present effluent standard or even increasing the biodegradable organics.

iv
Under the same operating conditions, the YMBR could run under transmembrane
pressure (TMP) 1.3-2.5 times lower than the BMBR with the significantly reduced
membrane fouling rate. This might be due to the soluble extracellular polymeric substances
(soluble EPS). Hence, yeast system could enhance membrane performance and had the
potential to improve the treatment system due to reduction of operational problems. In
addition, bacteria sludge showed a better dewatering quality compared to that of the yeast
sludge.

v
Table of Contents
Chapter Title
Page
Title Page
i
Acknowledgements
ii
Abstract
iii
Table of Contents
v
List of Tables
viii
List of Figures
x
List of Abbreviations
xii
1
Introduction
1
1.1 Background
1
1.2 Objectives of the Study
3
1.3 Scope of the Study
4
2
Literature Review
5
2.1 Introduction
5
2.2 Solid Waste Management Practices
6
2.3 Municipal Solid Waste Landfill
7
2.4 Municipal Solid Waste Landfill Leachate
7
2.5 Leachate Composition and Characteristics
8
2.6 Molecular Weight Distribution in Landfill Leachate
11
2.7 Factors Affecting Leachate Composition
12
2.7.1 Seasonal Variation
13
2.7.2 Landfill Age
14
2.7.3 Composition of the Waste Dumped
16
2.7.4 Geological Characteristic
16
2.7.5 Filling Technique
16
2.8 Leachate Treatment
17
2.8.1 Biological Treatment Processes
18
2.8.2 Physical Treatment
24
2.8.3 Chemical Treatment
30
2.8.4 Natural Leachate Treatment Systems
33
2.8.5 Co-Treatment with Municipal Wastewater
35
2.9 Combined Treatment Facility
36
2.9.1 Biological Treatment and Reverse Osmosis
36
2.9.2 Microfiltration and Reverse Osmosis
37
2.9.3
Denitrification-Nitrification/Ultrafiltration and Reverse Osmosis 38
2.9.4 MBR-UV and Ozone-Reverse Osmosis
39
2.10
Microbial Toxicity
39
2.11 Membrane Bioreactors
41
2.11.1 Membrane Configuration
42
2.11.2 Application of Membrane Bioreactors
44
2.11.3 Sludge Characteristics
45
2.12 Yeasts
49
2.12.1 Introduction
49
2.12.2 Applications of Yeasts for Wastewater Treatment
49

vi
2.13 Rationale for the Study and Proposed Treatment Sequence
52
2.13.1 Leachate Characteristic
52
2.13.2 Need for Ammonia Stripping
52
2.13.3 Need for Membrane Bioreactors
53
3
Methodology
54
3.1 Introduction
54
3.2 Leachate Characterization
54
3.3 Seed Study
55
3.3.1 Yeast and Bacterial Sludge
55
3.3.2 Acclimatization
56
3.4 Toxicity Studies
56
3.4.1 Ammonia Toxicity
57
3.4.2 Lead Toxicity
58
3.5 Ammonia Stripping
58
3.6 Membrane Bioreactor
59
3.6.1 Membrane Resistance Measurement
59
3.6.2 Experimental Set-up
60
3.6.3 Parametric Studies
62
3.6.4 Molecular Weight Distribution
62
3.6.5 Sludge Characterization
64
3.7 Ammonia Stripping Coupled Membrane Bioreactor
64
3.8 Analytical Methods
65
4
Results and Discussion
67
4.1 Simulation of Leachate Characteristic for Treatment of
Middle Aged Leachate
67
4.2 Biokinetic Studies
68
4.2.1 Acclimatization of Mixed Yeast and Bacterial Sludge
68
4.2.2 Kinetics of Yeast and Bacterial Growth
72
4.2.3 Toxicity Studies
75
4.3 Application of Yeast and Bacteria Based Membrane Bioreactors
in Leachate Treatment
80
4.3.1 Initial Membrane Resistance
81
4.3.2 Optimization of HRT in Terms of Membrane Bioreactor
Treatment Efficiency
82
4.3.3 Membrane Fouling and Membrane Resistance
89
4.4 Application of Yeast and Bacteria Based Membrane Bioreactors
in Ammonia Stripped Leachate Treatment
91
4.4.1 Ammonia Stripping Studies
91
4.4.2 Membrane Resistance and Membrane Cleaning
95
4.4.3 Performance of Ammonia Stripping Coupled Membrane
Bioreactor Process
97
4.5 Other Studies
106
4.5.1 Biodegradability of the Leachate
106
4.5.2 Molecular Weight Cut-off
110
4.5.3 Sludge Properties
115
4.5.4 EPS Formation
116
4.5.5 Conductivity and TDS
117

vii
4.5.6 Cost Analysis for Operation
117
5
Conclusions and Recommendations
119
5.1
Conclusions
119
5.2 Recommendations for Future Work
121
References
123
Appendix A: Pictures of Experiments
141
Appendix B: Leachate Characteristics and Experimental
Data of Acclimation
145
Appendix C: Experimental Data of Biokinetic Study and
Toxicity Study
149
Appendix D: Membrane Resistance Studies
155
Appendix E: MBR without Ammonia Stripping
163
Appendix F: Ammonia Stripping Studies
171
Appendix G: MBR with Ammonia Stripping
174
Appendix H: Other Studies
179

viii
List of Tables
Tables Title
Page
2.1
Leachate Characteristic in Acidogenic and Methanogenic Phase
in a Landfill
8
2.2
Comparison of Leachate Characteristics of Landfills Surveyed in
Asia, Europe and America
10
2.3
Relation between Landfill Age, Leachate Characteristics and Treatments 11
2.4
Classification of Types of Substances Using Molecular Weight Cutoff
12
2.5
Variation of COD, BOD & BOD/COD with Increasing Landfill Ages
15
2.6
Nitrogen Concentrations from Various Sources
15
2.7
Nitrogen Concentration Ranges in the Leachate for Landfill Stabilization 15
2.8
Summary of Biokinetic Coefficient of Activated Sludge Process for
Landfill Leachate Treatment
19
2.9
Operational and Environmental Conditions for Nitrification-
Denitrification Processes
23
2.10
Treatment Efficiencies of Different Aerobic Biological Treatment
Systems
25
2.11
Treatment Efficiencies of Different Anaerobic Biological Treatment
Systems
26
2.12
Membrane Processes
28
2.13
Removal Efficiency of Moderate to High Concentrations of Pollutants
Using Nanofiltration, Ultrafiltration and Reverse Osmosis
28
2.14
Typical Reverse Osmosis Plant Performance for Leachate Purification,
Germany
30
2.15
Treatment Efficiencies of Different Physico-chemical Treatment Systems 34
2.16
Typical Leachate Composition at Each Stage of Leachate Treatment Plant 39
2.17
Inhibitory Effect of Various Toxicants
41
2.18
Advantages and Disadvantages of Membrane Bioreactors
43
2.19
Operating Conditions of Membrane Bioreactor Process for Treatment
of
Different
Kinds
of Wastewater
46
2.20
Operating Conditions of Yeast System Compared with Activated
Sludge Process
51
2.21
Performance of Yeast Based Treatment System in Dried Food Products
and Marine Product Industry
51
3.1
Composition of Simulated Leachate
55
3.2
Operating Conditions for Yeast and Bacteria Acclimatization
56
3.3
Operating Conditions for Yeast and Bacteria Mixtures in Respirometer
57
3.4
Description of the Chemical Cleaning
60
3.5
Technical Parameters of the Experimental Plant
60
3.6
Experimental Operating Conditions of YMBR and BMBR Systems
62
3.7
Characteristics of Ultrafiltration Membrane
64
3.8
Parameters and Their Analytical Methods
66
4.1
Compositions of Leachate Simulated from Leachates Obtained from
Pathum-thani Landfill Site (PS) and Ram-Indra Transfer Station (RIS)
67
4.2
Biokinetic Coefficients of Yeast and Bacteria Sludge for the Leachates
74
4.3
Effect of Free Ammonia Concentration on Yield Coefficient and the
Specific Growth Rate of the Bacterial Sludge
76

ix
4.4
Effect of Free Ammonia Concentration on Yield Coefficient and the
Specific Growth Rate of the Yeast Sludge
77
4.5
Substrate Utilization by the Yeast and Bacterial Sludge
79
4.6
COD Removal Efficiency in YMBR System at Different HRT
85
4.7
COD Removal Efficiency in BMBR System at Different HRT
86
4.8
TKN Removal Efficiency in YMBR System
88
4.9
TKN Removal Efficiency in BMBR System
88
4.10
Membrane Cleaning Frequency in the MBR Systems
90
4.11
Membrane Resistance in the MBR Systems
90
4.12
Variation in Ammonia Removal Efficiency
94
4.13
Determination of Membrane Resistance of Membrane Module after
Clogging in BMBR system (A = 0.42 m2; Pore Size = 0.1 µm)
96
4.14
Contribution of BOD at 5, 10 and 15 Days to the Total 20 Days BOD
108
4.15
Sludge Properties in the YMBR and BMBR Systems
115
4.16
MLSS and MLVSS Concentrations in Yeast and Bacteria Reactors
116
4.17
Bound EPS Concentration in the YMBR and BMBR Systems
116
4.18
Soluble EPS Concentration in the YMBR and BMBR Systems
116
4.19
Conductivity and TDS Concentrations in Leachate and Effluents
117
4.20
Cost of Chemical Used for pH Adjustment
118
4.21
Total Chemical Cost Requirement for Each Treatment System
118

x
List of Figures
Figures Title
Page
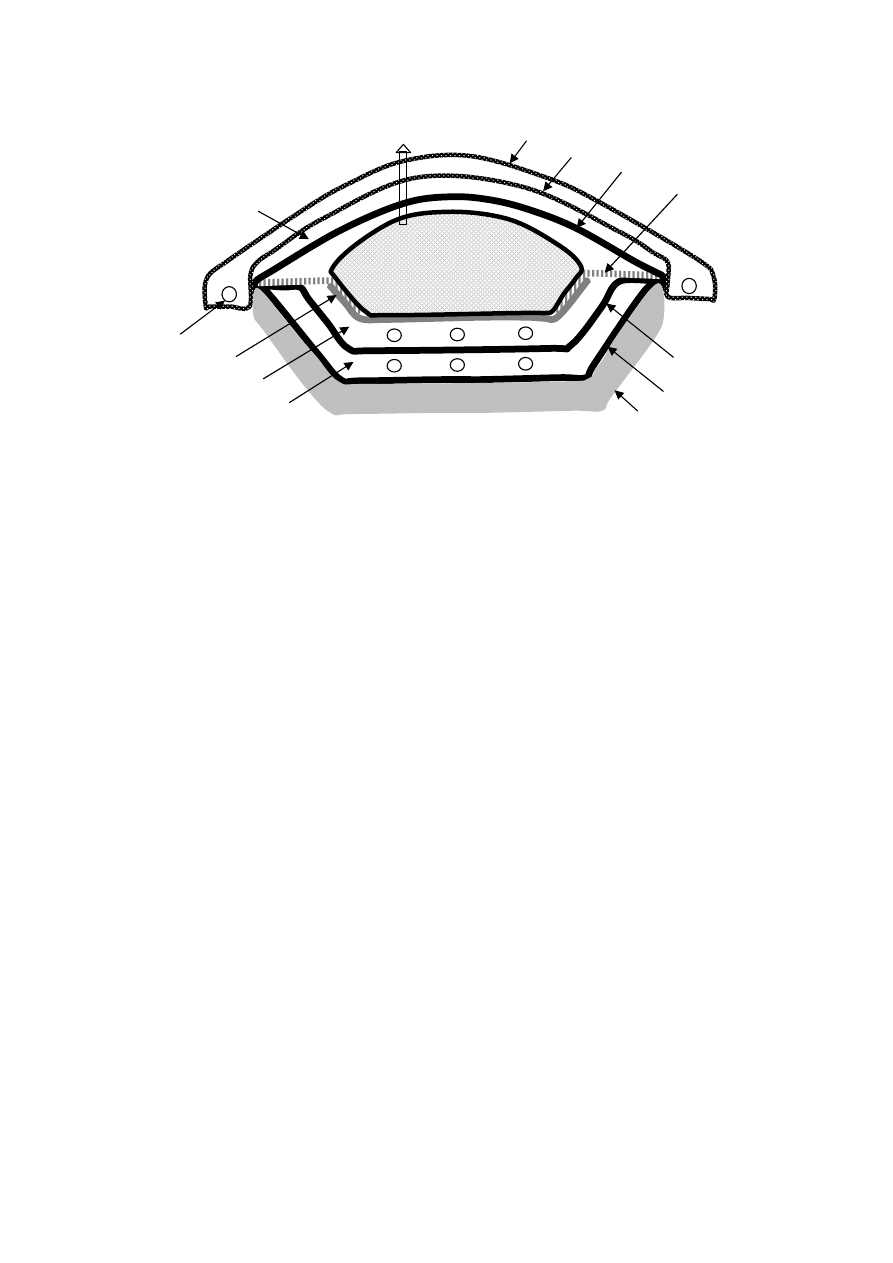
2.1
Schematic Representation of a Typical Engineered Landfill
6
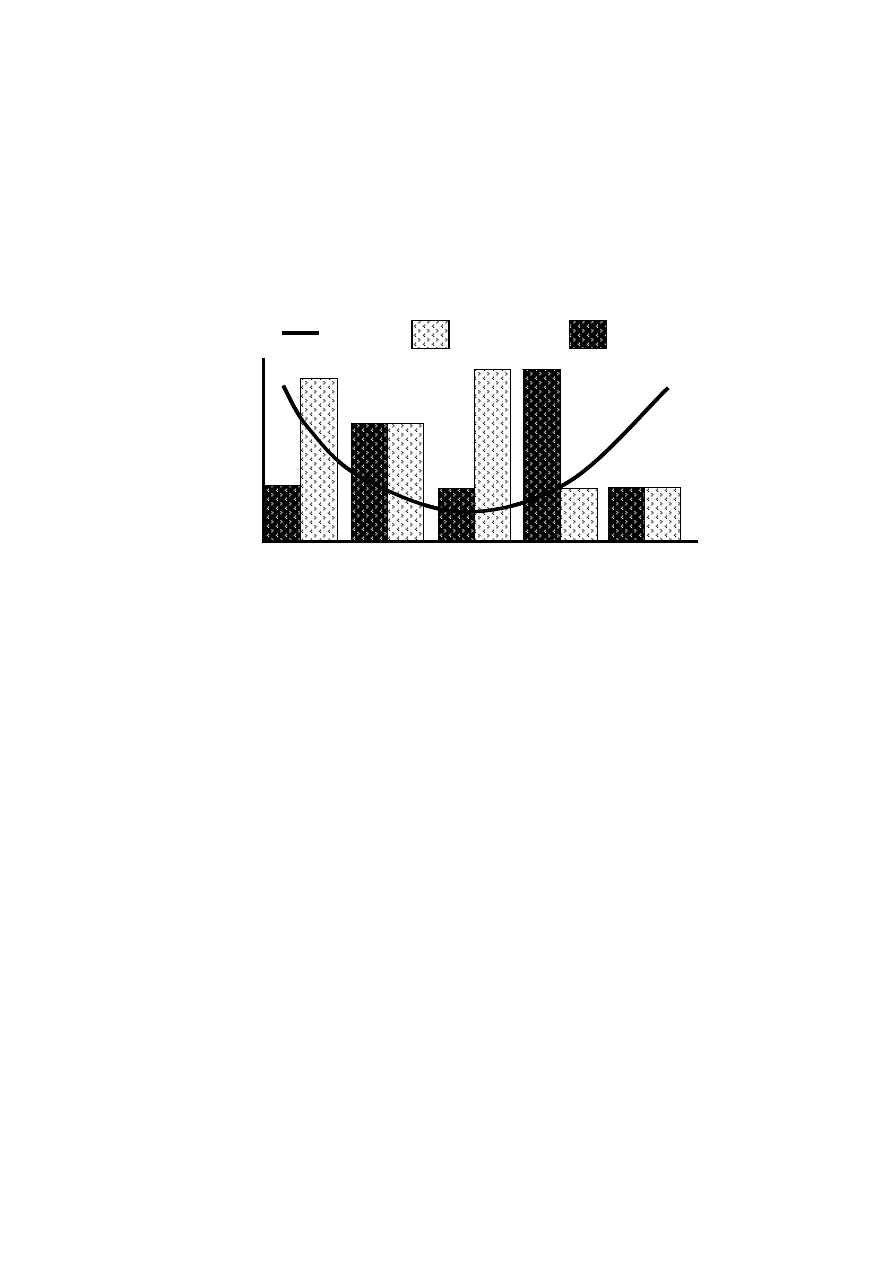
2.2
Changes in Significant Parameters during Different Phases of
Landfill Stabilization
7
2.3
Variation in Significant Pollutant Ratios with Increase in Age
of the Landfill
9
2.4
Water Movements in the Landfill
13
2.5
Leachate Productions and Rainfall Variation with Time
14
2.6
Treatment of Landfill Leacahte with Two Stage Reverse Osmosis
29
2.7
Schematic Diagram of Biological Treatment and Reverse Osmosis
for Leachate Treatment
37
2.8
Schematic Diagram of Microfiltration/Reverse Osmosis for
Leachate Treatment
38
2.9
Schematic Diagram of Denitrification-Nitrification/UF and
Reverse Osmosis for Leachate Treatment
38
2.10
Schematic Diagrams of (a) External Recirculation MBR and
(b) Submerged MBR System
42
3.1
Flowchart Showing Different Stages of Experimental Study
54
3.2
Diagram Illustrating the Enrichment Procedure
55
3.3
Respirometer
57
3.4
Experiments Conducted to Optimize Ammonia Stripping
59
3.5
Schematic Diagrams of Membrane Bioreactor with and without
Ammonia Stripping
61
3.6
Methodology for Performing Molecular Weight Cut-off Distribution
63
3.7 Flowchart Showing Ammonia Stripping Coupled MBR Process
65
4.1
Variation in F/M and COD Removal Efficiency in Yeast Sludge
69
4.2
Variation in F/M and COD Removal Efficiency in Bacterial Sludge
69
4.3
Increase in Biomass during Acclimatization of the Bacterial Sludge
70
4.4
Increase in Biomass during Acclimatization of the Yeast Sludge
71
4.5
Predominantly Spherical and Egg-shaped Yeasts with Budding in
the Yeast Reactor (x1500)
71
4.6
Bacteria Cells in the Mixed Bacteria Sludge: a) Gram Negative and
b) Gram Positive (x1500)
72
4.7
Specific Growth Rate of Mixed Bacteria Sludge with Increasing
Substrate Concentration
72
4.8
Specific Growth Rate of Mixed Yeast Sludge with Increasing
Substrate Concentration
72
4.9
Inhibition of the Yeast and Bacterial Culture with Increasing
Ammonium Chloride Concentration
77
4.10
Inhibitory Effect of Lead in Bacterial Sludge
79
4.11
Inhibition Effect of Lead in Yeast Sludge
80
4.12
Variation in Transmembrane Pressure with Permeate Flux (a) YMBR
and (b) BMBR
81
4.13
Variation in Organic Load with HRT
83
4.14
Variation in MLSS in the MBR Systems
83
4.15
Variation in pH in the MBR Systems
84

xi
4.16
COD Concentration in the Influent and Effluent in the BMBR and
YMBR at Different HRT
84
4.17
COD Removal Efficiency in the BMBR and YMBR at Different HRT
85
4.18
Variations in COD Removal Rate as a Function of F/M Ratio
86
4.19
TKN Removal Efficiency in the YMBR and BMBR with HRT
87
4.20
Cleaning of membranes in the YMBR and BMBR system in
relation to TMP
90
4.21
Variation in the Ammonia Removal Efficiency with pH
93
4.22
Ammonia Removal Efficiency with Varying Velocity Gradient and pH
93
4.23
Trans-membrane Pressure Variation in MBR Process for Ammonia
Stripped Leachate Treatment
96
4.24
Variation in COD at 16 and 24 h HRT
98
4.25
Variation in MLSS at 16 and 24 h HRT
98
4.26
COD Removal with and without Ammonia Stripping at 16 and 24 h HRT 99
4.27
Expected and Actual Improvement in COD Removal with Ammonia
Stripping in the YMBR and BMBR Systems
100
4.28
BOD in the BMBR and YMBR Effluent at 16 h HRT
101
4.29
BOD in the BMBR and YMBR Effluent at 24 h HRT
101
4.30
BOD Removal Efficiency in the BMBR and YMBR Systems
102
4.31
BOD/COD of the BMBR and YMBR Effluent
102
4.32
Influent and Effluent Nitrogen Content in BMBR at (a) 16 h HRT and
(b) 24 h HRT
103
4.33
Influent and Effluent Nitrogen Content in YMBR at (a) 16 h HRT and
(b) 24 h HRT
104
4.34
Overall TKN Removal in BMBR and YMBR with and without
Ammonia
Stripping
105
4.35
TKN Removal in MBR Process at 16 and 24 h HRT
106
4.36
Change of OUR at Different Time Period for Leachate Sample
107
4.37
20 Days BOD of the Raw Leachate and Stripped Leachate
109
4.38
20 Days BOD of the YMBR and BMBR Effluents
109
4.39
Molecular Weight Cut-off of Raw Leachate, Stripped Leachate,
Bacterial and Yeast Effluents
111
4.40
Percent Contribution of Various Molecular Weight Compounds to
the Total COD
111
4.41
Molecular Weight Cut-off of Leachate (a) COD (mg/L) (b) COD (%)
113
4.42
Molecular Weight Cut-off of Leachate (a) BOD (mg/L) (b) BOD (%)
114

xii
List of Abbreviations
AAS
Atomic Absorption Spectrophotometer
AnSBR
Anaerobic Sequencing Batch Reactors
AOX
Adsorbable
Organic
Halogens
AS
Activated
Sludge
BACFB Biological
Activated
Carbon Fluidized Bed Process
BOD
Biochemical Oxygen Demand
BMBR
Bacterial Membrane Bioreactors
C Carbon
cm
Centimeter
COD
Chemical Oxygen Demand
CST
Capillary Suction Time
d
Day
Da
Daltons
DO
Dissolved
Oxygen
DOC
Dissolved Organic Carbon
DSVI
Diluted Sludge Volume Index
EMBR
Extractive Membrane Bioreactor
EPS
Extracellular Polymeric Substances
F/M
Food/Microorganism
ratio
FS
Fixed
Solids
g
Gram
G
Mean velocity gradient
GAC
Granular Activated Carbon
h Hour
HRT
Hydraulic Retention Time
J Permeate
flux
k
Substrate removal rate
kDa
Kilo
Daltons
kg Kilogram
kPa
Kilo
Pascal
kWh
Kilowatt-hour
k
d
Endogenous decay coefficient
k
e
Mean reaction rate coefficient
K
s
Half-velocity
constant
L Liter
m Meter
m
2
Square
meter
m
3
Cubic
meter
m
3
/d
Cubic meter per day
mg/L
Milligram per liter
min
Minute
MAACFB Microorganism
Attached
Activated Carbon Fluidized Bed Process
MABR
Membrane Aeration Bioreactors
MBR
Membrane Bioreactor
MF
Microfiltration
MLSS
Mixed Liquor Suspended Solids
MLVSS
Mixed Liquor Volatile Suspended Solids
MW
Molecular
Weight

xiii
MWCO Molecular
Weight
Cut-off
MWW
Municipal Wastewater
N Nitrogen
NF
Nanofiltration
NH
3
-N
Ammonia Nitrogen
NH
4
-N
Ammonium Nitrogen
NO
2
-N
Nitrite Nitrogen
NO
3
-N
Nitrate Nitrogen
NOM
Natural Organic Matter
OLR
Organic Loading Rate
OUR
Oxygen Uptake Rate
P Phosphorus
Pa Pascal
PAC
Powder Activated Carbon
PS
Pathumthani Landfill Site
R Filtration
resistance
R
c
Resistance due to cake layer
R
m
Intrinsic
resistance
R
n
Resistance due to irreversible fouling
R
t
Total
resistance
RBC
Rotating Biological Contactor
RIS
Ram-indra
Transfer
Station
RO
Reverse
Osmosis
rpm
Rotations per minute
s Seconds
S
o
/X
o
Substrate/Biomass ratio
S
s
Readily
biodegradable
organics
SBR
Sequencing
Batch
Reactor
SCBP
Suspended Carrier Biofilm Process
SD
Standard
Deviation
SRT
Sludge Retention Time
SS
Suspended
Solids
SVI
Sludge Volume Index
T Temperature
TDS
Total Dissolved Solid
TOC
Total Organic Carbon
TKN
Total Kjedahl Nitrogen
TMP
Transmembrane
Pressure
TS
Total
Solids
TVS
Total Volatile Solids
U
Substrate Utilization Rate
UASB
Upflow Anaerobic Sludge Blanket
UF
Ultrafiltration
USB/AF
Upflow Hybrid Sludge Bed/Fixed Bed Anaerobic
UV
Ultraviolet
VFA
Volatile Fatty Acid
VLR
Volumetric
Loading
Rate
VS
Volatile
Solids
VSS
Volatile Suspended Solids
X
s
Slowly biodegradable organics

xiv
Y Yield
coefficient
YMBR
Yeast Membrane Bioreactor
Ө
c
Solid retention time
o
C Degree
Celsius
∆P
Transmembrane Ppessure
µ Vicosity
µm
Micrometer
µ
max
Maximum specific growth rate
µS/cm
Microsiemens per centimeter

1
Chapter 1
Introduction
1.1 Background
Rapid industrialization and urbanization has resulted in an immense environmental
degradation. Population growth and poor environmental management practices have led to
deterioration of environmental quality in most of the developing countries. The
composition of the domestic refuse has radically changed in character over the last fifty
years, due to the rise of an affluent society. In recent years, solid waste management has
gained focus in many countries. Source reduction, reuse and recycling of waste,
composting, incineration and landfill disposal are few of the solid waste management
approaches practiced in different countries. The suitability of these approaches differs from
place to place. Municipal solid waste disposal in the landfill is the most common, cheap
and easiest municipal solid waste management practice followed throughout the world.
However, landfill requires a close environmental engineering surveillance in its design and
operation as it is likely to generate leachate which would potentially contaminate nearby
groundwater and surface water. With the changing nature of domestic refuse composition
over the years, the proportion of refuse available for decomposition has greatly increased
and thus the organic strength of the leachate has increased, resulting in its greater potential
to pollute water. A need exist to focus on the environmental problems concerned with
domestic landfill disposal to protect the environment and prevent adverse health affects.
Surface water that percolates through the landfill and leaches out organic and
inorganic constituents from the solid waste is termed leachate. Landfill leachate production
starts at the early stages of the landfill and continues several decades even after landfill
closure. Landfill leachate is mainly generated by the infiltrating water, which passes
through the solid waste fill and facilitates transfer of contaminants from solid phase to
liquid phase. Due to the inhomogeneous nature of the waste and because of the differing
compaction densities that will be encountered, water will be able to percolate through and
appear as leachate at the base of the site. If no remedial measures are taken to prevent
continual inputs of water to the wastes, this could pose adverse environmental impacts.
Landfill leachate is high strength wastewater which contains high concentrations of
organic matter and ammonium nitrogen. There is a fluctuation in the composition of
organic, inorganic and heavy metal components in the leachate making them more difficult
to be dealt with. The composition depends on the landfill age, the quality and quantity of
solid waste, the biological and chemical processes occurring in the landfill, and the amount
of precipitation and percolation. When the leachate containing high strength organic matter
and ammonia is discharged without treatment, it can stimulate algae growth through
nutrient enrichment, deplete dissolved oxygen, and cause toxic effects in the surrounding
water environment. Landfill design and operation have a major impact and influence on the
leachate generation. This leachate varies from landfill to landfill and over time and space in
a particular landfill with fluctuations apparent over short and long-term periods due to
climatic, hydrogeology and waste composition variations (Keenan, et al., 1984). Generally,
leachate contaminants are measured in terms of chemical oxygen demand (COD) and
biological oxygen demand (BOD), halogenated hydrocarbons and heavy metals. In
addition, leachate usually contains high concentrations of inorganic salts - mainly sodium

2
chloride, carbonate and sulfate and is dependent on the waste composition land-filled. An
average fresh domestic refuse leachate can have a BOD of around 15,000 mg/L. When
compared to an average raw sewage BOD of 200 mg/L, it can be seen that landfill leachate
is around 75 times as strong in terms of its polluting potential.
Sufficient means have to be evolved to deal with landfill leachate so that its impact
can be minimized. Leachate treatment and prevention or minimization of leachate
generation is primarily the two prime options available for landfill leachate management.
Disposal of the leachate in the sewer is an attractive option, but the variation in the quality
of the sewage and leachate and remoteness of the landfill sites make this option difficult
practically. Leachate treatment has inevitably become a much more widespread
requirement at landfills. It is a technology which has only developed in 1980 in the UK,
but is now advancing rapidly as experience is being gained on full scale landfills
(Robinson, et al., 1992).The main environmental problem experienced at landfills has
resulted from a loss of leachate from the site and the subsequent contamination of
surrounding land and water. Improvements in landfill engineering has been aimed at
reducing leachate production, collecting and treating leachate prior to discharge and
thereby limiting leachate infiltration to the surrounding soil (Farquhar, 1989). However a
need exists to develop reliable, sustainable options to effectively manage leachate
generation and treatment. In designing a leachate treatment scheme, the process must
reflect the possibility that treatment techniques which work well for a young leachate may
become wholly inadequate as the landfill age increases.
There are difficulties concerned with the treatment of the leachate. First, the
variability and strength of the leachate have important waste treatment application. Second,
the changes encountered from landfill to landfill are such that waste treatment technology
applicable at one site may not be directly transferable to other location. Third, fluctuations
in the leachate quality which occur over both short and long interval must be accounted for
in the treatment design and long interval must be accounted for in the treatment design.
Current treatment practices in developed countries advocate leachate minimization
by operating landfills as dry as possible; this poses the problem of long-term landfill
stabilization. The alternative of operating the landfill as wet as possible by leachate re-
circulation does address the problem of leachate treatment by reducing organics. However,
this method does not prove effective in treating “hard COD” or refractory compounds and
nitrogen. Therefore, it does not meet municipal discharge standards. Various biological
treatment methods have been employed for the treatment of leachate from municipal solid
waste landfill. Extended aeration systems, sequencing batch reactors and aerated lagoons
can act as robust, stable and reliable means of treating leachate. These treatment systems
were found to be inefficient for leachate containing high strength organic substances and
ammonia nitrogen. In addition, the organic loading and pH are significant in influencing
the growth of nitrifying bacteria in nitrification process (Aberling, et al., 1992; Bea, et al.,
1997; Kabdasli, et al., 2000). Due to high ammonia concentrations in the leachate,
ammonia toxicity and sludge properties are affected in the biological treatment systems. A
reed bed treatment system can also be designed to treat effluent by passing it through the
rhizomes of the reed. However, such treatment systems would not deal satisfactorily
because reed bed are poor in removing ammonia. Additionally, ammonium concentration
as high as approximately 1,000 mg/L of untreated leachate feed, might be directly toxic
(Robinson, et al., 1992). The physical treatment systems used for treatment of the leachate
include activated carbon adsorption, filtration, evaporation; etc. These processes are

3
generally unsuccessful in removal of organic material from the raw leachate. The chemical
methods include coagulation and precipitation and oxidation of the organics. The
disadvantage of the coagulation and precipitation is that large amounts of sludge are
produced which is difficult to manage. Neither biological nor chemical/physical treatment
separately achieves high removal efficiency. Physical-chemical treatment is needed to
remove the metals and hydrolyze some of the organics whilst biological treatment is
necessary for stabilization and degradation of organic matter. Looking into these aspects,
landfill leachate treatment requires some advanced treatment technique, to meet the
required effluent standards.
Membrane bioreactor systems are an example of an emerging advanced leachate
treatment technology. Application of the membrane coupled activated sludge process in
leachate treatment is very promising because of the expected effluent quality. The design
of the membrane bioreactor is becoming more affordable and the equipment more reliable.
Membrane bioreactor systems are suspended growth activated sludge treatment systems
that rely upon the membrane equipment for liquid/solid separation prior to the discharge of
the leachate. Two reasons that exist for the poor removal efficiency of the individual
treatment system is the high percentage of high molecular weight organic material and
ammonium concentration to be removed and biological inhibition caused by the heavy
metal which may be present in the leachate.
Sufficient knowledge about the capability and the performance of membrane
bioreactors plants for leachate treatment is yet to be found. Moreover, membrane systems
are often subjected to clogging and this poses serious problems for operation and
maintenance. In order to reduce the problems of frequent membrane clogging, the
application of yeast culture to treat wastewater can be considered. The membrane
bioreactor system with yeast can be employed to treat the wastewater containing high
amount of dissolved solids, high concentrations of organic matter and other substances,
which are difficult to treat using conventional biological systems.
Consequently, depending on the characteristics of the leachate, a combination of
biological and physio-chemical processes can achieve high removal efficiencies. Thus, the
objective of this study is introducing the emerging technology of membrane bioreactors
and its role in leachate treatment. Thereafter, a rationale has been developed for the
treatment of the leachate produced under tropical conditions of Thailand. The experiments
have been conducted in the laboratory to find the performance of membrane bioreactor
using yeast culture (YMBR) and bacteria culture (BMBR) and coupled with ammonia
stripping for removal of organic substances from the landfill leachate. This treatment
system could act as an innovative approach in the future with regard to the landfill
management practices.
1.2 Objectives of the Study
The objectives of this study are to investigate the performance of membrane
bioreactor using yeast culture and bacteria culture and to examine the prospects of
applying membrane bioreactor in landfill leachate treatment. The specific objectives are as
follows:

4
1. To investigate and evaluate the performance of membrane bioreactor using yeast
culture (YMBR) and bacteria culture (BMBR) for the treatment of landfill leachate
containing high organic and high ammonia concentrations;
2. To investigate and evaluate the performance of ammonia stripping coupled
membrane bioreactor process for the landfill leachate treatment and to compare the
results with the treatment performance without pre-treatment;
3. To evaluate the respiratory inhibition effects of ammonia and lead concentrations on
mixed yeast and mixed bacteria culture;
4. To investigate the potential of ammonia stripping for ammonia removal and examine
the factors influencing the ammonia removal efficiency;
5. To understand the effect of membrane fouling through sludge characteristics.
1.3 Scope of the Study
To achieve the above mentioned objectives, the following tasks are undertaken:
1. Characterization and mixing of leachates obtained from Pathumthani landfill site
(PS) and Ram-indra transfer station (RIS) was done to simulate a medium-aged
leachate. The leachate COD concentration was maintained at 8,000±1,000 mg/L,
BOD/COD ratio at 0.40±0.05, and TKN concentration at 1,900±100 mg/L. This
laboratory simulated leachate was used to evaluate the performance of the treatment
process.
2. The yeast culture membrane bioreactor (YMBR) and bacteria culture based
membrane bioreactor (BMBR) were optimized varying the HRT and MLSS
concentrations. The optimum operational condition was evaluated in terms of organic
and TKN removal efficiencies and membrane filtration performance.
3. The removal of ammonia through ammonia stripping was carried out by varying the
pH, gradient velocity and contact time. The process efficiency was evaluated in
terms of ammonia removal efficiency. After the optimization of the operating
conditions of the ammonia stripping and the membrane bioreactor, the optimum
conditions were used to assess the efficiency of the membrane bioreactor using the
bacterial and yeast culture along with the ammonia stripping.
4. To evaluate the inhibition effects of ammonium (NH
4
-N) and lead (Pb) on mixed
yeast and mixed bacteria sludge. The NH
4
-N concentration was varied from 200 to
2,000 mg/L in both sludge. The lead nitrate (Pb(NO
3
)
2
) concentration in the bacteria
system was varied from 20 to 100 mg/L while in the yeast system was varied from 2
to 25 mg/L. The inhibitory effect was measured in terms of oxygen uptake rate
(OUR) using respirometric method.
5. The sludge characteristics were analyzed to understand their relationship with the
EPS formation in the membrane bioreactor. The molecular weight cut-off was also
done in the sludge along with the fraction causing COD.

5
Chapter 2
Literature Review
2.1 Introduction
A landfill is any form of waste land, ranging from an uncontrolled rubbish "dump" to
a full "containment" site engineered with high standards to protect the environment. The
landfill is the most economical form of solid waste disposal as adverse environmental
effects and other risks and inconveniences are minimized, thereby allowing waste to
decompose under controlled conditions until it eventually transforms into relatively inert,
stabilized material (Robinson and Maris, 1983). Most landfills can be operated
satisfactorily for at least some period in their lifetime in this manner and in absence of any
significant negative environmental impact.
Unfortunately, in warmer climates, the increase in leachate production after
precipitation is rapid (Lema, et al., 1988) due to rainfall exceeding the amount which can
be effectively evaporated during winter or rainy seasons. Hence, leachate generation needs
to be controlled and effective leachate treatment options have to be identified in order to
avoid negative impacts caused by the leachate.
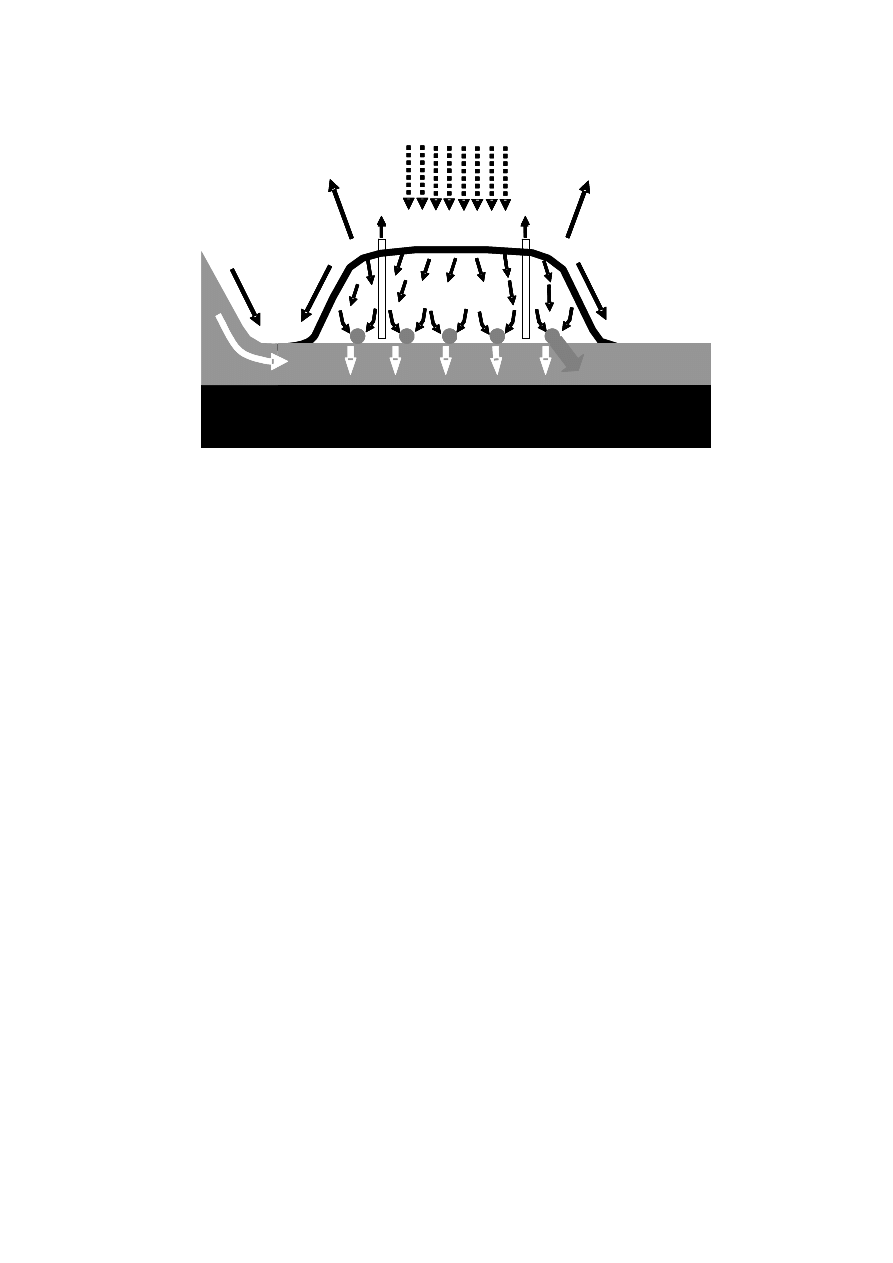
A common practice in controlling leachate generation is to control the water
infiltration in the landfill by waste compaction as it reduces the infiltration rate. Further, by
designing water proof covers and growing plants on the soil covers of the waste,
infiltration can be minimized. Figure 2.1 presents a typical engineered landfill. The landfill
leachate characteristic is controlled by solid waste characteristics, moisture content, pH,
redox potential, temperature, etc. The presence of moisture is necessary for the biological
conversions within the landfill and for landfill stabilisation, which occurs when there is
insufficient moisture. Degradation processes within the landfill are also temperature
dependent. The pH and redox potential set the conditions for the different phases of
degradation and biological processes within the landfill. Thus, the microbial composition
within the landfill effectively contributes to the landfill stabilization.
After the initial period of waste placement in a landfill, microbial processes proceed
under anoxic conditions. Hydrolytic and fermentative microbial processes solubilize the
waste components during the acid fermentation phase producing organic acids, alcohols,
ammonia, carbon dioxide and other low molecular weight compounds as major products.
This process occurs at a low pH (typically around 5) and is enhanced by the presence of
moisture within the landfill. After several months, the methane fermentation stage occurs.
Methanogenic leachate is neutral in pH and possesses moderate organic compounds which
are not easily degradable and are fermented to yield methane, carbon dioxide and other
gaseous end products (Harmsen, 1983; Farquhar, 1989).
6
Figure 2.1 Schematic Representation of a Typical Engineered Landfill
2.2 Solid Waste Management Practices
The safe and reliable long-term disposal of solid waste is an important component in
solid waste management. Municipal solid waste consists of inorganic substances such as
boxes, grass clippings, furniture, clothing, bottles, food scraps, newspapers, and appliances
along with organic waste. There are different methods employed in solid waste
management. Few of the management practices are as follows:
(a) Reduction in the exploitation of the resources and the minimization of waste
(b) Increase in recovery/reuse by placing increased responsibility on the producer
(c) Incineration
(d) Composting
(e) Landfilling, etc.
Landfilling or the land disposal is today the most commonly used method for waste
disposal. Landfill has been the most economical and environmentally acceptable method
for the disposal of solid waste throughout the world. Even with the implementation of
waste reduction, recycling and transformation technologies, disposal of solid waste in the
landfill still remains an important component of the solid waste management strategies.
Concerns with the landfilling of solid waste are related to (1) the controlled release
of landfill gases that might migrate off-site and cause odor and other potentially dangerous
conditions, (2) the impact of the uncontrolled discharge of landfill gases on the green
house effect in the atmosphere , (3) the uncontrolled release of leachate that may migrate
down to underlying groundwater or to surface water, (4) the breeding and harboring of
disease vectors in an improperly managed landfills, and (5) the health and environmental
impacts associated with the release of trace gases arising from the hazardous materials.
2.3 Municipal Solid Waste Landfill
Perimeter
Collection Pipe
Low Permeability Soil
Collection
Pipes
Collection
Pipes
Drainage
Layer
Gas Vent
Solid waste
Lower Component
(Compacted Soil)
Upper
Component
Top Liner
(FML)
Native Soil Foundation
Filter
Layer
Leachate Collection
System
Leak Detection
System
Protective Soil
or Cover
Barrier Layer
(FML)
Filter Layer
Compacted
soil
Cap Drainage
System
Drainage Layer
Top Soil
Final Soil Cover
7
In the municipal solid waste landfill, biodegradable waste constituents are converted
into intermediates and end products, primarily by initial hydrolysis to intermediate
substrates which support acidogenesis and product are subsequently utilized as precursor
for gas formation during methanogenesis in the five degradation phases (Pohland and
Harper, 1985; Pohland and Kim, 1999). Figure 2.2 represents variation in concentrations of
significant parameters during the five degradation phases.
Figure 2.2 Changes in Significant Parameters during Different Phases of Landfill
Stabilization (Pohland and Harper, 1985)
The trend in the degradation phase may not uniform throughout the landfill since
there are certain regions in the landfill which are dominated by a particular degradation
phase. Hence, the leachate generated is a combination of the products of different
microbial and physico-chemical processes taking place within the landfill.
2.4 Municipal Solid Waste Landfill Leachate
Landfill leachate is a high-strength wastewater formed as a result of percolation of
rainwater and moisture through waste in a landfill. The liquid medium absorbs nutrients
and contaminants from the waste and thus posing hazard to the receiving water bodies.
Leachate contains many substances, depending upon the types of waste disposed into the
landfill. Leachate may be toxic to life or may simply alter the ecology of the stream
watercourse, if not removed by treatment.
Depending on the geographical and geological nature of a landfill site, leachate may
seep into the ground and possibly enter groundwater sources. Though part of the
contaminants from the leachate can be removed by natural processes within the ground,
groundwater contamination can be hazardous as drinking water sources may be affected.
The simplest method of leachate treatment is disposal into the public sewer. However,
as there is considerable difference between the leachate and domestic wastewater
characteristics, the volume of leachate discharged is limited. Further, depending on
Carbon
Emission
Heavy Metal
Emission
Redox
Potential
Concentrat
io
n
Low
High
Aerobic
Acidogenic Methanogenic Oxidation Weathering
Degradation Phases
Carbon
Emission
Heavy Metal
Emission
Redox
Potential
Carbon
Emission
Heavy Metal
Emission
Redox
Potential
Concentrat
io
n
Low
High
Aerobic
Acidogenic Methanogenic Oxidation Weathering
Degradation Phases
8
leachate characteristics, it may be necessary to pre-treat leachate prior to discharge in
wastewater treatment plants so that it does not upset the biological process nor cause any
operational and maintenance problems in the treatment plant. In determining a treatment
scheme for leachate treatment, it is also necessary to determine whether the leachate
effluent meets sewer or water body discharge standards.
2.5 Leachate Composition and Characteristics
During the first few years (< 5 years), the landfill is in acidogenic phase and the
leachate generated is generally referred to as “young” or carbon-based leachate due to the
high concentration of organic carbon present. Landfill greater than 10 years old are
generally in the methanogenic phase and the leachate generated is referred to as “old” or
nitrogen-based leachate (Mavinic, 1998). Table.2.1 gives the characteristic of leachate
present in acidogenic and methanogenic phases.
Table 2.1 Leachate Characteristic in Acidogenic and Methanogenic Phase in a Landfill
(Ehrig, 1998)
Parameter Unit
Average Range
Acidogenic Phase
pH
6.1
4.5 to 7.5
BOD
5
mg/L
13,000
4,000 to 40,000
COD
mg/L
22,000
6,000 to 60,000
BOD
5
/COD
0.58
-
SO
4
mg/L
500
70 to 1,750
Ca
mg/L
1,200
10 to 2,500
Mg
mg/L
470
50 to 1,150
Fe
mg/L
780
20 to 2,100
Mn
mg/L
25
0.3 to 65
Zn
mg/L
5
0.1 to 120
Methanogenic Phase
pH
8
7.5 to 9
BOD
5
mg/L
180
20 to 550
COD
mg/L
3,000
500 to 4,500
BOD
5
/COD
0.06
-
SO
4
mg/L
80
10 to 420
Ca
mg/L
60
20 to 600
Mg
mg/L
180
40 to 350
Fe
mg/L
15
3 to 280
Mn
mg/L
0.7
0.03 to 45
Zn
mg/L
0.6
0.03 to 4
The differences in leachate quality can be due to varied reasons, which can be
categorised into four major divisions, namely the waste (type of waste, degree of
decomposition, and possible seasonal variance), landfill environment (phase of degradation,
humidity, temperature etc.), filling technique (compacting, cover, height of landfill layers,
etc.) and sampling (method of analysis and point of sample collection).
The factors affecting the leachate quality is inter-related and affects the overall
variance in leachate quality and characterization. The changes in the BOD/COD,
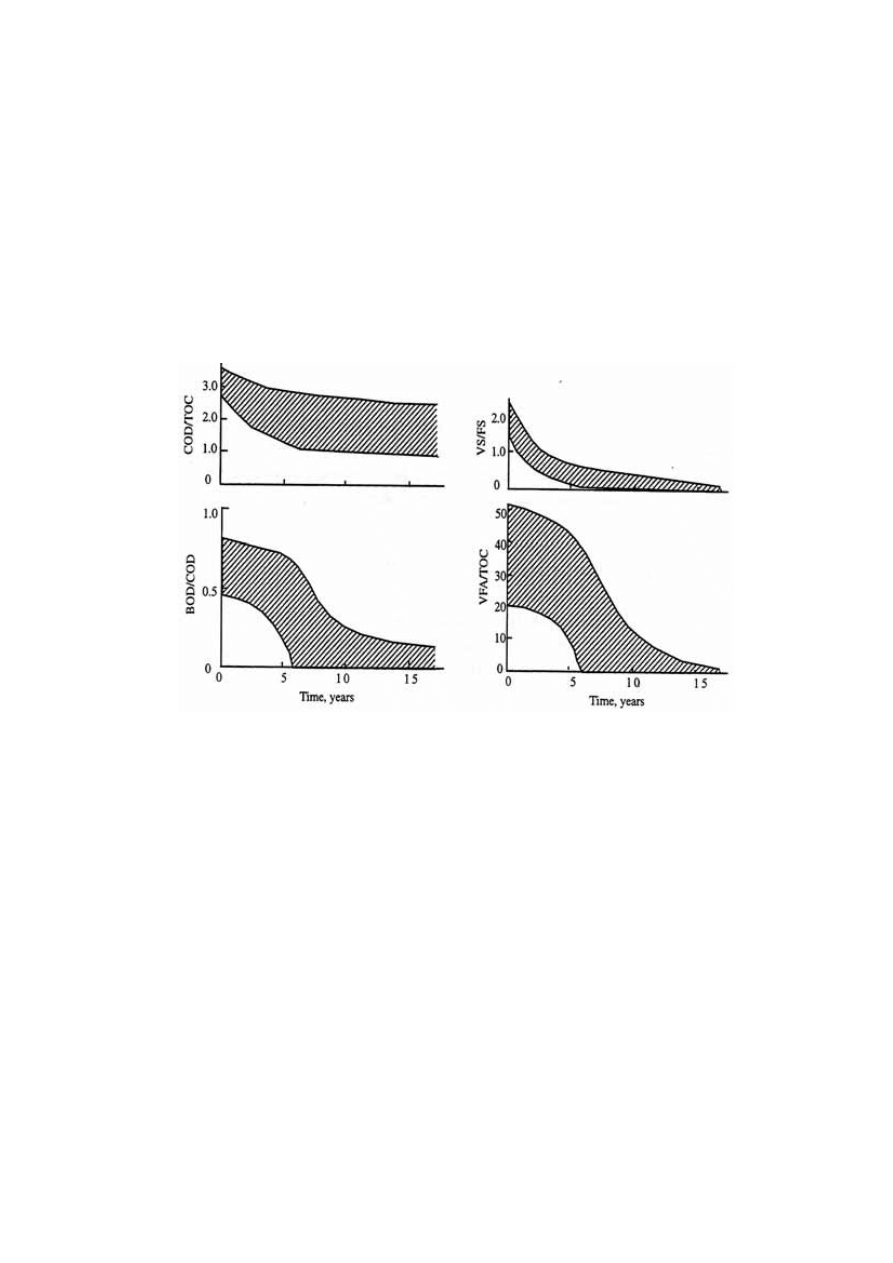
9
COD/TOC, VS/FS and VFA/TOC ratios of leachate are depends greatly on the age of the
landfill (Chian and DeWalle, 1976; Kylefors, 1997). Figure 2.3 represents the trend of
leachate variation and over the period of time in the landfill. During the initial stages, the
landfill is aerobic rich in biodegradable organic content. As the landfill age increases, the
microorganism present in the landfill tend to degrade these organic compounds into
inorganic components. When anaerobic phase begins, the COD starts increasing causing a
decrease in BOD/COD ratio. This decrease in BOD/COD ratio observed, suggests the
change in biodegradability of the leachate with time. For young landfill, the ratio is around
0.5-0.8 while it reaches almost 0.1 in the old landfill. The reason for low biodegradability
in the old landfill could be due to the presence of humic and fluvic acids.
Figure 2.3 Variation in Significant Pollutant Ratios with Increase in Age of the Landfill
(Chian and DeWalle, 1976)
The ammonium concentration in the leachate also varies with age of the landfill, with
young leachate having a high COD (>5,000 mg/L) and low nitrogen content (< 400 mg
N/L) and old leachate having a high concentrations of ammonia (> 400 mg N/L) and
recalcitrant compounds and a low biodegradable organic fraction (BOD
5
/COD = 0.1).
Municipal solid waste landfill in Asia (except Japan) is characterized by 60 to 90 %
organic waste and 3 to 18 % plastic (Agamuthu, 1999). Leachate characteristics of landfills
surveyed in Asia including Thailand, Europe, and America are presented in Table 2.2. The
characteristic of leachate from different landfill site as reported show a great variation. It is
dependent on the solid waste composition, landfill site location, and local climate. The
BOD and COD concentrations decrease as the landfill age increases.
10
Table 2.2 Comparison of Leachate Characteristics of Landfills Surveyed in Asia, Europe and America
Thailand
1,2
Malaysia
3
Parameter
Phitsanuklok Pathumthani Nakhonpathom Pathumthani On-Nutch
Air
Hitam
Sabak
Bernam
Taman
Beringin
HongKong
4
USA
5
Europe
6
Years in
operation 1
3
4
9 20 5 7 16 6 10 1 5 16
-
Alkalinity 300-4,700 918-4,250 960-2,740
6,620
-
1,540-
9,000
1,200-
1,550
3,750-
9,375
10,700-
11,700
3,230-
4,940
800-
4,000
5,810 2,250
300-
11,500
pH 7.1-8.3
8.2-8.9
8.2-8.5
8.1
7.5
7.6-8.8
8.0-801
7.8-8.7
8.1-8.6
7.6-8.1
5.2-6.4
6.3
-
5.3-8.5
Chloride
-
1,220-5,545
655-2,200
2,530
-
1,625-
3,200
420-
1,820 875-2,875
2,320-
2,740 522-853
600-800 1,330
70
-
SS 1,950
29-110
8.4-15.7
12.5
488
410-
1,250
111-920
420-1,150
40-53
3-124
-
-
-
-
TS 6,700
350-1,598
274-1,200
848
11,320
13,930-
15,380
-
10,300-
13,680
-
-
100-700
-
-
-
COD 4,900-11,000
1,488-3,200
800-3,575 3,200 1,200
1,724-
7,038
1,250-
2,570
1,960-
5,500
2,460-
2,830 641-873
10,000-
40,000 8,000 400
150-
100,000
BOD 3,000-7,150
198-260
100-240 280 130
1,120-
1,800
726-
1,210
562-1,990
-
-
7,500-
28,000
4,000 80
100-
90,000
TKN
-
240-452
64-1,260
1,256
700
131-930
-
104-1,014
2,219-
2,860
889-
1,180
-
-
-
50-5,000
NH
3
-N
150-1,250
-
-
-
-
2-32
3-8
2-47
1,190-
2,700
784-
1,156
56-482
-
-
1-1500
Ni
0.02-1.56
0.01-0.42
0.1
0.25
0.035
0.13-0.95
-
0-0.6
-
-
-
-
-
0.02-2.05
Cd
0.037
0.02
0.001
0.002
-
0-0.23
0-0.001
0-0.15
-
-
-
<0.05
<0.05
0.14
Pb
0.03-0.45
0.07
0.05
-
0.52
0-5.37
0-0.03
0-3.45
-
-
-
0.5
1.0
1.02
Cr
-
0.01-0.52
0.08-2.9
0.07
-
0.24-0.94
-
0.04-0.70
-
-
-
-
-
0.03-1.60
Hg
0.50-1.70
-
-
-
0.684
-
-
-
-
-
-
-
-
0.05
Note: All data with the exception of pH values are in mg/L.
1. Pollution Control Department, 2000 3. Agamuthu, 1999 5. Qasim and Chiang, 1994
2. Sivapornpun, 2000 4. Robinson and Luo, 1991 6. Andreottola and Cannas, 1992

11
Table 2.3 presents the general leachate characteristics with age and suitability of
treatment options in terms of biodegradable, intermediate and stabilized landfill leachate.
As the young landfill is rich in organic, biological treatment is more appropriate than
physico-chemical which is suitable for the old landfill. However, effectiveness of
combined treatment process for the treatment of a leachate produced at specific landfill age
has not been considered. Individual treatment options cannot be a long-term solution for
leachate treatment as they are not effective in treating leachate generated at different period
of time and do not adapt to changing leachate characteristics.
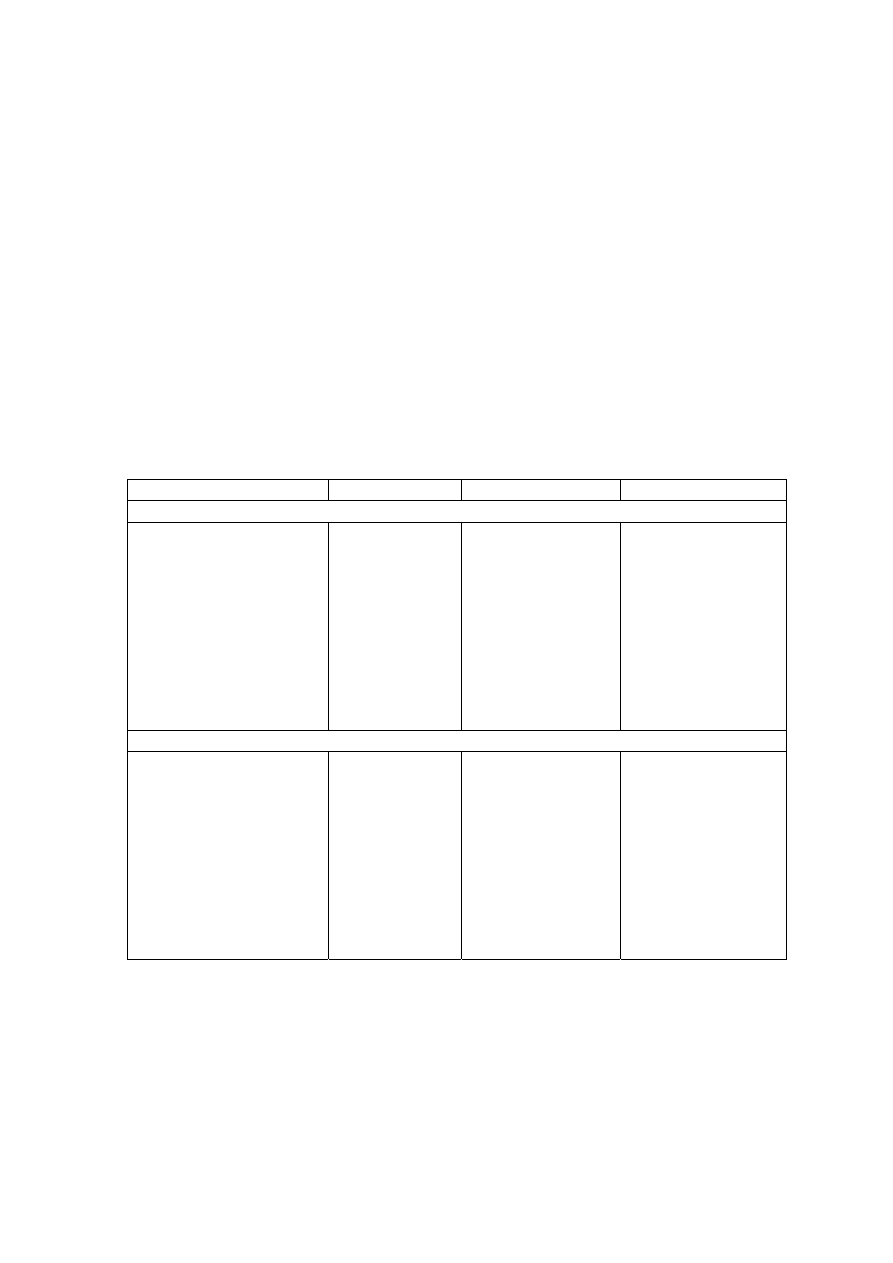
Table 2.3 Relation between Landfill Age, Leachate Characteristics and Treatments
(Amokrane, et al., 1997)
Landfill Age (years)
< 5 (young)
5 to 10 (medium)
> 10 (old)
Leachate Type
I (biodegradable)
II (intermediate)
III (stabilized)
pH
< 6.5
6.5 to 7.5
> 7.5
COD (mg/L)
> 10,000
< 10,000
< 5,000
COD/TOC
< 2.7
2.0 to 2.7
> 2.0
BOD
5
/COD
< 0.5
0.1 to 0.5
< 0.1
VFA (% TOC)
> 70
5 to 30
< 5
Process Treatment
Efficiency
Biological Treatment
Good
Fair
Poor
Chemical Oxidation
Fair-poor
Fair
Fair
Chemical Precipitation
Fair-poor
Fair
Poor
Activated Carbon
Fair-poor
Good-fair
Good
Coagulation-flocculation Fair-poor Good-fair
Good
Reverse Osmosis
Fair
Good
Good
2.6 Molecular Weight Distribution in Landfill Leachate
Ultrafiltration (UF) is demonstrated to be an effective method for characterizing
leachate on the basis of molecular weight (MW) distribution (Gourdon, et al., 1989; Tsai,
et al., 1997; Yoon, et al., 1998; Kang, et al., 2002). The UF cell is operated in a batch
mode with nitrogen gas applied to pressurize the system, producing a driving force for
leachate to permeate through the membranes.
The organic components of leachate are mainly composed of water soluble
substances. The suspended solid content of leachate is generally very low. Organic matter
is dependent on the waste composition and degree of degradation. The predominant
substances in each fraction are given in Table 2.4.
Low molecular weight organics are composed mainly of easily degradable volatile
fatty acids, which contribute to 90 % of this fraction. The most frequently occurring fatty
acids are: acetic, propionic and butanic acids.
Medium molecular weight compounds with molecular weight between 500 and
10,000 Da are characteristic of fulvic acid and humic fraction present in leachate. This
group is dominated by carboxylic and hydroxylic groups and are difficult to degrade, thus
termed refractory compounds. The high molecular weight organic fraction varies from 0.5
% in methanogenic landfill leachate to 5 % in acidogenic landfill leachate. These
compounds are more stable and possibly originate from cellulose or lignin.

12
Table 2.4 Classification of Types of Substances Using Molecular Weight Cutoff (Chian,
1977; Harmsen, 1983)
Division Molecular
Weight
Substances
MW <500 Da
Low Molecular Weight
Volatile fatty acids
Amino acids, Alcohol, Organic acids
MW 500-10,000 Da Medium Molecular
Weight
Carboxyl and aromatic hydroxyl
groups
Fulvic-like substances
MW >10,000 Da
High Molecular Weight
Carbohydrates, Proteins
Humic carbohydrate-like substances
Thurman and Malcolm (1981) reported humic substances (hydrophobic acids)
accounted for about 50 to 90 % of the dissolved organic carbon (DOC) present in leachate,
whereas Imai, et al. (1995) indicated that humic substances contributed to only 30 % of the
DOC. This implies that non-humic substances (hydrophobic neutrals and bases,
hydrophilic acids, neutrals and bases) may be more important than humic substances in
terms of refractory characteristics of leachate.
The effectiveness of a treatment process can be related to the removal of specific
organic fraction in leachate. Both fulvic and humic substances are inert to biological
treatment. The accumulation of high molecular humic carbohydrates were found to affect
bacteria flocculation (Chian and DeWalle, 1976). Therefore, fractionating the organic
based on molecular weight, is an indication of the removal efficiency and degradation
potential of the biological system.
Generally, leachate is highly contaminated with organic concentrations measured as
BOD and COD, with ammonia, halogenated hydrocarbons and heavy metals. The humic
substances constitute an important group of organic matter in leachate (Chain, 1977;
Lecoupannce, 1999). These substances can be compared with humic substances of natural
organic matter (NOM). Humic substances are refractory anionic macromolecules of
medium MW (1,000 Da MW- fluvic acids) to high MW (10,000 Da MW-humic acids).
They contain both aromatic and aliphatic components with primarily carboxylic and
phenolic functional groups. In many case, 500 to 1,000 Da MW fluvic-like fraction
increases with landfill ages and after a biological treatment (Mejbri, et al., 1995).
Therefore, a post treatment step is usually required for complete removal of organics
(Rautenbach and Mellis, 1994).
2.7 Factors Affecting Leachate Composition
In order to arrive at an appropriate treatment process, it is necessary to understand
the leachate characteristic and the factors affecting it. Generally, the quantity of leachate is
a direct function of the amount of external water entering the landfill. Landfill leachate is
composed of the liquid that has entered the landfill from external sources, such as surface
drainage, rainfall, groundwater and the liquid produced from the decomposition of waste.
A generalised pattern of leachate formation is presented in Figure 2.4.
13
Figure 2.4 Water Movements in the Landfill
2.7.1 Seasonal Variation
Rainfall acts as a medium of transportation for leaching and migration of
contaminants from a landfill. Rainfall also provides the required moisture content for
methane production and biological activity. Figure 2.5 shows that the leachate production
varies to a great extent with the amount of rainfall. It has been experienced that in hot and
humid climates, leachate production is much higher and varies more than in hot and arid
regions due to intensive microbial activity
(Trankler, et al., 2001). During dry season, the
leachate production is very low due to the evaporation whereas in raining season, the
leachate production is related to amount of rainfall intensity. Therefore, when designing a
landfill for disposal of municipal waste, and developing a treatment scheme for leachate
treatment, the quality and quantity of leachate may be influenced by climate and microbial
activity
.
On the other side, though high rainfall leads to increased leachate production, it
reduces leachate strength due to the dilution. The quality of leachate produced may be
regarded as proportional to the volume of water percolating through the landfill waste.
Reduction of the quantity of water entering the tip is therefore of great importance in
reducing the rate of leachate generation (Tatsi and Zouboulis, 2002). Few researchers have
measured the temporal variation in leachate production as 2-45 L/s, depending largely on
the precipitation over the landfill (Martin, et al., 1995). The influence of seasonal variation
in the landfill leachate quality and quantity varies from place to place which is also
influenced by other factors. It is necessary to consider the hydrological and leachate quality
data while suggesting a treatment for leachate to avoid environmental deterioration
problems caused by direct disposal.
Precipitation
Ground
Ground
Leachate
Surface runoff
Surface
runoff
Evaporation
Evaporation
Storage
Gas
Gas
Ground water
Ground water
Leachate
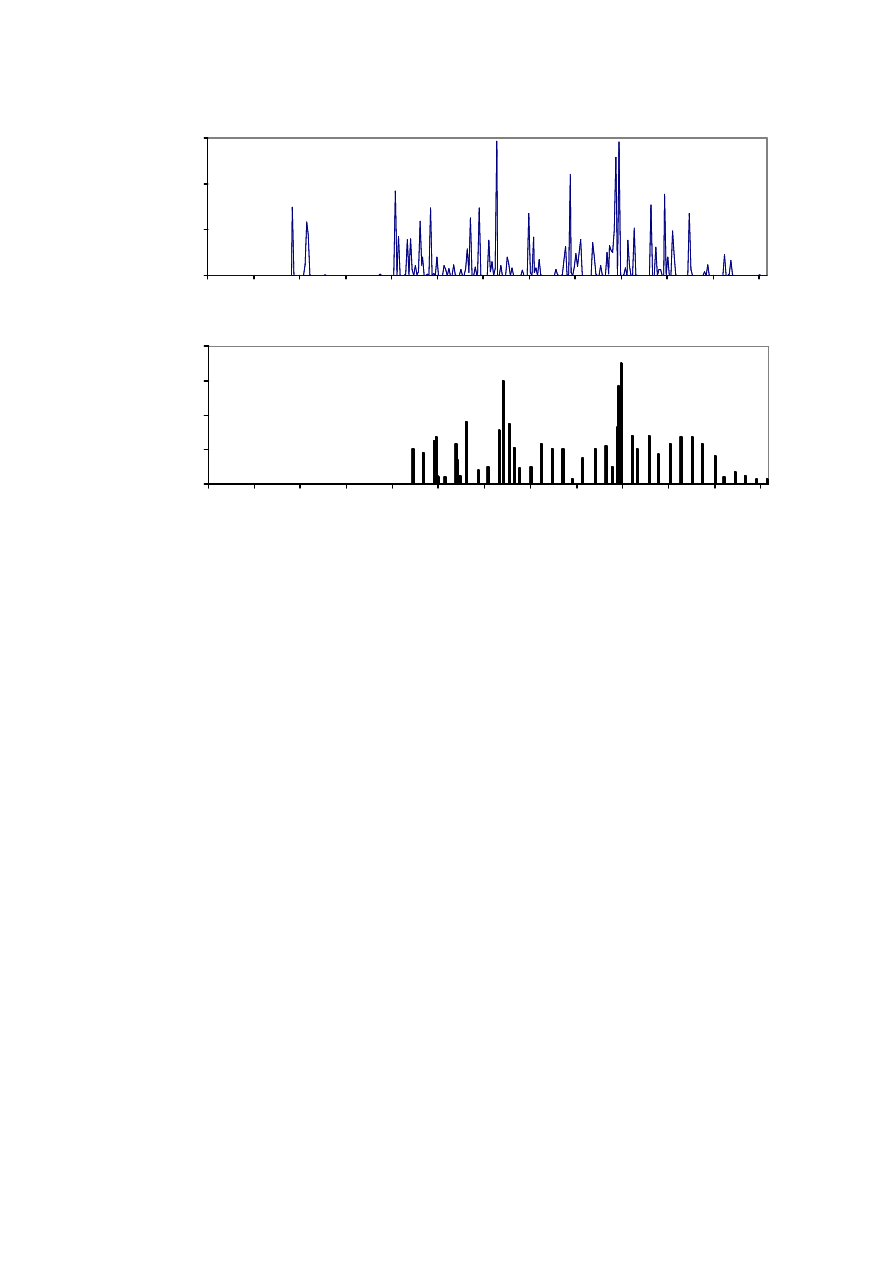
14
Figure 2.5 Leachate Productions and Rainfall Variation with Time
(Visvanathan, et al., 2003)
2.7.2 Landfill Age
Leachate sampling and analysis are of importance in assessing the changes in
leachate quality over a period of time. A distinction of the age of a landfill can be made on
the basis of the dominating degradation phase within the fill and the composition of the
leachate generated. The response of landfill leachate quality and quantity to the climatic
variation depends on the age of the landfill. Few significant variations such as a decreasing
trend of BOD/COD are evident as the landfill age increases. The BOD/COD ratio depicts
the biodegradability of the leachate, with a ratio of 0.5 indicating a readily degradable
organic material while a value of 0.1 or below represents a high fraction of poorly
degradable organic material in the leachate (Table 2.3). The variation in the quality of
leachate from a landfill in Taiwan composed of ten different units closed each year is
expressed in Table 2.5. From the given table, it could be observed that as the landfill gets
stabilized, BOD and COD concentrations reduce along with decrease in biodegradability.
Nitrogen concentration is another indicator which signifies the age of the landfill leachate
as presented in Table 2.6 and 2.7. The ammonia concentration in leachate is high due to
hydrolysis, decomposition, and fermentation of biodegradable substrate. Owing to the
anaerobic conditions within landfill, nitrite and nitrate concentrations are low. In the first
few years, the ammonia concentration tends to increase slightly over time and then
decreases as the landfill age increases. Thus, it could be appropriate to say that looking at
the leachate characteristic, the age of the landfill can be predicted to a great extent.
0
20
40
60
80
1/
1/
02
31
/1
/0
2
2/
3/
02
1/
4/
02
1/
5/
02
31
/5
/0
2
30
/6
/0
2
30
/7
/0
2
29
/8
/0
2
28
/9
/0
2
28
/1
0/
02
27
/1
1/
02
27
/1
2/
02
Date/Month/Year
0
20
40
60
1/
1/
02
31
/1
/0
2
2/
3/
02
1/
4/
02
1/
5/
02
31
/5
/0
2
30
/6
/0
2
30
/7
/0
2
29
/8
/0
2
28
/9
/0
2
28
/1
0/
02
27
/1
1/
02
27
/1
2/
02
L
e
ac
h
ate
P
ro
d
u
cti
o
n
(
L
/d
)
Ra
in
fa
ll
(
m
m
)
0
20
40
60
80
1/
1/
02
31
/1
/0
2
2/
3/
02
1/
4/
02
1/
5/
02
31
/5
/0
2
30
/6
/0
2
30
/7
/0
2
29
/8
/0
2
28
/9
/0
2
28
/1
0/
02
27
/1
1/
02
27
/1
2/
02
Date/Month/Year
0
20
40
60
1/
1/
02
31
/1
/0
2
2/
3/
02
1/
4/
02
1/
5/
02
31
/5
/0
2
30
/6
/0
2
30
/7
/0
2
29
/8
/0
2
28
/9
/0
2
28
/1
0/
02
27
/1
1/
02
27
/1
2/
02
L
e
ac
h
ate
P
ro
d
u
cti
o
n
(
L
/d
)
Ra
in
fa
ll
(
m
m
)

15
Table 2.5 Variation of COD, BOD & BOD/COD with Increasing Landfill Ages
(Ragle, 1995)
Age (year)
1 2 3 4 5 6 7 8 9 10
11
BOD
(mg/L)
25,000
10,000 290 260 240 210 190 160 130 100 80
COD
(mg/L)
35,000 16,000 1,850 1,500 1,400 1,200 1,200 1,150 1,100 1,050 1,000
BOD/COD 0.71 0.60 0.17 0.17 0.16 0.16 0.14 0.13 0.10 0.08 0.08
Table 2.6 Nitrogen Concentrations from Various Sources
Sample
Age
(Year)
NH
3
-N
(mg/L)
Organic-N
(mg/L)
NO
3
-N
(mg/L)
Sewage
1
-
15
10
0
Young leachate
1
1
1,000-2,000
500-1,000
0
Pillar Point (Hong Kong)
6
2,563
197
2.5
Ma Yau Tong (Hong Kong)
2
10 1,156
24 1.1
Several sites (Germany)
1
12
1,100 - -
Du Page Co. (Illinois)
1
15
860
-
-
Rainham (UK.)
1
24
17
-
-
Waterloo (Canada)
1
35
12
-
-
Sources: 1 McBean, et al., 1995. 2 Robinson and Luo, 1991
Table 2.7 Nitrogen Concentration Ranges in the Leachate for Landfill Stabilization
Leachate/Gas
Constituent
Transition
Phase
Acid Formation
Phase
Methane
Fermentation
Phase
Final
Maturation
Phase
TKN (mg/L)
180-860
14-1,970
May be low due to
microbial assimilation
of nitrogeneous
compounds
25-82
Low due to
microbial
assimilation of
nitrogeneous
compounds
7-490
NO
3
-N (mg/L)
0.1-5.1
Increasing due
to oxidation of
ammonia
0.05-19
Decreasing due to
reduction to NH
3
or
N
2
gas
Absent
Complete
conversion to NH
3
or N
2
gas
0.5-0.6
NH
3
-N (mg/L)
120.125
2-1,030
Increasing due to NO
3
reduction and protein
breakdown
6-430
Decreasing due to
biological
assimilation
6-430
NH
3
/TKN Ratio
0.1-0.9
0-0.98
Protein breakdown;
biological
assimilation
0.1-0.84
0.5-0.97
Nitrogen Gas (%)
70-80
Influence of
trapped air
60-80
Decreasing due to
dilution with CO
2
< 20
Artefact of trapped
air; denitrification
> 20
Aerobic
metabolism

16
2.7.3 Composition of the Waste Dumped
The leachate quality is greatly affected by refuse composition. Organic material
present in the waste mainly comprises of kitchen waste while the inorganic constituents
consists of the plastic, glass, metal, etc. The leachate composition depends upon the ratio
of organic and inorganic components present in the waste disposed in the landfill. It is
estimated that approximately one half of the municipal solid waste is typically composed
of cellulose and hemicellulose (Fairweather and Barlaz, 1988; Barlaz, et al., 1989), which
are considered readily degradable in the environment. The organic content leached into the
leachate is as a result of hydrolysis and degradation of higher molecular weight organic
compounds by the microorganisms present in the waste. However, it has been shown that
readily degradable refuse components can sometimes persist for surprisingly long periods
of time in landfills owing to several environmental factors that limit the microbial growth
(Suflita, et al., 1992; Gurijala and Suflita, 1993). The other factors which influence the
leachate are the moisture content, nutrients and organic loading in the solid waste disposed.
2.7.4 Geological Characteristic
As the leachate percolates through the underlying strata, many of the chemical and
biological constituents originally contained in it will be removed by filtering and
adsorptive capacity of the material composing the strata. In general, the extent of this
action depends on the characteristics of the soil and especially the clay content. With this
potential, it can allow the leachate to percolate into the landfill for elimination or
contamination, thereby playing a role in affecting the leachate quantity. The influence of
soil particle size, the type of soil in the underlying ground and cover material are factors
that further influence leachate production and strength.
2.7.5 Filling Technique
Various factors during the filling of the municipal solid waste in the landfill
influence the leachate quality and quantity to a great extent.
Filling Height: The surface to volume ratio of the waste in landfill has an impact
over the infiltration, heat transfer and gas exchange occurring within the landfill. It is
expected that an increase in landfill height may limit the affect of seasonal variation in the
leachate composition and can preserve the heat from the microbial action to enhance
further degradation. However, aerobic conditions can be hindered due to limitations in gas
transfer, thereby converting it into anaerobic conditions, thus affecting the leachate quality.
Density: Waste with low density results in a larger volume of air infiltrating through
the landfill and thus promoting aerobic degradation process. This enhances the degradation
of easily degradable waste fractions and complex organic and also elevates temperature
within the landfill which can in turn improve conversion into inorganic constituents. A
prolonged aerobic phase can lead to a drought condition within the fill and reduce
degradation rates.
Enhanced Stabilization: In order to reduce the time required for leachate treatment,
it is necessary to enhance leachate stabilization. Stabilization can be accomplished by two
ways namely, pre-treatment by size reduction, mixing and pre-composting or by using flow
systems to influence the environmental conditions within the landfill. Continuous flow

17
entails the re-circulation of leachate or abstraction of gas within the fill. Kylefors (1997)
reported that leachate re-circulation affects landfill stabilization by removing the waste
products after degradation from the liquid phase, allowing the addition and distribution of
microorganisms and nutrients with the landfill and maintaining homogeneous conditions
within the fill.
Separation of Leachate: Different waste categories at municipal solid landfills will
generate leachate with varying characteristics. Since, this contributes to the complexity in
leachate treatment, it may be beneficial to sort waste in terms of the leachate characteristics
in order to improve the efficiency of the treatment (Kylefors, 1997). This can be achieved
by separation of leachate based on waste characteristics and by separation of leachate
based on degradation phases. Further, the composition of the waste landfilled can also be
altered by the addition of nutrients, seed and buffers to improve the microbial processes
within the fill. Generally, a combination of digested sewage sludge and alkaline ash is
added to enhance methanogenesis.
Bottom Liners and Top Covers: The bottom liners are selected to prevent seepage
of leachate into the groundwater sources, whilst top covers aid in maintaining moisture
within the fill as well as limiting infiltration, thus slowing down the degradation process.
2.8 Leachate Treatment
Most solid waste disposal sites do not have the proper leachate treatment system.
Though varied treatment processes are used for leachate treatment, most of them are not
properly designed to cope with quantity and characteristics of the generated leachate.
Therefore, the objective for leachate management in solid waste disposal should be to
develop leachate treatment system having low area requirement and which is also cost
effective, to identify significant factors which have to be considered in leachate treatment
system and finally to set up a suitable criteria and prepare guidelines for proper leachate
treatment in municipal solid waste disposal dump sites so as to reduce contamination and
environmental impacts.
Leachate treatment is dependent on the quality and quantity of the leachate input,
discharge limits or removal efficiency requirements, quantity of residual products and their
management, site location and economics. However, high ammonia concentrations and the
typical phosphorus deficiency in landfill leachate hamper the biological treatment
efficiencies. Therefore, a general consensus among researchers is high nitrogen levels
which are still hazardous to receiving waters and needs to be removed prior to discharge.
This is generally carried out through biological nitrification-denitrification processes for
young leachate and through physico-chemical processes for stabilised landfill leachate.
The success of treatment process depends on the characteristics of the leachate and age of
the landfill.
Several wastewater treatment processes have been generally used to treat landfill
leachate (Amokrane, et al., 1997). The major biological treatment processes comprises of
activated sludge (AS), sequencing batch reactor (SBR), rotating biological contactor
(RBC), etc and physical and chemical treatment processes comprises of oxidation,
coagulation-flocculation, chemical precipitation, activated carbon absorption and
membrane processes.

18
2.8.1 Biological Treatment Processes
The majority of leachate treatment schemes that have been successfully installed on
landfill sites have been anaerobic biological treatment process through aerobic treatments
have also been in use. The drawbacks generally experienced in biological leachate
treatment originate from operational problems such as: foaming, metal toxicity, nutrient
deficiency and sludge settling (Qasim and Chiang, 1994). Among the various biological
treatment processes, Sequencing Batch Reactors (SBR) have been proved as a reliable and
robust method for leachate treatment to meet specified effluent consent values.
Conventional aerobic systems consist of either attached or suspended growth systems.
The advantages and disadvantages of each system is case specific. Aerobic systems range
from aerated lagoons, activated sludge and sequence batch reactors (SBR) while attached
growth processes include trickling filters and rotating biological contactors. Trickling
filters are generally not used for leachate treatment when the leachate contains high
concentrations of organic matter (or precipitate-forming inorganic compounds), because of
the large sludge production which result in clogging of the filters.
Activated Sludge Process
The activated sludge process is efficient in leachate treatment. Although there is
variability in the leachate quality depending on the source and over a period of time from a
single source, biokinetic studies conducted by various researchers indicated a consistency
in results as cited in Qasim and Chiang (1994) as presented in Table 2.8. A comparison of
biokinetic coefficients from various sources show remarkable consistency considering the
highly variation. It was found that at any BOD concentration of landfill leachate, the yield
coefficient (Y) is in the same range as domestic wastewater. This might be due to change
in the predominant species or change in the carbon assimilation metabolism as substrate
change. The biokinetic coefficients are used in the biological growth and substrate
utilization rate equations, and are accepted for developing the reactor design.
In order to achieve good treatment efficiencies in activated sludge processes, the
loading rate should not exceed 0.05 kg BOD
5
/kgTS.d. In an activated sludge processes
used for treating landfill leachate, general operation conditions are as follows:
Operational conditions:
MLVSS : 5,000 to 10,000 mg/L
Food/Micro-organism
: 0.02 to 0.06 per day
Hydraulic Retention Time
: 1 to 10 days
Solids Retention Time
: 15 to 60 days
Nutrient requirements
: BOD
5
: N: P = 100: 3.2: 0.5
The process could obtain 90% to 99% BOD and COD removal and 80% to 99%
metal removal.

19
Table 2.8 Summary of Biokinetic Coefficient of Activated Sludge Process for Landfill
Leachate Treatment
S
o
(BOD
5
)
(mg/L)
k
(d
-1
)
K
s
(mg/L)
Y
(mg/mg
)
k
d
(d
-1
)
θ
c
(d)
T
(
°C)
Reference
36,000
0.75
200.0
0.33
0.0002
5
6.5
23 to 25
Uloth and
Mavinic, 1977
15,800*
0.6
175.0
0.40
0.050
-
22 to 24
Cook and
Foree, 1974
0.77
20.4
0.39
0.022
3.6
23 to 25
0.71
29.5
0.63
0.075
-
16
Zapf –Gilje and
Mavinic, 1981
0.46
14.6
0.50
0.028
-
9
13,640
0.29
11.8
0.43
0.008
7.5
5
Graham and
Mavinic, 1979
1.16
81.8
0.49
0.009
1.8
22 to 23
1.12
63.8
0.51
0.018
1.8
15
0.51
34.6
0.51
0.006
4.0
10
8,090
0.34
34.0
0.55
0.002
5.4
5
Wong and
Mavinic, 1984
1,000
4.50
99.0
0.59
0.040
0.42
22 to 23
Lee, 1979
365
1.80
182.0
0.59
0.115
-
21 to 25
Palit and
Qasim, 1977
3,000
-
-
0.44
-
1 to 20
10
Robinson and
Marais, 1983
2,000
0.46
180.0
0.50
0.100
2 to 10
25
Gaudy, et al.,
1986
Domestic
Wastewater
2-10 25-100
0.4-0.8
0.025-
0.075
-
-
Tchobanoglous,
et al., 2003
S
o
= BOD
5
(* COD)
k = substrate removal rate
K
s
= half-velocity constant
Y = yield coefficient
k
d
= endogenous decay coefficient
Θ
c
= solid retention time
T = temperature
Keenan,
et al. (1984) investigated the combined physico-chemical process with
activated sludge process. It was observed that the reduction in ammonia by stripping and
neutralization with H
2
SO
4
and H
3
PO
4
after that entered to activated sludge process. The
organic matter in terms of BOD was reduced 99% and the corresponding COD removal
was 95%. The effluent BOD to COD ratio was 0.16. The reduction in ammonia was 90%
and heavy metals removal ranged from 27% to 75%.
Dzombak,
et al. (1990) had studied the treatment of leachate in an extended aeration
system. The BOD/COD ratio of the leachate was below 0.1 which is a characteristic of old
landfill leachate containing mainly refractory organic compounds. Different mean-cell
residence times from 15 to 60 days were investigated. It was observed that maximum
COD removal of 40% could be achieved with mean-cell residence time of 60 days. This
suggested that leachate from young landfills with organic matter containing high volatile
acids can be more easily treated with an activated sludge process than old landfill leachate.
Doyle, et al. (2001) performed the sludge characterization studies in the nitrification
process used for ammonia removal in an “old” landfill leachate. Whilst most researchers
(Knox, 1985; Robinson and Maris, 1983; Strachan, et al., 2000) reported poor settleability

20
of sludge (possibly due to high ammonia and low BOD: N ratio) in the activated sludge
treatment of leachate, Doyle, et al. (2001) reported good sludge settling with SVI ranging
between 20 to 30 mL/g. A well-settled sludge generally exhibits an SVI of 80 to 150 mL/g.
This was probably due the presence of a high nitrifying fraction in the sludge. Further, the
ability of sludge to settle well indicates the enhanced removal efficiencies and hence,
improved effluent quality.
Sequencing Batch Reactors (SBR)
Sequencing batch reactors (SBR) are commonly used as a biological treatment for
leachate treatment. Several studies have been conducted to find out the applicability of
SBR in leachate treatment. Doyle, et al. (2001) conducted a study of high-rate nitrification
in SBR on a mature leachate obtained from a domestic landfill. The leachate possessed
high ammonia content with an average concentration 880 mg/L, while the average BOD
5
and COD concentrations were 60 and 1,100 mg/L, respectively. The ammonium oxidation
rates upto 246 mg N/L.h and specific ammonium oxidation rates of 36 mg N/mg VSS.h
were achieved in this study. A complete ammonia oxidation of the leachate could be
achieved with a HRT of 5 h.
Hosomi, et al. (1989) also evaluated SBR for the treatment of leachate containing
high nitrogen and refractory organic compounds. The advantages of the SBR compared to
nitrification-denitrification processes that they are less likely to get damaged due to scale
formation; easy for maintenance; sludge bulking is unlikely; by varying the aerobic and
anoxic cycles, a wide range of pollutant loads can be effectively treated, and certain non-
biodegradable halogenated organic compounds can also be degraded.
Yalmaz and Ozturk (2001) conducted an investigation on the use of SBR technology
for the treatment of high ammonia landfill leachate via nitrification-denitrification and
anaerobic pre-treatment. The study was done in two folds: to evaluate SBR technology for
the treatment of high ammonia leachate and to investigate the feasibility of using landfill
leachate as a carbon source for denitrification. The SBR was further tested for the
treatment of anaerobically pre-treated leachate from an up-flow anaerobic sludge blanket
reactor (UASB). The SBR achieved a 90 % nitrogen removal when anaerobically pre-
treated leachate was treated while using Ca (CH
3
COO)
2
as a carbon source. The study
revealed that young landfill leachate with a COD/NH
4
-N greater than 10 was also effective
as a carbon source for denitrification. Although a 2-stage combination biological treatment
in the form of UASB and SBR were used in the treatment scheme, the effluent emitted did
not meet discharge standards and required additional post-treatment in the form of
physical-chemical processes such as reverse osmosis or ozonation. This justifies findings
by previous researchers who suggest the most effective means of treating landfill leachate
is a combination of physical-chemical and biological treatment.
Rotating Biological Contactor (RBC)
The biological contactor oxidation process is adopted to treat the organic pollutant in
the leachate. Even with a low concentration or remarkable load fluctuation of organic
pollutant, the stable and effective treatment efficiency could be achieved. During an
investigation conducted by Siegrist, et al. (1998) to study the nitrogen loss in a nitrifying
rotating contactor to treat ammonium rich leachate without organic carbon, it was found

21
that extensive loss of nitrogen (up to 70%) could be secured. DOC less than 20 mg/L
suggested that the heterotrophic denitrification could be excluded.
The nitrification rate reached 3-4 g NH
4
-N/m
2
.d at a pH of 7 to 7.3 in the first two of
three RBC compartments. It was said that an increasing partial pressure of oxygen and
increasing ammonium concentration had favoured nitrogen removal over ammonium
oxidation. The reduction of nitrite in the aerobic biofilm layer close to the surface might
have been therefore coupled with ammonium oxidation, and probably took place in the
deeper or temporarily anoxic layer of the biofilm. Henderson, et al. (1997) also found that
RBC could be effective in treating the methanogenic landfill leachate.
Anaerobic Treatment
The most common anaerobic treatment is the methanogenic degradation where the
organic matter is completely degraded to mainly methane and carbon dioxide. Anaerobic
degradation as suggested by Kylefors (1997) follows a sequence where the interaction of
several different microorganisms performing hydrolysis, fermentation, acetogenesis and
methanogenesis is required. Anaerobic processes are generally carried out in attached film
reactors. These reactors are insensitive to variations in loading, can retain biological solids
irrespective of the waste flow and maintain a sufficiently high solids concentration over an
extended period. It has been reported that removal efficiencies in anaerobic filters are
higher than anaerobic digesters maintained at the same hydraulic retention time (Pohland
and Kim, 1999).
The main advantages of anaerobic treatment over aerobic treatment are:
1. The energy requirement is lower since no oxygen is required, thus reducing the
operational cost.
2. Since only 10 to 15 % of organic matter is transformed into biomass:
• Low sludge production making the sludge disposal unproblematic.
• Low nutrient supplement requirement, which is beneficial for leachate
treatment which is nutrient deficient.
• Biogas production (85-90 %) favouring the energy balance.
• Possibility to treat leachate with high organic material concentration without
dilution as required by the aerobic process, thus reducing the space
requirements, the size of the plant and capital cost.
3. Anaerobic microorganisms seldom enter endogenous phase, which is important for
the treatment of leachate with variable volume and strength.
4. Anaerobic sludge is highly mineralized than aerobic sludge, which increases its value
as a fertilizer if toxic metals are removed.
5. Anaerobic sludge tends to settle more easily than aerobic sludge, where addition of
flocculants is required.
The main drawbacks of anaerobic systems are:
1. Working temperature above 30
°C is required for efficient kinetics.
2. Complexity of start-up period and the need for strict control of operating conditions.
3. The apparently lower performance of anaerobic methods in elimination of heavy
metals when compared with aerobic treatment.

22
4. Need for complementary treatment in order to achieve high purification rates and
acceptable effluent quality.
Cameron and Koch (1980) experimented anaerobic digestion at temperature from 29
to 38
o
C. The initial acclimation of this system were supplemented by adding lime to
correct pH and phosphorus to maintain BOD:N:P proportion. This process could reduce
BOD of 65% to 80% and heavy metals of 40% to 85%.
Mendez, et al. (1989) conducted a leachate treatment from young landfill by using
anaerobic digestion. The COD removal efficiency was 65% with a HRT of 8 days.
Furthermore, this study revealed that the COD removal efficiency of leachate from young
landfill is higher than the leachate from the old landfill, due to the lower percent of
refractory organic compounds.
Upflow Anaerobic Sludge Blanket Reactor (UASB)
As often pointed out, leachate varies widely in quantity and in composition, from one
place to another (Kennedy, et al., 1988). Such variability along with other factors make the
applicability of a method to treat leachate highly dependent on the characteristics of the
leachate and the tolerance of the method against changes in leachate quality (Henry, 1982).
The UASB reactor has achieved widespread acceptance as a high-rate partial
treatment process for high organic strength wastewaters throughout the world. This helps
us to accept UASB as a leachate treatment process. Blakey, et al. (1992) have studied the
influence of temperature, supply of nutrient and microorganism composition in the reactor
treatment efficiency. As a pre-treatment system, high rate anaerobic processes (as UASB)
have been shown to be efficient in the treatment of municipal landfill leachate having a
COD higher than 800 mg/L and the BOD/COD ratio higher than 0.3 (Kettunen, 1996).
Especially, UASB reactors have exhibited superior performance compared to the other
processes at high volumetric loading rates and with toxic and organic shock loads.
Blakey, et al. (1992) performed the UASB with the young leachate containing
BOD/COD ratio of 0.67. The unit was operated at an average loading rate of 11 kg
COD/m
3
.d with a HRT of 1.8 days. The average removal of COD, BOD, TOC and SS
were 82%, 85%, 84%, and 90%, respectively. The biogas yield of 496 ml/g COD removed
could be achieved. When Jans, et al. (1992) investigated UASB at loading rate of 25 kg
COD/m
3
.d an efficient COD removal could be achieved.
Nitrification and Denitrification Process
The two main difficulties faced by the researchers in biologically treating the
leachate are:
1. The leachate contains high nitrogen concentration with low COD: N ratio (Robinson
and Maris, 1985)
2. The high ammonia concentration causes toxicity and the difficulty which is enhanced
by phosphorous limitation (Keenan, et al., 1984).
As the high ammonium concentration affects the leachate treatment, nitrification and
denitrification processes play a significant role in leachate treatment. The ammonia toxicity
occurs at a concentration of 31 to 49 mg/L (Cheung, et al., 1997). Complete removal of
23
ammonia could only be achieved when the N: BOD
5
ratio does not exceed 3.6:100. Further,
when ammonia concentrations exceed 200 mg/L (as N), in the mixed liquor, the sludge
settling is also adversely affected (Robinson and Maris, 1985). Hence, removal of nitrogen
and nitrogen compounds from the leachate by a pre-treatment prior to biological treatment
processes is of prime importance.
Biological nitrification-denitrification is one of the most economical processes for
nitrogen removal. The successful application of this system is dependent on the microbial
population, composition, characteristic of the leachate and a variety of physical and
chemical parameters (Table 2.9). The process essentially consists of oxidation of ammonia
to nitrates with nitrite as an intermediate compound and finally nitrates to nitrogen gas.
Biological nitrification is preferred in absence of inhibitory substances which interfere with
the microbial ammonium oxidation process (Doyle, et al., 2001).
Table 2.9 Operational and Environmental Conditions for Nitrification-Denitrification
Processes (Kylefors, 1997)
Parameter
Unit
Nitrification
Denitrification
Substance
transformed
NH
4
+
NO
3
-
End Product
NO
3
-
N
2
Intermediate Product
NO
2
-
NO
2
-
, N
2
O
pH
7.5 to 8.6
6 to 8
Alkalinity mmol
of
HCO
3
-
/mg of N
Consuming 0.14
Producing 0.07
Oxygen mg
O
2
/L
> 2 (aerobic)
< 0.5 (anoxic)
Organic Material
mg COD/mg of N
-
3
Phosphorus content
mg of P/g of N
> 4
> 11
Production of Sludge
g/g of N
0.17
0.45
Temperature
A 10
°C increase gives about 2 times specific rate
Denitrification processes occur generally in anaerobic activated sludge, anaerobic
filter and anaerobic lagoon. Methanol is usually added as an organic carbon source prior to
denitrification; however, dosing should be monitored to prevent hydrogen sulphide
formation and its inhibition (Reeves, 1972). Endogenous respiration is not frequently used
as it results in weak kinetics and requires larger volumes.
In an extensive study conducted by Illies (1999) to treat high ammonia leachate with
a four stage nitrification-denitrification process which is biological nutrient removal, an
initial ammonia concentration of 200 mg/L was step-wise increased in an attempt to
improve process ability to handle high ammonia concentrations. The initial trial resulted in
severe nitrification inhibition due to insufficient acclimation after increment of 300 mg/L
ammonia at each stage upto a final ammonia concentration of 2,300 mg/L. Further,
methanol was added in the denitrification zone simultaneously with increase in ammonia
concentration. This led to excess of methanol leading to inhibition of denitrification. When
the system was operated at low HRT of 1.5-1.7 h for denitrification and 3-3.4 h for
nitrification with an SRT of 20 days, removal efficiencies were found to be greater than
90%.
Bae, et al. (1997) proposed a treatment scheme consisting of an anaerobic filter (pall
rings media) and 2-stage activated sludge process for the removal of ammonia and then

24
using Fenton’s treatment process which is chemical treatment using strong oxidizing agent
like H
2
O
2
, FeSO
4
and post-AS for COD reduction. The system was able to completely
nitrify the ammonia nitrogen with an initial concentration between 1,400 and 1,800 mg/L.
COD was reduced from 4,000-7,000 mg/L in the raw leachate to 150-200 mg/L in the
effluent. The nitrification process seemed to suggest nitrification via nitrite than nitrate
could be more advantageous due to high reaction rate, low organic requirements, low
sludge production and low oxygen requirements. The results were in accordance with the
hypothesis prescribed by other researchers (Turk and Mavinic, 1989; Abeling and Seyfried,
1992).
Welander, et al. (1998) investigated the suspended carrier biofilm process (SCBP) in
the biological removal of nitrogen and organic matter from landfill leachate. In the system,
COD removal of 20 % with maximum volumetric nitrification and denitrification rates of
24 g N/m
3
.h and 55 g N/m
3
.h, respectively could be achieved. Total nitrogen removal was
found to be 90 %. The study by Wetlander, et al. (1998) revealed that nitrification rates
could be improved by an attached growth on plastic carrier media. However, this does not
imply that nitrification would proportionally increase with an increase in carrier surface
area since effective mass transfer of oxygen to the biofilm and choice of media also
governs the process.
In a study done by Imai, et al. (1993), the feasibility of the simultaneous removal of
refractory organic compounds and nitrogen in an “old” landfill leachate was investigated
by microorganisms attached activated carbon fluidised bed process (MAACFB). The
study was conducted in anaerobic and aerobic fluidised beds arranged in series with a
recycling of effluent from the aerobic to the anaerobic reactors for the removal of nitrogen
by denitrification. The leachate source was obtained from a co-disposal site of municipal
and industrial waste typical of “old” leachate with a biodegradability of less than 0.1 and
total nitrogen content of 214 mg/L. The performance of the system indicated a 60 %
removal of refractory organic compounds and a 70 % removal of total nitrogen.
The review of biological processes highlighted the large space, energy and volume
requirements necessary for sequence batch reactors, however their advantage are immunity
to shock loading and minimal operator input. Whilst biological processes are able to
remove readily biodegradable organics, the non-biodegradable matter remains untreated.
Biological nitrification on the other hand, is generally difficult to achieve in landfill
leachate due to large amounts of inhibitory substances present in the leachate. Table 2.10
and Table 2.11 present a comparison of different studies with aerobic and anaerobic
treatments, respectively. The majority of physical processes are effective in ammonia
stripping but have minimal effect on removal of organics.
2.8.2 Physical Treatment
Physical processes include activated carbon adsorption, pressure-driven membrane
filtration processes, and evaporation. These processes generally cannot be applied
successfully to remove the organic material from raw leachate, therefore Pohland and
Harper (1985) suggested that reverse osmosis, activated carbon (PAC and GAC) and ion
exchange could be more successful when used as a post-treatment for landfill leachate after
biological treatment. However, although each process is coupled with biological system,
they have a limited application and therefore they can be even more effective when
physico-chemical treatment is used as pre and post treatment for biological systems.

25
Table 2.10 Treatment Efficiencies of Different Aerobic Biological Treatment Systems
Processes
HRT
(d)
Temperature
(
O
C)
COD
Loading
(kg/m
3
-d)
Initial COD
(mg/L)
pH
BOD/COD
Ratio
COD
Removal
(%)
Initial NH
4
-N
(mg/L)
NH
4
-H
Removal
(%)
Reference
1-5
23-25
0.5-1.7
3,000-9,000
6.0-8.0
0.5-0.8
30-90
-
-
Boyle and Ham, 1974
10
22
1.66
16,000
7.6-8.4
0.4
97
TN 280
92-95
Cook and Foree, 1974
Fill-and-draw batch
5
22
3.32
16,000
8.0
0.4
47
TN 280
58
Cook and Foree, 1974
1 20 0.1 100-150
- - 36-38
100-330 99
Hosomi,
et al., 1989
0.5
25
-
5,295
9.1
0.4-0.5
60-68
872
-
Dollerer and Wilderer,
1996
3.2
-
0.69
2,200
6.8-7.1
0.46
95
35
>99
Zaloum and Abbott,
1997
20
-
0.62
12,400
-
0.4
91
179
>99
Zaloum and Abbott,
1997
SBR
8.5
20-25
-
1,690
-
0.05
-
616
>99
Fisher and Fell, 1999
34
0-20
<1.0
5,600
-
0.7
97
130
93
Robinson and
Grantham, 1988
Aerated lagoon
- -
- 34,000
-
0.6 99 600 99
Robinson,
et al., 1992
20
10
1.2
24,000
6.0-7.5
0.5
98
790
>99
Robinson and Maris,
1985
20
10
0.06
1,200
-
0.2
41
370
90
Robinson and Maris,
1985
0.3
-
-
250-1,200
-
-
85-90
-
-
Schuk and James, 1986
Activated sludge
31 15-18
0.4
12,500 - 0.6 93-96
-
- Avezzu,
et al., 1992
RBC 2.9
-
2.8
9,300
-
0.7
86
-
-
Vicevic,
et al., 1992

26
Table 2.11 Treatment Efficiencies of Different Anaerobic Biological Treatment Systems
Processes
HRT
(d)
Temperature
(
O
C)
COD Loading
(kg/m
3
-d)
Initial COD
(mg/L)
pH
BOD/COD
Ratio
COD Removal
(%)
Reference
12.5
15
0.7
8,400
6.9-8.1
0.7
73
Boyle and Ham, 1974
5-20
23
0.4-2.2
2,700-12,000
6.9-8.1
0.6-0.8
87-96
Boyle and Ham, 1974
12.5
10
0.7
8,300
6.9-8.1
0.8
22
Boyle and Ham, 1974
Anaerobic digestion
5-20
29-38
0.2-1.3
20,000-30,000
5.0-5.3
0.5
65-80
Cameron and Koch, 1980
Anaerobic pond
86
20-25
-
6,280
6.6
0.7-0.8
95
Bull, et al., 1983
2-4 21-25 1.5-2.9 13,780
7.3-7.7
0.7 68-95
Henry,
et al., 1987
0.5-1.0 21-25 1.3-3.1
3,750 7.0-7.2 0.3
60-95
Henry,
et al., 1987
0.5-1.0 21-25 1.4-2.7
1,870 7.1-7.9 -
88-90
Henry, et al., 1987
Anaerobic filter
17 37 3.8 9,000 -
0.7 83
Wu,
et al., 1988
0.3-0.5 33-35 15-25 25,000-35,000
7.4-7.8 -
80-85
Jans,
et al., 1992
1.0-3.2 28-32 3.6-20 11,500-33,400 - 0.7
66-92
Blakey,
et al., 1992
0.6 15-20 5-15 2,800-13,000
- - 73-93
Garcia,
et al., 1996
UASB
0.5-1.0
-
1.2-19.7
4,800-9,840
-
0.86
77-91
Kennedy and Lentz, 2000
USB/AF
2.5-5.0
30
1.3-2.5
17,000-20,000
-
-
80-97
Nedwell and Reynolds, 1996
AnSBR
1.5-10.0
35
0.4-9.4
3,800-15,900
7.4-8.0
0.54-0.67
65-85
Timur and Ozturk, 1999
Note: USB/AF = Upflow hybrid sludge bed/fixed bed anaerobic system
AnSBR = Anaerobic sequencing batch reactors

27
Activated Carbon Adsorption
Granular activated carbon in combination with biological pretreatment is the leading
technology for the treatment of landfill leachate for the removal of chemical oxygen
demand (COD), adsorbable organic halogens (AOX) and other toxic substances. More than
130 different types of organics have been identified on spent carbon from leachate
treatment plants. Granular activated carbon is used to remove AOX and COD, both of
which are not primary focus of biological treatment systems and therefore, the effluent
quality may be found above discharge consent levels from such treatment systems. With
particularly dilute leachate, it may be operated with a plate separator or pressurized sand
filter removing suspended solids from the flow, in order to ensure that the carbon filter is
not blocked with solids. It is necessary to ensure that there are no substances in the
leachate which will damage the carbon prior to selecting such a system.
When Fettig (1996) studied the treatment of landfill leachate by preozonation and
adsorption in activated carbon columns, the data evaluation revealed that degradation took
place inside the activated carbon beds. Therefore, the total removal efficiency of ozonated
leachate in activated carbon columns was found to be higher than the removal efficiency
due to adsorption processes. A review of physical-chemical processes done by Qasim and
Chiang (1994) indicated that adsorption by activated carbon was more effective in organic
removal from raw leachate than chemical precipitation with COD removal efficiencies of
59 to 94 %. The humic substances remains unaffected by activated carbon treatment while,
1,000 MW fluvic substances could be easily removed by activated carbon.
Membrane Filtration
A membrane is defined as a material that forms a thin wall capable of selectively
resisting the transfer of different constituents of a fluid and thus affecting separation of the
constituents. The principle objective of membrane manufacture is to produce a material of
reasonable mechanical strength that can maintain a high throughput of a desired permeate
with a high degree of selectivity (Visvanathan, et al., 2000). The optimal physical structure
of the membrane material is based on a thin layer of material with a narrow range of pore
size and a high surface porosity. This concept is extended to include the separation of
dissolved solutes in liquid streams and the separation of gas mixtures for membrane
filtration.
The classification of membrane separation processes are based on particle and
molecular size. The processes such as reverse osmosis (RO), nanofiltration (NF),
ultrafiltration (UF) and microfiltration (MF) do not generally require the addition of
aggressive chemicals and can be operated at ambient temperature making these processes
both an environmentally and economically attractive alternative to the conventional
operating units. Table 2.12 summarizes the various membrane processes and its separation
potential. RO membranes can remove more than 99 % of organic macromolecules and
colloids from feed-water and up to 99 % of the inorganic ions.

28
Table 2.12 Membrane Processes (Rautenbach and Albrecht, 1989)
Membrane
Processes
Mixtures Separated
Driving Force
Preferably Permeating
Component
Reverse
Osmosis
Aqueous low
molecular mass
solutions, Aqueous
organic solutions
Pressure difference
(
≤ 100 bar)
Solvent
Ultrafiltration
Macromolecular
solutions,
emulsions
Pressure difference
(
≤ 10 bar)
Solvent
Microfiltration
(cross flow)
Suspensions,
emulsions
Pressure difference
(
≤ 5 bar)
Continuous phase
Gas Permeation Gas mixtures,
water-vapour gas
mixtures
Pressure difference
(
≤ 80 bar)
Preferably permeating
component
Pervaporation
Organic mixtures,
aqueous organic
mixtures
Permeate side: Ratio
of partial pressure to
saturation pressure
Preferably permeating
component
Due to high rejection ability, reverse osmosis membranes retain both organic and
inorganic contaminants dissolved in water with rejection rates of 98 to 99 % thus being
useful for purifying of liquid waste such as leachate. Permeate generated from the reverse
osmosis unit is low in inorganic and organic contaminants which meet the discharge
standards. Reverse osmosis technology was reported as the most effective in COD removal
among different physical-chemical processes evaluated. The removal efficiencies are
dependent on the choice of membrane material. Chian and DeWalle (1976) reported 50 to
70 % removal of TOC with cellulose acetate membranes while the use of polyethylamine
membranes increased efficiency to 88 %.
Reverse osmosis further offers the advantage of almost complete total solid removal
and is effective as either a pre-treatment or a polishing treatment for a biologically or ion
exchange treated effluent.
Membrane filtration is less effective in treating young or acidogenic leachate. The
efficiency of different membrane technology in treating methanogenic leachate is
presented in Table 2.13. Although nanofiltration and reverse osmosis are quite effective in
leachate treatment in terms of organic, inorganic, nitrogen and AOX removal, the
disadvantage of membrane treatment system is its susceptibility to fouling and short
lifetime.
Table 2.13 Removal Efficiency of Moderate to High Concentrations of Pollutants Using
Nanofiltration, Ultrafiltration and Reverse Osmosis (Kylefors, 1997)
Parameter
Reverse Osmosis
Removal (%)
Nanofiltration
Removal (%)
Ultrafiltration
Removal (%)
COD
95 to 99
80 to 90
25 to 60
NH
4
(N), pH = 6.5
90 to 98
80 to 90
< 20
AOX
95 to 99
70 to 90
30 to 60
Chloride
90 to 99
40 to 90
< 40
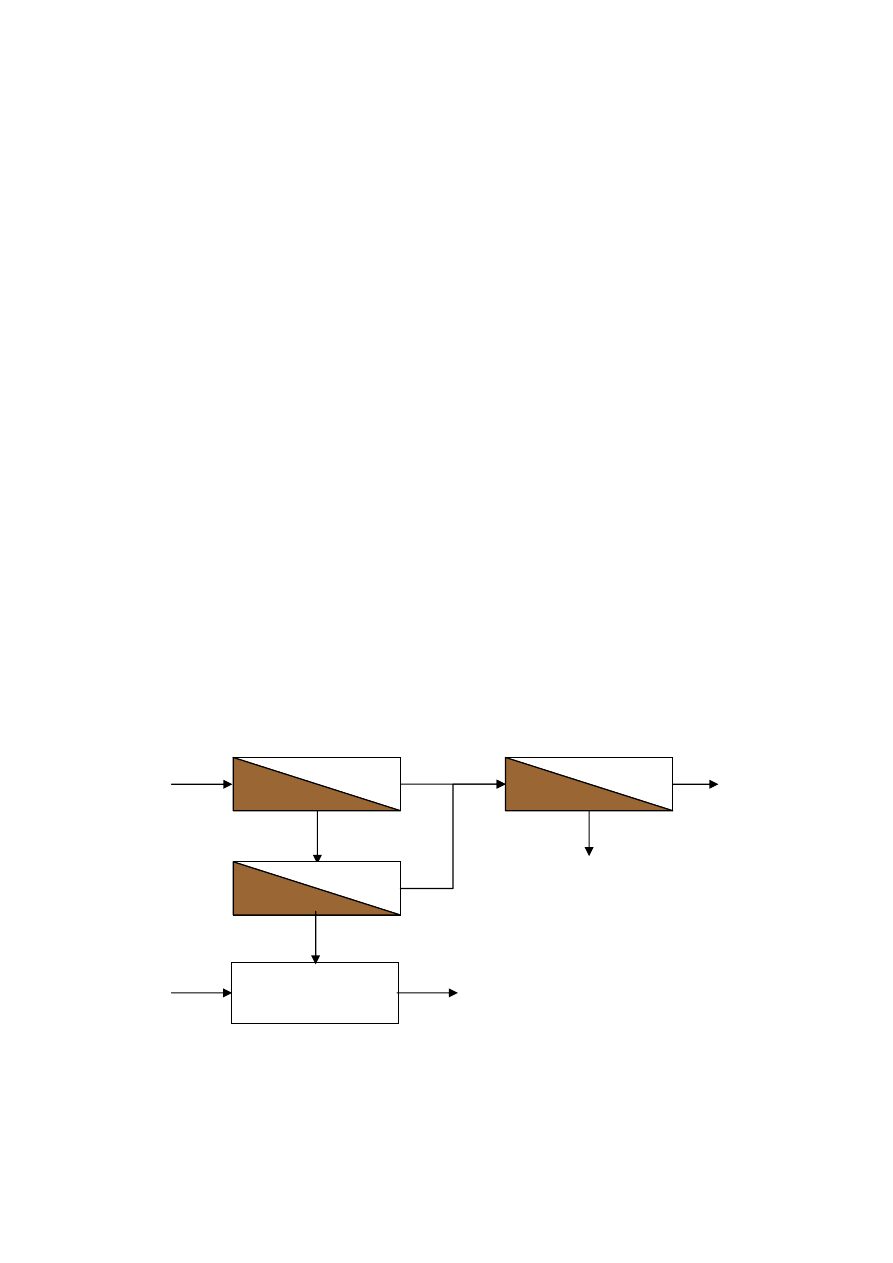
29
Colloidal material as well as metal precipitation can cause fouling and clogging in
the membranes. Fouling leads to an increase in osmotic pressure and hydraulic resistance,
thus increasing the energy consumption. In order to minimize the fouling effect, the pH
can be adjusted from 4 to 7.5.
Since membranes cannot retain volatile fatty acids, acidogenic leachate is poorly
treated using membrane systems. A coupling of a membrane and activated sludge process
to form a membrane bioreactor may be more viable as the membrane ensures total solids
retention. For moderate to strong methanogenic leachate, a good removal of several
substances, including metals can be achieved using bioreactors. Hence, a combination of
an activated sludge process with a membrane system, the membrane bioreactor technology
can achieve high treatment efficiency with an excellent effluent quality.
The application of reverse osmosis for large-scale application had been done in
Germany. The process train is as shown in Figure 2.6. The reverse osmosis system had a
capacity of 36m
3
/h and had been in operation for long with a change of a membrane after 8
years (Peters, 1997). Operational pressure was ranged from 36 to 60 bars depending on
feed characteristics. Membrane filtration took place at ambient temperature and at a
permeate flux of 15 L/m
2
.h. The performance of the plant is illustrated in Table 2.14.
When a reverse osmosis in Germany was operated at a capacity of 1.8m
3
/h, a salt
rejection of 98 % and COD removal of 99 % could be achieved. The membrane was
changed after 3 years of operation due to the flux reduction. The illustrations indicated that
reverse osmosis is effective in landfill leachate treatment provided that the leachate
characteristic is considered and the membrane module modified adapted to meet the design
criteria (Peters, 1997).
Figure 2.6 Treatment of Landfill Leacahte with Two Stage Reverse Osmosis
(Peters, 1997)
RO Permeate II
Reverse Osmosis I
Reverse Osmosis II
Leachate
Solidification
of Residue
RO Permeate I
Concentrate I
Binding
Reagents
Stabilized Materials
Concentrate
Concentrate II
(Recirculation to RO I)

30
Table 2.14 Typical Reverse Osmosis Plant Performance for Leachate Purification,
Germany (Peters, 1997).
Parameter
Unit
Leachate
RO
Permeate I
RO
Permeate II
Rejection
(%)
pH
-
7.7
6.8
6.6
Electrical Conductivity
µS/cm
17,250
382
20
99.9
COD
mg O
2
/L
1,797
< 15
< 15
> 99.2
Ammonium
mg/L
366
9.8
0.66
99.9
Chloride
mg/L
2,830
48.4
1.9
99.9
Sodium
mg/L
4,180
55.9
2.5
99.9
Heavy Metals
mg/L
0.25
< 0.005
< 0.005
> 98
Evaporation
As cited by Ehrig (1998), through evaporation, leachate can be separated into a clear
liquid and a solid phase bearing the pollutants. Practically, this is difficult as the solid
phase or the condensate laden with volatile or chlorinated organic compounds and
ammonia requires further treatment. Concentration and nitrogen recovery with the
evaporation technology is possible with evaporation technology. Physical-
chemical leachate treatment plants consist of many technical points and equipments which
have to be taken into account in the maintenance of the plant. Evaporation is a simpler
technology with easy application and less complicated technical difficulties. Evaporation is
also a cost-effective option.
But, the problems concerned with evaporation of raw leachate as cited by Cossu, et
al. (1992) are:
1. Formation of foam due to high organic content
2. Encrustation and corrosion, causing equipment damage
3. Fouling on the heat-transfer surface
4. Need for post-treatment for removal of ammonium and halogenated organic material
5. High energy costs.
2.8.3 Chemical Treatment
A wide scope of chemical treatment is available for leachate treatment. The
advantages of chemical treatment methods in general include immediate start-up, easy
automation, insensitivity to temperature changes and simplicity of plant and material
requirements. However, the advantages are outweighed by the disadvantages of large
quantities of sludge generated due to the addition of flocculants and chemicals with high
running costs. Thus, chemical and physical treatment is merely used as pre or post-
treatment of leachate to complement biological processes. The various chemical treatment
processes used in leachate treatment are coagulation, precipitation, oxidation, stripping, etc.
Coagulation and Precipitation
Coagulation/precipitation involves the addition of chemicals to alter the physical
state of dissolved and suspended solids and facilitate removal by sedimentation. This
treatment is effective on leachate with high molecular weight organic material such as
fulvic and humic acid. Since these components are generally difficult to degrade

31
biologically, physical-chemical processes prove beneficial with approximately 60 %
reduction in COD for methanogenic leachate.
Lime as a precipitating agent can reduce colour upto 85% and remove metals through
precipitation. Chian and DeWalle (1977) and Ho, et al. (1974) reported that precipitation
using lime could remove organic matter with molecular weight greater than 50,000 Da.
This particular fraction is present in a low concentration in young landfills and absent in
older landfills. Therefore, lime treatment is most effective in medium-age landfills. Whilst
easily biodegradable fatty acids are however impervious to coagulation/precipitation and
hence should be treated biologically.
The concurrent COD and phosphorus removal via lime precipitation is independent
of air flow rate. The change in colour of the raw leachate from dark brown to pale yellow
after precipitation indicated the removal of the organic fractions that contributed to the
colour (humic substances). Chian and DeWalle (1976) mentioned that the minimal
reduction in COD (20 %) could be attributed to lime precipitation, as the molecular weight
greater than 50,000 Da contributing to some amount of COD fraction was removed.
However, an increase in lime dosage did not prompt a concomitant increase in COD
precipitation. Phosphorus was removed by calcium hydroxide precipitation.
Chemical Oxidation
Chemical oxidation technologies are useful in the oxidative degradation or
transformation of a wide range of pollutants present in drinking water, groundwater and
wastewater treatment (Venkatadri and Peters, 1993). Generally, chemical oxidation
processes are incorporated into treatment sequences to treat constituents of wastewaters
that are resistant to biodegradation or create toxicity in biological reactors. Chemical
oxidation process is widely used in leachate treatment. A variety of chemical oxidants are
used for leachate treatment. The various oxidants used for leachate treatment are hydrogen
peroxide, ozone, chlorine, chlorine dioxide, hypochlorite, UV-radiation and wet oxidation.
Based on the oxidative potentials, hydroxyl radicals exhibit a stronger oxidation behavior
than ozone. Since, oxidation processes are energy intensive and expensive, their
application is limited. Further, as oxidation processes are dependent on the stoichiometry, a
large amount of oxygen is required for higher organic concentrations (Webber and Smith,
1986). Chlorine, chlorine dioxide, hypochlorite compounds are not used for oxidation due
to their toxicity.
(a) Hydrogen Peroxide
Without an oxygen supplement, the oxidizing potential of hydrogen peroxide is
insufficient to reduce the content of organic compounds, especially humic substances and
facilitate degradation. However, hydrogen peroxide in the presence of a suitable catalyst,
usually iron salts or UV-radiation (Steensen, 1997), can form hydroxyl radicals, which
have a greater oxidation potential than hydrogen peroxide or ozone individually.
According to Steensen (1993), the economic feasibility of adopting hydrogen peroxide as a
chemical oxidation option is poor as 120 to 250 kWh/kg COD removed is required.

32
(b) UV-Radiation
UV-radiation is generally coupled with hydrogen peroxide or ozone to form an
oxidation complex. UV oxidize only certain organic compounds present in leachate and is
a good disinfectant. When decomposition of dioxins in a landfill by advanced oxidation
processes were studied, O
3
/H
2
O
2
and UV/O
3
/H
2
O
2
processes were tested to evaluate their
performances in decomposing dioxins present in a landfill leachate. The data suggested
that the UV/O
3
/H
2
O
2
process had better removal efficiency of total dioxins than O
3
/H
2
O
2
process in terms of toxicity (Sota, et al., 1999).
(c) Ozonation
The chemical oxidation with ozone is an innovative technology for the treatment of
effluents and leachate that are highly contaminated with organic chemicals because of its
capability to completely convert the organic contaminants to carbon dioxide.
Ozone due to its strong oxidizing ability is effective and practical as a pre-treatment
to remove refractory species and as a polishing step to treat organic or increase the
biodegradability of refractory compounds. The oxidation potential of ozone is sufficient for
the direct degradation of organic substances. The oxidation of organic compounds by
ozone is a zero order reaction, i.e. the reaction rate is constant until about 20 % of the
initial amount is left (Kylefors, 1997).
Bjorkman and Mavinic (1977) conducted an extensive study of physio-chemical
treatment of landfill leachate. The study included the use of lime, alum, ozone and their
various combinations for the treatment of municipal solid waste. In the study, after treating
the leachate with ozone, the leachate was re-circulated in an attempt to improve effluent
degradation. It was found that counter-current re-circulation minimized the foaming
problem experienced in the treatment process. However, it was concluded with ozone
concentrations above 100 mg/L was effective in marginally reducing COD present in the
leachate.
Gierlich and Kollbach (1998) reported that ozone was effective in reducing 80 %
ammonia. It was also suggested that ozone treatment was more effective and economical if
biological treatment was adopted as a pretreatment.
Sludge disintegration has been commonly used as a pretreatment for sludge digestion.
The digested sludge has the advantage of controlling and reducing sludge bulking in
conventional activated sludge processes and thus providing an internal carbon source for
biological nutrient removal. However, the feasibility of using ozone to chemically
oxygenate sludge to provide an internal carbon source for denitrification processes had not
yet been investigated. This was the research basis for a study conducted by Ahn, et al.
(2001). In the study, the ozonated sludge resulted in a sludge mass reduction and
improvement in the settleability of the sludge. The effect of sludge ozonation was
determined in terms of either mineralization or solubilization and changes in residual solid
characteristics. Both the solubilization and mineralization increases with increase in ozone
dosage.

33
Ammonia Stripping
Air stripping of ammonia involves passage of large quantities of air over the exposed
surface of the leachate, thus causing the partial pressure of the ammonia gas within the
water to drive the ammonia from the liquid to the gas phase. Ammonia stripping can also
be undertaken by water falling through a flow of air as in stripping towers or by diffusion
of air through water in the form of bubbles. Stripping towers are more efficient since there
is better contact between the gas and liquid phases when dispersion of liquid takes place in
the form of fine droplets. Since, ammonia stripping is mass transfer controlled, the surface
area of the liquid exposed must be maximised. This can be achieved by creating fine
droplets with the help of diffusers or sprayers. The process is further subject to careful pH
control and involves the mass transfer of volatile contaminants from water to air.
The formation of free ammonia is favoured when the pH is above 7. At pH greater
than 10, over 85 % of ammonia present may be liberated as gas through agitation in the
presence of air (Reeves, 1972). Ammonium hydroxide (NH
4
OH) is formed as an
intermediate at pH between 10 and 11 in the reaction. The bubbling of air through
ammonium hydroxide solutions results in the freeing of ammonia gas. This process is
subject to temperature and solubility interferences. Since ammonia is highly soluble in
water, solubility increases at low ambient temperatures.
To review the effectiveness of ammonia stripping as a pre-treatment option for
landfill leachate, Cheung, et al. (1997) investigated air flow rate and pH as critical
parameters for the optimisation of ammonia stripping in a stirred tank. In the study, to
evaluate the effective pH, air flow rate of 0, 1, 5 mL/min and lime dosage of 0-10,000
mg/L was varied. The study revealed an enhanced ammonia removal (86-93 %) could be
achieved at air flow rate of 5 mL/min and pH greater than 11. It was realized that
effectiveness of the process was also dependent on area (A): volume (V) ratio of the tank
and leachate quality. The efficiencies in previous studies by other researchers were 40 to
53 % for A: V = 23 m
-1
and 19 % for A: V = 1.8 m
-1
(Cheung, et al., 1997). This indicated
that the mass transfer governed the mechanism for ammonia stripping and it was further
revealed that ammonia desorption into the air bubbles was less significant than the air-
water interfacial area. The provision of air to the system promotes air bubble formation and
turbulence at the air-water interface, which aids in increasing the surface area for ammonia
removal. Thus, an indefinite increase in air flow rate could greatly enhance ammonia
stripping efficiency over a short detention time. The practicality of this approach depends
on the power mixer efficiency and mass transfer rate, which should be optimised to render
the process cost-effective. Further, ammonia stripping has the advantage of precipitating
organics and heavy metals present in the leachate.
There has been a plenty number of investigations performed on the physico-chemical
treatments to investigate their potential in treating leachate. A comparison of different
studies with physico-chemical treatments is presented in Table 2.15.
2.8.4 Natural Leachate Treatment Systems
Natural leachate treatment is distinguished from conventional systems based on the
source of energy that predominates in both the systems. In conventional systems, forced
aeration, mechanical mixing and chemical addition are input for the pollutant degradation.
Natural systems however, utilize renewable energy sources such as solar radiation or wind.

34
Table 2.15 Treatment Efficiencies of Different Physico-chemical Treatment Systems
Processes
Detention
Time
Initial COD
(mg/L)
Initial NH
3
(mg/L)
COD
Removal
(%)
NH
3
Removal
(%)
Reference
Chemical precipitation
- Alum
-
800-1,500
137-330
35
-
Diamadopoulos, 1994
- FeCl
3
-
800-1,500
137-330
56
-
Diamadopoulos,
1994
- Lime
-
14,900
-
13
-
Cook and Foree, 1974
-
550
-
10-25
-
Graham, 1981
-
Magnesium ammonium
phosphate
7 d
13,600
2,170-2,360
80
90
Kabdasli, et al., 2000
Chemical oxidation
- Electrochemical
4 h
4,100-5,000 2,600
92
100 Chiang,
et al., 1995
1,200
380
Cossu, et al., 1998
- H
2
O
2
+ Fe(II)
-
1,150
-
70
-
Kim, et al., 1997
30 min
1,940
151
70
81
Lin and Chang, 2000
Air stripping
24 h
800-1,500
137-330
-
95
Diamadopoulos, 1994
24 h
448-557
556-705
30-48
86-93
Cheung, et al., 1997
17 h
-
1,210-1,940
25
85
Ozturk, et al., 1999
24 h
-
2,170-2,360
26
85
Kabdasli, et al., 2000
24 h
240
150
-
89
Marttinen, et al., 2002
Carbon adsorption
- Powder activated carbon
-
800-1,500
137-330
70
-
Diamadopoulos, 1994
-
742
-
43
-
Albers and
Kruckeberg, 1992
- MAACFB
-
81-157 *
214
60
70
Imai, et al., 1993
- BACFB
1-4 d
81-157 *
-
42-58
-
Imai, et al., 1995
Reverse Osmosis
- 1,300 - >99 -
Jans,
et al., 1992
-
1,000-1,500
<10
>99
-
Weber and Holz, 1992
-
1,800
366
>99
>99
Peters, 1997
-
1,300
1.9
>99
-
Baumgarten and
Seyfried, 1996
Note: * Dissolved organic carbon (DOC)
MAACFB = Microorganism-attached activated carbon fluidized bed process
BACFB = Biological activated carbon fluidized bed process

35
These systems are land intensive whilst conventional systems are energy intensive. Typical
natural systems used for landfill leachate treatment include wetlands, leachate re-
circulation and aquatic systems.
Leachate Re-circulation
Moisture addition by means of rain infiltration and leachate recirculation is critical to
the stabilization of landfill waste, enhancement of gas production, improvement of leachate
quality, reducing long-term environmental consequences and liability of waste storage and
improving economic viability of waste storage. The landfill effectively acts as an
uncontrolled anaerobic filter and promotes methanogenic conditions for the enhancement
of organic degradation (Knox, 1985; Strachan, et al., 2000).
The in situ treatment of leachate by recycling the leachate to the landfill reduces the
time required for biological stabilization of the readily biodegradable leachate constituents
and increases the rate of biostablization of the leachate. Re-circulated leachate reduces the
stabilization time from 15 to 20 years to 2 to 3 years (Pohland and Harper, 1985). It can be
suggested that by managing the moisture content within the landfill, the rate and
characteristics of the leachate generated can be controlled by diluting the inhibitory and
refractory compounds. Further, seed, nutrients and buffers can be added to supplement the
biological activity within the landfill and thus, create an engineered bioreactor in the
landfill. Whilst this is effective in removing the organic constituents in the leachate, the
landfill bioreactor has been demonstrated as being ineffective in treating elevated ammonia
concentrations.
Pohland (1972, 1975), Leckie, et al. (1975, 1979) and Pohland, et al. (1990),
performed leachate recirculation studies. The results indicated a rapid decline in COD due
to the active development of anaerobic methane forming bacteria in the fill, which was
enhanced by recirculation of leachate and seeding with municipal sewage sludge. The
COD reduction showed a similar trend as reduction in BOD, TOC, VFA, phosphate,
ammonia-nitrogen and TDS.
Reed Beds
A reed bed system (Root zone treatment) can be designed to treat leachate. The
wastewater to be treated in root zone treatment passes through the rhizomes of the common
reed in a shallow contained bed of permeable medium. The rhizomes introduce oxygen
into the bed and as effluent percolates through it; microbial communities become
established at the roots and degrade contaminants. Nutrients such as nitrogen and
phosphorus may also be removed directly as the reeds utilise them for growth. Reed beds
cannot be used as a primary treatment for leachate since they are poor at removing
ammonia even from a sewage having a low concentration of 30 mg/L. Further, the
accumulation of heavy metals within the bed may affect rhizome growth and bed
permeability. Reed beds are therefore generally used as a polishing step for leachate
treatment (Robinson, et al., 1992).
2.8.5 Co-Treatment with Municipal Wastewater
Current leachate treatment practice includes discharge of leachate into municipal
wastewater (MWW) drains followed by the treatment of both domestic wastewater and

36
leachate in municipal wastewater treatment plants. A combined treatment may provide a
better effluent quality as a result of the maintenance of a more heterogeneous population,
increased availability of nutrient and possible dilution of potential inhibitors. Another
advantage of co-treatment of leachate with domestic sewage is that leachate contains
excess of nitrogen while sewage contains excess of phosphorus which eliminates the need
for addition of nutrients. However, the main disadvantage is the high concentrations of
organic and inorganic components contributed by both young and old leachate.
To review the of co-treatment of leachate in MWW plants, Qasim and Chiang (1994)
summarized research conducted by various researchers (Chian and DeWalle, 1977; Henry,
1985; Raina and Mavinic, 1985). From the review, it was evident that a disagreement arose
as to whether this option was viable and under what conditions. Whilst Raina and Mavinic
(1985) successfully treated leachate-MWW combinations of 20 to 40 %, Henry (1985),
Chian and DeWalle (1977) and others reported poor performance in the co-treatment for
leachate to MWW a ratio of less as 10 %. Since, there are contradicting results from
various researchers, it is unknown whether this treatment option is suitable under practical
application. Although BOD
5
, COD and heavy metal reduction is well established, the
relative proportions of leachate effectively treated is effected by ammonia conversions,
temperature, sludge production, foaming, poor solids settleability, heavy metal
accumulation and precipitate formation.
2.9 Combined Treatment Facility
A single treatment technology is not efficient in the leachate treatment due to the
complexity involved in treating leachate having a varied composition and characteristic.
Leachate treatment entails the integration of several treatment processes. The coupling of
units for the development of treatment sequences should be modular to allow maximum
flexibility in order to vary the order of arrangement and for addition/removal of unit
operations. This effectively creates different treatment lines and thus better adapted to the
changing qualitative conditions of the leachate (Qasim and Chiang, 1994; Bressi and
Favali, 1997).
Physical-chemical treatment processes for leachate from young landfills are not as
effective as biological processes, whereas they are extremely efficient for stabilized
leachate. COD/TOC and BOD/COD ratios, absolute COD concentration and age of the
landfill are necessary determinants in the leachate characteristics for selection of
appropriate treatment system. In treating leachate, the treatment sequence should be able to
meet either the standards for discharge in receiving water bodies or an acceptable limit for
discharge into water treatment works. To review the treatment sequences prior to
development of optimum treatment sequence, few treatment combinations have been
reviewed.
2.9.1 Biological Treatment and Reverse Osmosis
A treatment sequence that is capable of removing mineralized material should
include anaerobic digestion, suspended growth biological waste treatment, partial softening,
filtration and reverse osmosis (RO). The anaerobic digester stabilizes the waste while the
aeration system degrades the biological matter. The effluent could be polished in a gravity
filter and demineralised in a RO unit, thus achieving an effluent devoid of dissolved salts
and low in organics. The process train is as shown in Figure 2.7(a). With increase in age,

37
the biological treatment can be replaced by coagulation precipitation process followed by
re-carbonation, filtration and RO in leachate treatment. The upgraded facility could be as
shown in Figure 2.7(b).
(a)
(b)
Figure 2.7 Schematic Diagram of Biological Treatment and Reverse Osmosis for
Leachate Treatment (Qasim and Chiang, 1994)
2.9.2 Microfiltration and Reverse Osmosis
Incorporation of a multiple membrane system by the combination of microfiltration
(MF) and reverse osmosis (RO) could be the basis of the treatment sequence developed for
leachate treatment. The process could be suitable for leachate of all ages and for low to
medium flow processes. The two-stage processes entails precipitation and microfiltration
for the removal of toxic metals and suspended solids and reverse osmosis for concentration
of residual organics
as shown in Figure 2.8. The first step of precipitation and
microfiltration provides a simple pre-treatment for the RO unit and thus producing a high
quality effluent free of solids and dissolved organics. However, similar to other membrane
processes, the system is susceptible to fouling; hence, development of antifouling
strategies and reduction in biofouling needs to be evaluated.
Influent
Anaerobi
c
Clarifier
Granular
Filter Media
RO Concentrate
Gas
M
To Drying Bed
Recarbonation
Chemical Treatment
Influent
A
Anaerobic
Digestion
Return Sludge
Sludge to Digestion
Clarifie
Aerobic Treatment
Granular
Filter Media
RO Permeate
RO Concentrate
Gas
RO Permeate
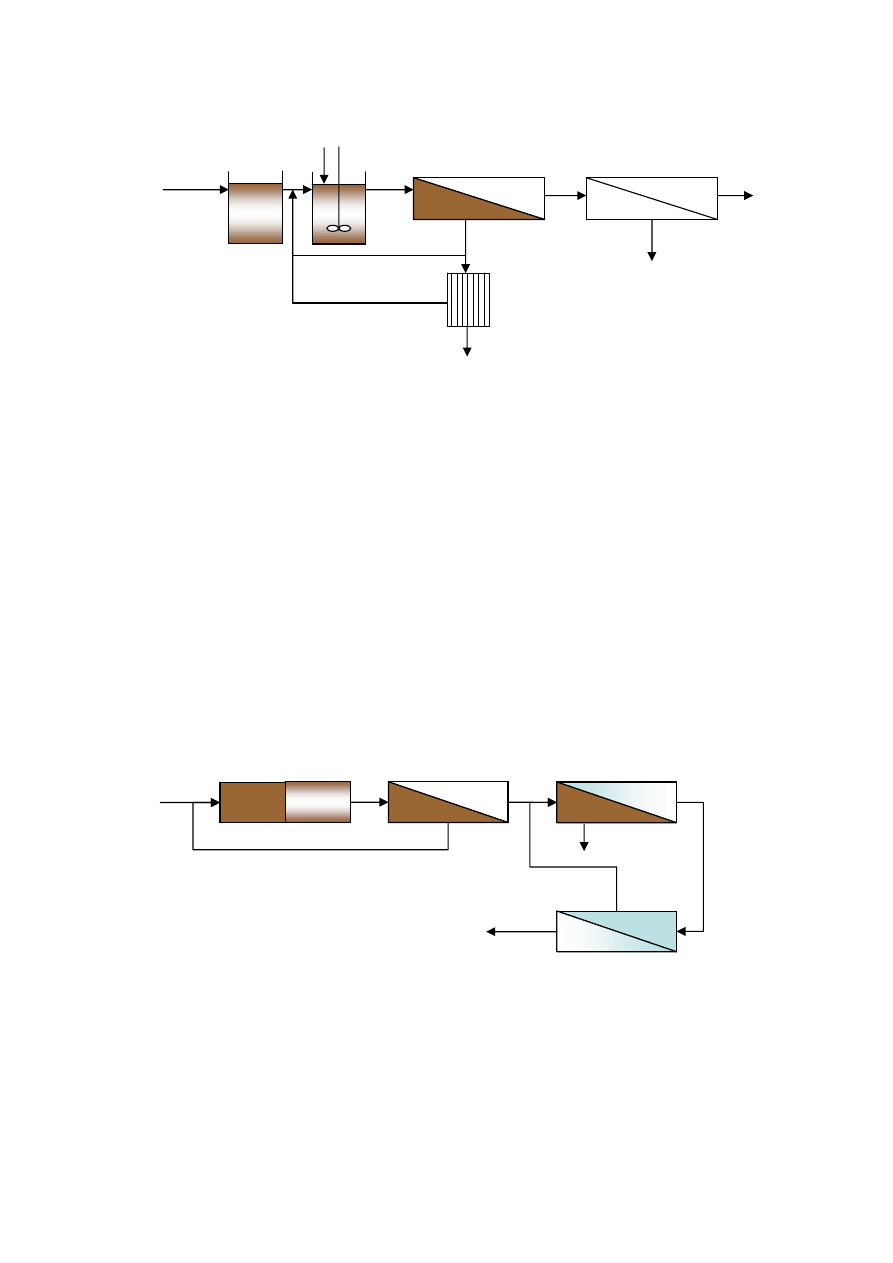
38
Figure 2.8 Schematic Diagram of Microfiltration/Reverse Osmosis for Leachate Treatment
(Qasim and Chiang, 1994)
2.9.3 Denitrification-Nitrification/Ultrafiltration and Reverse Osmosis
The application of membrane bioreactors combined with reverse osmosis on a full
scale leachate treatment was evaluated by PCI Memtech. The process train is as shown in
Figure 2.9.
Initially a RO unit was used in the leachate treatment; however, combination of
composted wastewater and leachate led to a decrease in the RO performance. Therefore, an
aerobic MBR was adopted. The treatment scheme consists of separate nitrification-
denitrification reactors followed by an external UF membrane. The performance of the
plant is illustrated in Table 2.16.
Figure 2.9 Schematic Diagram of Denitrification-Nitrification/UF and Reverse Osmosis for
Leachate Treatment
Influent
Flow
Equalization
Chemical
Treatment
Microfiltration
Reverse Osmosis
Filter Press
Effluent
RO Concentrate
(Recirculation)
Solids
Leachate
Ultrafiltration
Discharge to
Surface Water
Denitrification
Reverse Osmosis I
Reverse Osmosis II
Permeate I
Concentrate II
Concentrate I
(To Landfill Site)
Permeate II

39
Table 2.16 Typical Leachate Composition at Each Stage of Leachate Treatment Plant
Parameter (mg/L)
Raw Leachate
MBR Process
RO Permeate I
RO Permeate II
COD
TKN
AOX
NO
x
-N
5,000
2,000
4,000
-
1,250
100
2,500
<400
125
10
250
50
15
2
25
5
Note: AOX = Adsorbable Organic Halogens
The study indicated that the treatment of weak leachate by conventional aerobic
methods was inadequate due to a loss of biomass along with activated sludge. The
application of MBR would be advantageous in such cases.
2.9.4 MBR-UV and Ozone-Reverse Osmosis
Bressi and Favali (1997) evaluated various treatment schemes to develop a modular
treatment system with flexibility, which is required to treat varied composition and
characteristic of landfill leachate over the entire lifetime of a landfill. The basic
technologies selected in the study were: a membrane bioreactor for biological treatment by
aerobic oxidation and nitrification; a system for UV/ozone for increasing biodegradability
and partial oxidation; thermal treatment in the form of evaporation for concentration and
reverse osmosis treatment for the elimination of dissolved solids and reduction in organic
load.
The choice of ozone as a pre-treatment for stabilized leachate and as a post-treatment
for young leachate, increases the biodegradability and aids in the partial removal of organic
residuals after the MBR process, respectively. UV and ozone also offers the advantage of
breaking down and partially oxidizing low degradable molecules. From the review of the
process schemes, Bressi and Favari (1997) suggested that the membrane bioreactors should
be supported by UV/ozone for the oxidation of refractory compounds. Ideally, the
UV/Ozone process should be located after the MBR process. As a post or polishing
treatment, they are also effective in degrading colour contributing humic compounds.
However, it was found that the UV/Ozone process was more efficient when placed after
MBR process in young leachate and before MBR process in the old leachate.
From the various treatment schemes evaluated, the MBR followed by reverse
osmosis proved to be most promising system. Removal efficiencies of 96-99 % could be
obtained and the effluent could be directly discharged into the environment. The reverse
osmosis process, unlike the MBR, is purely a concentration process which effectively
reduces the volume to be discharged. From a landfill management point of view, this
proves advantageous. This process unlike MF-RO process proposed by Qasim and Chiang
(1994) incorporates the activated sludge and microfiltration unit operations in a single-step
MBR process thus eliminating the clarifier present in a conventional process. Further, the
biological pre-treatment of the leachate ensured a better quality permeate from the RO unit
and prolonged the life span of the RO unit by reducing fouling effects and treatment costs.
2.10
Microbial Toxicity
In the biological treatment plant, the possibility of presence of toxic material is high.
If present, these toxicants may inhibit the microbial activity, thus deteriorating their

40
activity to degrade the pollutants. Lead is one of the important toxicant due to its abilities
to causes devastating and irreversible neurological damage to children, leading to learning
disabilities and damage to the brain and nervous system. Exposures at high doses of lead
can lead to coma, convulsions and death (LaGrega, et al., 1994). Inhibitory effects on
biological treatment can be observed by reduced organic removal efficiency, and poor
settling characteristics of the microorganism in the biological process. The toxicity of the
pollutant depends on the concentration and type of organism present. In this context, the
importance of toxicity or inhibition can not be neglected.
Various methods have been described in the literature to determine the toxicity of
chemicals to microorganisms. Normally, the toxicity of the compound is evaluated with
organism such as algae, water flea, and fish, which is costly and time consuming. The
focus of these methods is to mainly investigate the inhibition of microbial respiration in
relation to rate of oxygen consumption.
In biological treatment, toxicity is generally monitored by measuring certain
activities of the microorganisms. This may be observed by changes in respiratory activity
or biochemical tests which measure the concentration of certain biochemical agents
(Talinli and Tokta, 1994; Chen, et al., 1997; Madoni, et al., 1999). It is possible to
determine the inhibitory effects of compounds with the help of feed from activated sludge
batch reactors in which a biological seed and various concentrations of inhibitors are
mixed. Respiratory response is a sensitive determinant which provides a faster and more
accurate estimate of which is acceptable toxicity studies (Morgan and de Villiers, 1978).
Toxicity detection system uses a variety of biological responses and process
variables, for a wide range of biological species. The measurement of oxygen uptake,
organic removal efficiency, or enzymatic activity indicates biological responses to the
various conditions. A variety of toxic agents can cause different patterns of inhibition (i.e.,
activity per unit biomass vs toxicant concentration), on the other hand, various activity
indicators may show different inhibition patterns for a single toxic agent (Patterson, et al.,
1970).
DO concentration is an important variable in the operation of the biological treatment.
The toxicity could be tested by comparing the respiration rate before and after addition of
toxicant (Temmink, et al., 1993; Madoni, et al., 1999). The results obtained from toxicity
test could tell the extent to which the efficiency and operation of biological treatment could
be affected.
The respiration rate of activated sludge depends on the activity of biomass which are
also depends on some operating conditions in the activated sludge process. The operating
conditions include mean cell residence time, organic loading rate, substrate limitation,
environmental conditions such as pH, temperature, and toxic substances. The maximum
respiration rate should be constant under normal operating conditions. In the presence of
toxicant in the system, the maximum respiration rate and the performance of the system
will decrease (Kim, et al., 1994).
Temmink,
et al. (1993) had conducted a study of copper (Cu) toxicity. During the
experiment, the copper concentration in the wastewater was increased from 25 to 200 mg/L.
It was found that the respiration rate decreased about 30% at the copper concentration of
50 mg/L. The sludge had been completely inactivated when the copper concentration in the

41
influent reached 200 mg/L. For the wastewater polluted with phenol, phenol concentration
range of 1,000-1,500 mg/L could inhibit the respiration of the sludge by 37%.
Kim,
et al. (1994) investigated the toxicity by using respiration meter, the data
evaluation show that the respiration rate decreased about 20% at Cobalt (Co) concentration
of 28 mg/L. It was reported that the growth microorganisms was inhibited even at a
concentration lower than 0.08 mg/L. In addition, the toxicity test was conducted in high
and low pH conditions and it was found that respiration rate decreased in both.
Madoni,
et al. (1996, 1999) investigated the effect of lead toxicity on activated
sludge process. The respiration rate was inhibited 67% at the soluble lead concentration of
16.9 mg/L after one hour exposure. The acute toxicity of lead to organisms has been
reported at concentration ranging from 2 to 6 mg/L.
The concentrations of various toxicants and their inhibitory on bacterial respiration
are summarized in Table 2.17.
Table 2.17 Inhibitory Effect of Various Toxicants
Toxicants Concentration
(mg/L)
Inhibition of Respiration
(%)
Reference
Co 28
20
Kim,
et al., 1994
Cu 50
30
Temmink,
et al., 1993
Cd
40
50
Talinli and Tokta, 1994
Ni
9
50
Talinli and Tokta, 1994
Pb 16.9
67
Madoni,
et al., 1999
Phenol
1,000-1,500
1,600
37
50
Temmink, et al., 1993
Talinli and Tokta, 1994
2.11 Membrane Bioreactors
Bioreactors are reactors that convert or produce materials using functions naturally
endowed to living creatures. Reactors using immobilized enzymes, microorganisms,
animal, or plant cells and those applying new methodologies such as genetic manipulation
or cell fusion are typical bioreactors (Belfort, 1989). Therefore, bioreactors are reactors
used to produce material with new or advanced technology by the application of biological
functions.
The combination of membranes to biological processes for treatment has led to the
emergence of membrane bioreactors (MBR) for separation and retention of solids; for
bubble-less aeration within the bioreactor; and for extraction of priority organic pollutants
from industrial contaminated water (Stephenson, et al., 2000). The membrane unit can be
configured external to or immersed in the bioreactor (Figure 2.10).
In an external circuit, the membranes can be either internally or externally skinned
whilst submerged membrane reactors should contain membranes that are externally
skinned. The incorporating of membranes into the biological reactor has eliminated the
sedimentation tank from biological treatment step associated with conventional wastewater
treatment practices.
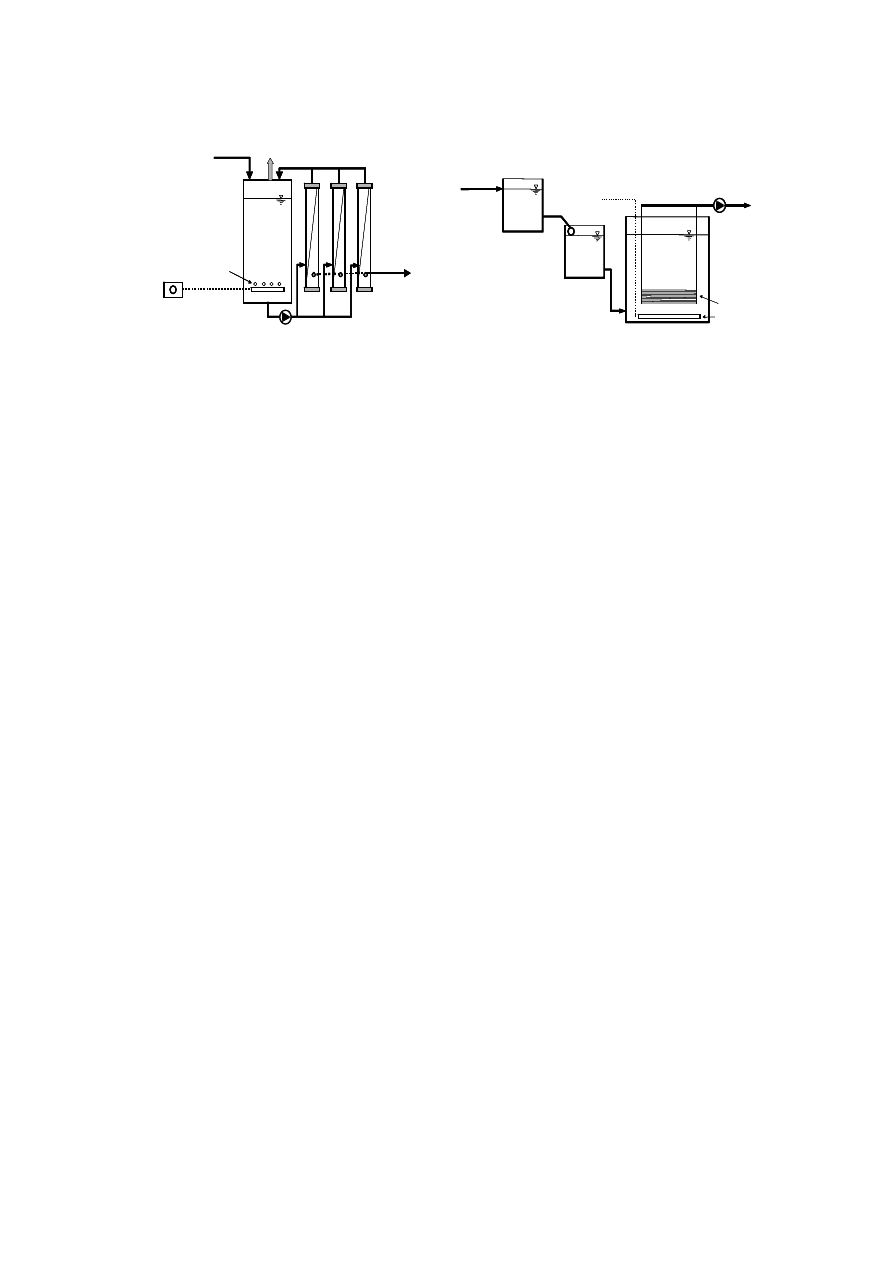
42
(a)
(b)
Figure 2.10 Schematic Diagrams of (a) External Recirculation MBR and (b) Submerged
MBR System
2.11.1 Membrane Configuration
Membrane bioreactor configurations include: extractive membrane bioreactors
(EMBR), bubble-less aeration membrane bioreactors (MABR), recycle membrane
bioreactors and membrane separation bioreactors.
Treatment by aerobic processes is often limited by insufficient oxygen while using
air as an oxygen source. The implementation of oxygen as opposed to air as an aeration
medium would increase the degradation rate of the system. However, since conventional
aeration devices have high power requirements and a high rate of mixing, these devices
cannot be used with biofilm processes. MABR process uses gas permeable membranes to
directly supply high purity oxygen without bubble formation in a biofilm (Stephenson, et
al., 2000). The membranes are generally configured in either a plate-and-frame or hollow
fibre module. However, research has focussed on the hollow fibre arrangement with gas on
the lumen-side and wastewater on the shell-side. The hollow fibre modules are preferred
since the membrane provides a high surface area for oxygen transfer while occupying a
small volume within the reactor.
The membrane recycle bioreactor consists of a reaction vessel operated as a stirred
tank reactor and a membrane module containing the membrane. The substrate and
biocatalyst are added to the reaction vessel in pre-determined concentrations. Thereafter,
the mixture is continuously pumped through the membrane. While the biocatalyst adheres
to the membrane surface, the medium permeates through the membrane and is recycled to
the reactor vessel.
A summary of the advantages and disadvantages of each bioreactor configuration is
presented in Table 2.18.
The versatility and treatment capability of membrane bioreactors has catapulted the
technology as a viable alternative in water and wastewater treatment over a short period.
Initial design configurations of external loop systems were prone to fouling which
prevented stable operation and hence was confined to small-scale operations with limited
value and applicability.
Air Outlet
Influent
Effluent
Return Sludge
Air Diffuser
Membrane Unit
Bio-Reactor
Air Compressor
Level Control
Tank
Membrane
Air Diffuser
Compressed Air
Effluent
Influent
Feed Tank
Air Outlet
Influent
Effluent
Return Sludge
Air Diffuser
Membrane Unit
Bio-Reactor
Air Compressor
Air Outlet
Influent
Effluent
Return Sludge
Air Diffuser
Membrane Unit
Bio-Reactor
Air Compressor
Level Control
Tank
Membrane
Air Diffuser
Compressed Air
Effluent
Influent
Feed Tank
Level Control
Tank
Membrane
Air Diffuser
Compressed Air
Effluent
Influent
Feed Tank

43
Table 2.18 Advantages and Disadvantages of Membrane Bioreactors (Stephenson, et al.,
2000)
Advantages
Disadvantages
Membrane Separation Bioreactors
Small footprint
Complete solids removal from effluent
Effluent disinfection
Combined COD, solids and nutrient removal in a
single unit
High loading rate capacity
Low/zero sludge production
Rapid start up
Sludge bulking not a problem
Modular/ retrofit
Aeration limitations
Membrane fouling
Membrane costs
Membrane Aeration Bioreactors
High oxygen utilization
Highly efficient energy utilization
Small footprint
Feed-forward control of O demand
Modular/retrofit
Susceptible to membrane
fouling
High capital costs
Unproven at full-scale
Process complexity
Extractive Membrane Bioreactors
Treatment of toxic industrial effluent
Small effluent
Modular/retrofit
Isolation of bacteria from wastewater
High capital cost
Unproven at full-scale
Process complexity
Systems were designed with long HRT and SRT resulting in little or no sludge
production. The basic problem with membrane bioreactor technology in the early
development stages was the high energy costs and the high cost of membranes.
Application was therefore limited to small industrial and commercial systems that used
large diameter membranes with little pre-screening and could handle large concentrations
of solids in the mixed liquor typically of 20,000 to 40,000 mg/L.
The membrane bioreactor was revolutionised when focus shifted to immersed
membrane bioreactor systems. The membrane was immersed directly into the activated
sludge tank with constant flow maintained by an upstream level control tank. The system
SRT was maintained, however, MLSS concentrations were lowered to 15,000 from 25,000
mg/L. The evolutions away from the external circuit reduced energy consumption and
broaden the membrane scope to large-scale varied applications. However, as cited in
McCann (2002), the membrane costs were high; fluxes were low and a standardised
operating protocol incorporating flux enhancement and chemical cleaning was not
established.
Later, large-scale systems were developed and optimization for municipal
wastewater treatment. The MLSS was further lowered to 15,000 from 20,000 mg/L while
the SRT remained long to limit sludge production. Developments in the optimization of
operating conditions has allowed for prolonging membrane life to approximately 5 years.
Process developments included 3-mm pre-screening, increase in membrane and plant size,

44
optimization of the filtration cycle, improvement of aerator reliability and improved
cleaning strategies on a rotational basis.
The development of membrane module, improved anti-trash screening and cyclic
aeration and standardised design which are the recent advancements. This allowed for the
systems to be handled at peak loads and prolonged membrane life to at least 5 years and
reduced membrane costs.
The first full-scale plant was located in South West England, where the MBR was
designed to treat municipal wastewater in a site with area restrictions and located close to a
beach and residential area. The plant was able to treat 13,000 m
3
/d and enclosed in a
building 105 m long. The system was effective in removing bacteria and ammonia. The
second plant was built in the open and used for dairy effluent treatment. The plant was
simple in design and unsophisticated yet was able to treat an effluent load of 16 ton/d on
BOD and was able to discharge effluent directly into a river. The MBR units were located
in 10 tanks, each with a flow of 1,000 m
3
/d of screened effluent prior to discharge into an
existing oxidation ditch. Though, initially it had been used for treating domestic
wastewater, later its application widened.
2.11.2 Application of Membrane Bioreactors
Bressi and Favari (1997) conducted studies on a MBR system consisting of an
activated sludge process coupled with an external hollow fibre ceramic MF unit. The
system was aerated by means of diffusers and the mixed liquor passed through the lumen
of membrane and was recycled to the activated sludge whilst permeate was extracted on
the shell side. The continuous recycle aided in maintaining homogeneous conditions within
the aerobic reactor.
Hall, et al. (1995) investigated the system for removal of adsorbable organic halogen
(AOX). It gained 61% AOX removal during the operation at HRT of 24 h. It was operated
under condition of MLSS from 10,000 to 20,000 mg/L and with an initial AOX from 21 to
50 mg/L. Lubbecke, et al. (1995) experimented the pilot scale for landfill leachate
treatment by MBR process. Concentration of raw leachate contains 2,700 to 4,300 mg/L
COD, 200 to 350 mg/L BOD, and 1.5 to 4.4 mg/L AOX. This system was operated at HRT
from 15 to 25 hours and pressure from 2.5 to 4.5 bars. It achieved 75% to 80% COD
removal and 30% to 60% AOX reduction under the average permeate flux 15 L/m
2
-h for
the NF membrane. While, for an average permeate flux of 40 L/m
2
-h for UF membrane, it
could eliminate 65% and 25% to 30% of COD and AOX, respectively. Jensen, et al. (2001)
investigated MBR for leachate treatment. This process was conducted at pH range from 6.5
to 6.8 with HRT of 2.7 days the performance achieved a COD removal efficiency of more
than 90%.
Results from the study indicated that the membrane bioreactor processes have great
potential with respect to biomass retention and their treatment efficiency. The study
showed that the incorporation of membranes in the system retains active biological bacteria
population and produces a high quality effluent. The system also showed that it was
probably capable of higher loading rates and has yet to achieve its maximum treatment
capacity. This was made possible with good control of bacteria population in the reactor
provided by the membranes. Throughout the study, there was negligible biomass loss

45
through the effluent. Different operational conditions for the application of MBR in
wastewater treatment are presented in Table 2.19.
When the performance of MBR was evaluated, the removal efficiencies was found to
be between 78 to 94 % for young leachate with COD > 10,000 mg/L, 60 to 65 % for
intermediate leachate with COD ranging from 5,000 to 7,000 mg/L and 23 to 46 % in the
case of stabilized leachate with COD < 2,500 mg/L. However, the membrane bioreactor
alone was not able to treat the pollutant to meet effluent discharge as it was unable to
reduce chlorides, sulphates, ammonia-nitrogen and refractory organic compounds.
When combined reverse osmosis-nanofiltration system has been operated at a landfill
site in Halle-Lochau, Germany, consistency with a permeate recovery rate of 95 to 97.5 %
could be achieved. The primary disadvantages of membrane bioreactors include capital
costs for the membranes and operating costs associated with routine membrane cleaning.
However, one of the major disadvantages of reverse osmosis and membrane
processes is membrane fouling, more especially biofouling. Biofouling is a serious
problem for the operation of membrane bioreactor systems because it results in decreased
trans-membrane fluxes. Biofouling involves the combined effects of biological, physical,
and chemical clogging of membrane pores. Clogged pores result in: (a) reduced trans-
membrane fluxes, (b) a need for higher operating pressures, and (c) deterioration of the
membrane. To eliminate the problems associated with biofouling, it is necessary to study
biofilm attachment and formation on membrane surfaces. By understanding the
mechanisms of biofilm formation, the initiation of biofouling formation can be eliminated.
If the initiation of biofouling is eliminated, the costs associated with cleaning the
membranes could be dramatically reduced.
Membrane bioreactors are further able to pre-treat leachate more successfully than
SBR processes prior to disposal in the sewers. Due to the presence of membrane; a
complete retention of solids is still possible to maintain. However, membrane systems are
susceptible to shock loading of ammonia. When this occurs, biomass may be affected.
2.11.3 Sludge Characteristics
In the membrane bioreactor (MBR) system, membrane fouling is attributed to the
physico-chemical interaction between the biofilm and membrane. When the biofilm gets
deposited on the membrane surface, this leads to decline in the permeate flux. This cake
layer can be removed from the membrane through a suitable washing protocol. On the
other hand, internal fouling caused by the adsorption of dissolved matter into the
membrane pores could be generally removed by chemical cleaning.
The phenomenon of membrane fouling in the MBR system is very complex and
difficult to understand. The sludge characteristic is one of main factors influencing the
membrane fouling which includes mixed liquor suspended solids (MLSS), dissolved
substances, floc size and extracellular polymeric substances (EPS). The components of the
mixed liquor, ranging from flocculant solids to dissolved polymers such as extracellular
polymeric substances (EPS) can lead to membrane fouling.

46
Table 2.19 Operating Conditions of Membrane Bioreactor Process for Treatment of Different Kinds of Wastewater
Wastewater
Volume
(L)
HRT
(h)
Initial COD
(mg/L)
BOD/COD
MLSS
(mg/L)
SRT
(d)
OLR
(kg COD/m
3
.d)
Reference
5500
30,000-50,000
20,000 50 2.2-10.2
Nagano,
et al., 1992
2750
140
42,660
10,900
16
5.40
Krauth and Staab,
1993
1900 144-240 29,400
1,800
50-75
2.5-4.9 Zaloum, et al., 1994
-
24
13,300
0.49
-
-
-
Scott and Smith, 1997
Industrial
Wastewater
15
24
21-50 (AOX)
10,000-20,000
-
-
Hall, et al., 1995
220 15-25
2,700-4,300
30,000-47,000
Lubbecke,
et al., 1995
287 (m
3
) 54
14,200
28,700
31
6.3 Mishra, et al., 1996
180 (m
3
)
28.8
4,000
0.2
Dijk and Roncken,
1997
9,500 240
8,000
(BOD)
4,000
30
Ahn,
et al., 1999
Leachate
303 (m
3
) 65 850-4,200 0.40-0.75
8,000-10,000 80
Jensen,
et al., 2001

47
Mixed Liquor Suspended Solids and Dissolved Substances
The effects of the MLSS concentration on the membrane fouling have been reported
by many researchers as membrane resistance varies proportionally in MLSS concentration
(Fane, et al., 1981) and when the MLSS concentration exceeded 40,000 mg/L, the flux is
found that dramatically decrease (Yamamoto, et al., 1989). However, Lubbecke, et al.
(1995) illustrated that MLSS concentrations upto 30,000 mg/L is not directly responsible
for irreversible fouling, and that viscosity and dissolved matter have a more significant
impact on flux decline. The increase in viscosity to yield a substantial suction pressure
increase can causes the failure of MBR system (Ueda, et al., 1996).
The effects of MLSS, dissolved matter, and viscosity on membrane fouling could be
estimated as given by Sato and Ishii (1991) in the following manner:
326
.
0
368
.
1
926
.
0
)
(
*
)
(
*
)
(
*
*
7
.
842
µ
COD
MLSS
P
R
∆
=
Eq. 2.1
Where:
R
=
Filtration resistance, m
-1
∆
P
=
Transmembrane pressure, Pa
µ
= Viscosity,
Pa.s
MLSS =
mixed liquor suspended solid, mg/L
COD
=
Soluble chemical oxygen demand, mg/L
According to the few researches, the role of mixed liquor in membrane fouling was
due to the presence of suspended solids (SS), colloids, and dissolved matter which
contributed to resistance against filtration by 65, 30, and 5 % respectively (Derfrance, et al.,
2000). Through fractionation of the mixed liquor of activated sludge into floc cell, EPS
and dissolved mater, Chang and Lee (1998) indicated EPS as an important component
contributing to fouling causing resistance in the filtration process. However, these studies
show that individual fouling resistances were not additive due to the sum of the resistances
given by each component was found to be greater than the measured total resistance.
Wisniewski and Grasmick (1998) fractionated the activated sludge suspension into
settleable particles (particle size above 100 µm), supracolloidal-colloidal fraction (non-
settleable particle with a size ranging from 0.05 to 100 µm), and soluble fraction (obtained
after filtration with 0.05 µm membrane). They revealed that 52% of the total resistance
could be attributed to soluble components.
Particle Size Distribution
Many researchers have sought to establish the influence of particle size on the cake
layer resistance. Generally, the particle size of an activated sludge floc ranges from 1.2 to
600 µm (Jorand, et al., 1995). The break-up of biological flocs, generating fine colloids
and cells which later form a denser cake layer on the membrane is due to the shear force
rising as a result of pumping during cross-flow filtration (Wisniewski and Grasmick, 1998;
Kim, et al., 2001). According to Wisniewski, et al. (2000), after the floc breakup, the
suspension produced consists mainly of particles having a size of around 2 µm causing a
decrease in flux. 97% of the particles in the MBR system have an average diameter smaller
than 10 µm, while the activated sludge contained flocs range from 20 to 200 µm in size
(Cicek, et al., 1999).

48
Floc breakup exposes the EPS present inside the floc structure as well as increasing
the EPS level in bulk solution, which causing seriously membrane fouling (Chang and Lee,
2001). The floc breakup also leads to a loss of biological activity (Brockmann and
Seyfried, 1996; Ghyoot, et al., 1999; Chang and Lee, 2001), change in microorganism
population (Rosenberg, et al., 1999) and decreasing settleability (Cicek, et al., 1999).
Extracellular Polymeric Substances (EPS)
The EPS production is a general property of microorganisms in natural environments
and occurs in bacteria, algae, yeast, and fungi (Flemming and Wingender, 2001). They are
construction materials for microbial aggregates such as biofilm, floc, and sludge.
An activated sludge floc is a microbial entity which is formed by different species
of biomass. The components of the floc are embedded in a polymeric network of EPS. A
significant barrier to permeate flow in the MBR is due to EPS providing a highly hydrated
gel matrix in which microorganisms are embedded. Microbial EPS are high molecular-
weight mucous secretions from microbial cells. They are important for floc formation in
activated sludge liquors (Sanin and Vesilind, 2000; Liao, et al., 2001). The EPS matrix is
very heterogeneous, with polymeric materials which includes polysaccharides, proteins,
lipids, and nucleic acids (Bura, et al., 1998; Nielson and Jahn, 1999)
Many MBR studies have identified EPS as the most significant biological factor
responsible for membrane fouling. Chang and Lee (1998) found there to be a linear
relationship between membrane fouling and EPS levels. Nagaoka, et al. (1996, 1999)
found that increase in hydraulic resistance and viscosity of the mixed liquor was due to the
accumulated EPS in the system and also on the membrane. There was a linear relationship
between the hydraulic resistance and viscosity of the mixed liquor, which caused rapid
attachment of the suspended EPS. Huang, et al. (2001) found soluble organic substances
with high molecular weights, mostly attributable to metabolic products, to accumulate in
the bioreactor. These had an indirect proportionality with the membrane permeability.
Accumulation of 50 mgTOC/L resulted in 70% decrease in flux. The fouling proneness
due to specific EPS components has also been studied. Shin, et al. (1999) ascribed 90% of
the cake resistance to EPS and found resistance varied with the ratio of carbohydrate and
protein in the EPS, thereby influencing permeated flux during ultrafiltration. The permeate
flux decreased with an increasing protein content (Mukai, et al., 2000). Kim, et al. (1998)
found that the addition of powdered activated carbon to the MBR was shown to increase
permeability by reducing dissolved EPS levels from 121-196 mg/gVSS to 90-127
mg/gVSS.
Most studies on the effect of EPS on membrane fouling rely on EPS extraction from
the sludge flocs. However, relatively large amounts of EPS can originate from
unmetabolized wastewater components and bacterial products arising either from cell-lysis
of cell-structural polymeric components (Dignac, et al., 1998). Thus, the quantitative
expression of flux as a function of EPS concentration has an inherent limitation.
49
2.12 Yeasts
2.12.1 Introduction
The yeast degrade organics either anaerobically (fermentation) or aerobically
(oxidation). The most typical yeast process applied in food or beverage industries is
anaerobic, also known as alcoholic fermentation. The end products of fermentation can be
alcohols, acids, esters, glycerol and aldehydes. A typical reaction of sugar fermentation by
yeasts is shown in the following reaction:
C
6
H
12
O
6
+ nutrients C
2
H
5
OH + CO
2
+ new biomass
Under aerobic process, complete oxidation of organics yields carbon dioxide and
water. Abundant supply of oxygen enhances considerable yeast growth; whereas
incomplete oxidation is accompanied by the accumulation of acids and other intermediary
products. There are differences in the compounds which can be assimilated by various
species of yeasts. Some can degrade pentoses, polysaccharides (starch), sugars, alcohols,
organic acids (lactic, acetic, citric) and other organic substrates.
COHNS + O
2
+ nutrients CO
2
+ H
2
O + new biomass + end products
(Organic matter)
Yeasts may utilize the nitrogen required in their metabolism for the synthesis of
protein from organic (amino acids, urea, vitamins, peptone, aliphatic amines, etc.) and
inorganic sources (ammonia, nitrite and nitrate). Most species can utilize the ammonium
ionmaking it appropriate for leachate treatment. Other nutrients required for yeast growth
include phosphorous, sulfur (organic sulfur and sulphate), minerals (potassium, magnesium,
sodium and calcium). The C:N:P ratio of Candida utilis biomass was found to be 100:20:5.
Therefore, nutrient demands of yeasts are higher than that of bacteria whose BOD
5
:N:P
ratio is 100:5:1 (Defrance, 1993).
Yeasts can grow in a wide pH range (from 2.2 to 8.0). In general, yeasts grow well
on media with acid reactions (from 3.8 to 4.0), whereas optimum pH values for bacteria
growth range from 7.5 to 8.5. Yeasts have been used in the fermentation industry which
requiring operation at a high substrate concentrations and under high loads. It is noted that
yeast can be utilized to treat the wastewater containing solids, high concentrations of
organic matter and salt, and other substances, which are difficult to treat using activated
sludge process (Nishihara ESRC Ltd., 2001). Furthermore, yeasts can grow in
temperatures ranging from 0 to 47
o
C, the optimum temperature being from 20 to 30
o
C.
2.12.2 Applications of Yeasts for Wastewater Treatment
Miskiewicz, et al. (1982) developed yeast based treatment for fresh piggery wastes
by adding carbon source (beet molasses or sucrose). Candida tropicalis, Candida
tropicalis, Candida robusta and Candida utilis were the yeast strains that were cultured in
the aerated batch reactor. According to the study, molasses are the most appropriate carbon
source of yeast. The use of raw piggery waste without carbon supplement leads to low
biomass yield and low treatment efficiency, inspite of nutrients (N, P) content being high.
The culture of C. utilis on molasses-enriched piggery waste (5,570 mg COD/L) could

50
obtain high treatment efficiencies of 76% TKN, 60% COD, 84% phosprorus removal at
HRT of 7 hours and with a F/M ratio of 1.73 g COD/g MLSS.d. The maximum specific
growth rate of C. utilis was found to be 0.19 h
-1
Hu (1989) used ten different yeast strains in cultures to treat vermicelli wastewater
which contained BOD ranging from 24,000 to 44,000 mg/L and high concentration of
starch, lactic acid and protein. Based on the ability of starch degradation, protein
hydrolysis and lactic acid tolerance, these yeast strains were screened from 391 colonies
isolated from soil samples. Most of them could grow well with pH range of 3.0-5.0, 4.0
being the optimum. The results shows that the two strains could reduce soluble COD by
92% at HRT of 7 days, F/M ratio of 0.48 g COD/g MLSS.d and VLR of 1.03 kg
COD/m
3
.d. Due to the poor settling ability of yeasts, they could not be flocculated or
settled as in a conventional activated sludge process and were easily washed out with the
effluent. Therefore, the HRT in this process have to keep long and same as the SRT. The
author postulated that the fungi contamination prevented the formation of yeast flocs.
Chigusa, et al. (1996) used nine different strains of yeasts capable of decomposing
the oil to treat wastewater from oil manufacturing plants. A pilot scale yeast treatment
system had been run for one year. According to the results, 10,000 mg/L of hexane extracts
in the raw wastewater were reduced by the yeast mixture to about 100 mg/L.
Elmaleh et al.(1996) investigated the yeast treatment of highly concentrated acidic
wastewater from the food processing industry. The strain Candida utilis was cultured in
continuously completed mixed reactors. This system did not have a separate settling tank;
the SRT and HRT of the system were identical. A mixture of acetic acid, propionic and
butyric acid was the carbon source of feed wastewater. The pH was maintained at 3.5 to
prevent any bacterial contamination. The TOC removal obtained was 97% at high loading
rates (30 kg TOC/m
3
.d). The growth yield and maximum specific growth rate of yeasts
were similar to those for conventional activated sludge (
µ
max
= 0.5 h
-
; Y = 0.85-1.05 kg
SS/kg TOC for acetic acid).
Olive mill wastewater normally contains high concentration of fats, sugars, phenols,
volatile fatty acids which contribute to a very high COD concentration (100,000-200,000
mg/L). Scioli and Vollaro (1997) reported that Yarrowia lipolytica cultured in aerated
fermenter was capable of reducing the COD level of olive oil processing wastewater by
80% in 24 h. Fats and sugars were completely assimilated while methanol and ethanol
were present. The effluent had a pleasant smell due to the presence of these compounds.
The authors asserted that a possible approach for pollution reduction in olive-oil-producing
countries is to use membrane to filter effluent before discharging into the sewage system.
Useful biomass (40% protein) and valuable lipase enzyme could also be obtained in this
process.
Arnold, et al. (2000) investigated the ability of selected yeast strains (C. utilis and
Galactomyces geotrichum) to purify silage wastewater containing high COD concentration
of 30,000 to 80,000 mg/L by using the shaker-flask. High removal efficiencies of COD
(74-95%), VFA (85-99%) and phosphate (82-99%) were obtained after 24 hrs and some
ammonia was also removed. During treatment, pH rose from initial values of 3.7-5.8 to
8.5-9.0. This was presumably due to removal of lactic acid and VFAs. An efficient
removal of P from the system could lead to the shortage of phosphorus.
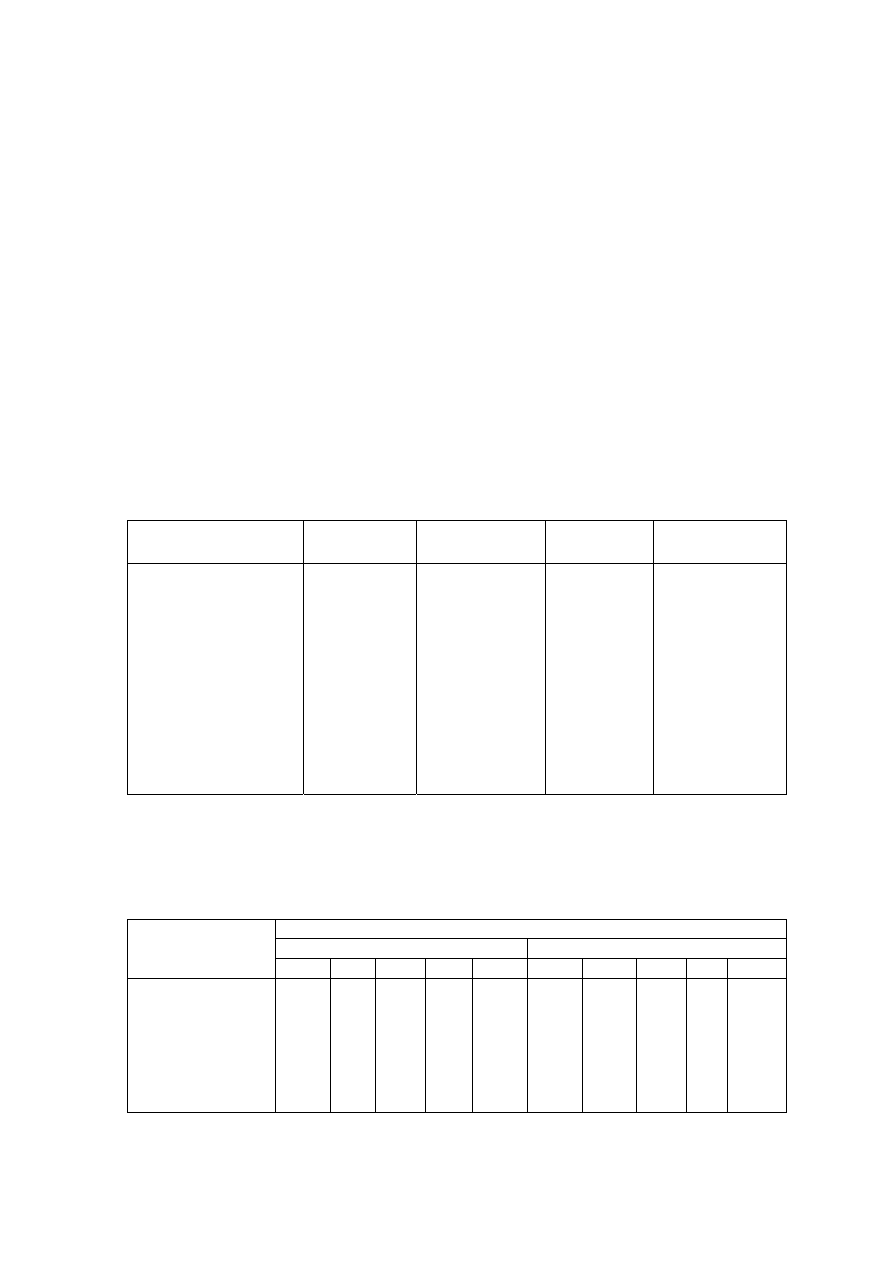
51
Nishihara ESRC Ltd. (2001) studied the effect of the Yeast Cycle System on dried
food and marine products processing wastewater. In this system, the yeast
treatment/pretreatment could be conducted with high organic and nutrient loadings. The
organic removal obtained was more than 90%. Moreover, this system is relatively
unaffected by load variation and the structure of yeast flocs facilitated oxygen diffusion.
Table 2.20 gives a comparison with conventional complete mixing activated sludge in
terms of the operating conditions. Dried food products processing wastewater has BOD
5
concentrations ranging from 2,920-15,800 mg/L and SS concentration 1,360 mg/L. Marine
products processing wastewater has BOD
5
and SS concentrations ranging from 3,550-
8,850 mg/L and 680-940 mg/L respectively. Some yeast strains, Candida edax, Candida
valdivana and Candida emobii, were predominantly grown during enrichment with this
raw wastewater. The predominance of yeast strains with the enrichment culture technique
is based on free competition among different organisms in real wastewater. It was found
that the yeast treatment process can obtain high efficiency at a higher volumetric loading
(5–6 times), F/M ratio (2–3 times) when compared with the AS process. The efficiency of
this system is presented in Table 2.21.
Table 2.20 Operating Conditions of Yeast System Compared with Activated Sludge
Process (Nishihara ESRC Ltd., 2001)
Parameter Unit
Dried
Food
Products
Marine
Products
Activated
Sludge*
Influent BOD
5
mg/L 5,200 5,450
110-400
BOD
5
volumetric
loading
kg/m
3
.day
9.12
8.48
0.8 – 1.9
Yeast concentration
mg/L
8,000-13,500
8,000-
10,000
2,500 – 4,000
BOD
5
sludge loading
(F/M)
kgBOD
5
/kgVSS.day
0.9
0.9
0.2 – 0.6
Water temperature
°C
27
26
23 – 30
pH
6.5
4.8
6.5 – 8.5
DO mg/L
0.8
0.7
≥ 2
SVI
ml/g
53
66
100 – 120
Remark * Complete mixed activated sludge (Tchobanoglous and Burton, 1991)
Table 2.21 Performance of Yeast Based Treatment System in Dried Food Products and
Marine Product Industry (Nishihara ESRC Ltd., 2001)
Parameter (mg/L)
Dried Food Products
Marine Products
BOD
5
SS T-N T-P Cl
-
BOD
5
SS T-N
T-P Cl
-
Influent 5,450
798
153
33
5,160
5,218
1,360
198
38
1,080
After pretreatment
by yeast
150
113
72
18
5,080
118
95
109
22
1,068
Efficiency (%)
97
86
53
46
2
98
93
45
42
1
After activated
sludge 4
15
10
15
5,080
12
18
16
7
1,068
Efficiency (%)
97
87
86
17
-
90
81
85
68
-

52
Dan, et al. (2002) conducted the high salinity wastewater with yeast membrane
bioreactor. The COD removal efficiency obtained was from 60% to 85% with a volumetric
loading rate of 3.4 to 16.3 kg COD/m
3
.d. It was found that yeast cell size, low operating
pH, and poor adhesion capacity reduced membrane fouling. To reduce the problems of
frequent membrane fouling, the application of yeast to treat wastewater is considered.
2.13 Rationale for the Study and Proposed Treatment Sequence
2.13.1 Leachate Characteristic
The development of a treatment sequence incorporating biological and physico-
chemical processes is necessary for the treatment of medium-age or intermediate landfill
leachate. In the proposed study, leachate obtained from a sanitary landfill in Pathumthani,
Thailand which has been in operation for 5 years, together with leachate derived from
compression of fresh domestic waste from a transfer station in Bangkok, Thailand were
mixed to simulate a medium-age leachate.
The leachate was simulated to mimic a low biodegradable, high ammonia leachate
with BOD, COD and TKN ranging from 2,500±500, 8,000±1,000 and 1,900±100 mg/L,
respectively.
The decision to synthesize a leachate by combining the two leachate sources was to
attain consistent characteristic was based on the continual variability of leachate obtained
from a single source. Hence, little or no control of the leachate can be exercised in
development of a treatment sequence making it more complicated. Since, it has been
proposed by previous researchers that some degree of control should be maintained over
the waste dumped and leachate generated, a synthetic leachate is justified. Further,
Thailand’s tropical climate drastically affects the leachate quality. Therefore, over a long-
term experimental investigation, it is deemed unfeasible to attempt to use a raw leachate
source.
2.13.2 Need for Ammonia Stripping
Due to the presence of elevated ammonia concentrations in the leachate, sludge
properties are affected resulting in a fine floc which is difficult to settle. The high
ammonium concentration also poses toxicity to the microorganisms, thus affecting the
degradation process. Therefore, the effect of ammonia concentrations of 2,000 mg/L was
investigated with yeast and bacterial cultures. Due to toxicity, removal of ammonia was
therefore apparent for leachate treatment. Thus, ammonia stripping was evaluated.
Ammonia removal by air stripping was selected as a pre-treatment for the reduction
of ammonia from 2,000 to 200 mg/L. Ammonia stripping has the advantage of reducing
refractory compounds and thereby reducing COD concentrations, by precipitation when
pH is adjusted. This approach was adopted in the conventional biological nitrification-
denitrification process since nitrification-denitrification processes were subjected to many
operation problems such as nitrification-denitrification inhibition.
Further, for the leachate characteristic, treatment efficiency by nitrification-
denitrification is considered poor with BOD/TKN < 2.5, BOD/NH
3
< 4 and COD/TKN < 5
(Grady, et al., 1999). In order to ensure successful removal of ammonia in the

53
nitrification-denitrification process, an external carbon source in the form of leachate,
methanol etc. could be necessary. An external carbon source could further increase the
operational costs. Chemical treatment by coagulation, flocculation and precipitation
eliminates the increased chemical costs making this option realistic for ammonia removal.
Thus, ammonia stripping seems to be the most viable option. While ammonia stripping can
be conducted in packed towers with efficiencies up to 95 %, the intention of this study is to
merely reduce leachate with total nitrogen content of 1,800-2,000 mg/L to a level below
toxicity for further biological treatment, for which a conventional ammonia stripping
would be sufficient. Thus, by maintaining an optimal operating condition by controlling,
air flowrate and pH, an ideal condition based on ammonia removal, ammonia toxicity and
mixing power efficiency could be obtained using a conventional stirred tank.
One of the main disadvantages of ammonia stripping is the high cost associated with
pH adjusters. The choice of pH adjuster is also crucial in design and rendering the process
cost effective, a reduction in the amount of adjuster can be brought about by pre-aerating
the leachate. The synthetic leachate used in this study has an average pH of 8.5 ±0.5. Since,
this is already in the alkaline range; the amount of buffer added to raise pH for ammonia
stripping is not significant.
2.13.3 Need for Membrane Bioreactors
If the pre-treatment of ammonia stripping fails, this would lead to shock loading in
the biological system, making it difficult for the floc to settle down. This problem can be
solved by the adoption of a membrane process to replace the clarifier in a normal activated
sludge process since the membranes can retain total solids until the sludge recovers from
shock loading of ammonia.
Purification of leachate by membrane processes aids in preventing further
contamination of groundwater resources and surface water. However, in selecting a
treatment option, or a combination of treatment operations, the economic feasibility and
affordability of the technology should also be considered. In this regard, membrane
filtration has proven to be a justifiable and economic solution in most cases, even when the
overall costs for the purification are compared with other approaches for leachate treatment
(Peters, 1997).
By coupling of a membrane with the activated sludge reactor, a membrane bioreactor
emerges as a logical treatment option. The reduced operational costs associated with
immersed membrane bioreactors proves advantageous in its application and therefore
preferred in the present study.
The use of a MBR allows the HRT to be reduced from 1 to 10 days (Qasim and
Chiang, 1994) to less than 24 h. This reduction is drastic and viable in terms of operation
costs and effectiveness. Reduction in SRT from conventional activated sludge SRT of 15
to 60 d has the advantage of reducing air requirements in the MBR. Maintaining a lower
MLSS is advantageous since lower the sludge produced, the greater is the effectiveness of
aeration. This approach effectively reduces the aeration requirements and a smaller SRT
and HRT reduces the required reactor volume and thus the capital cost.
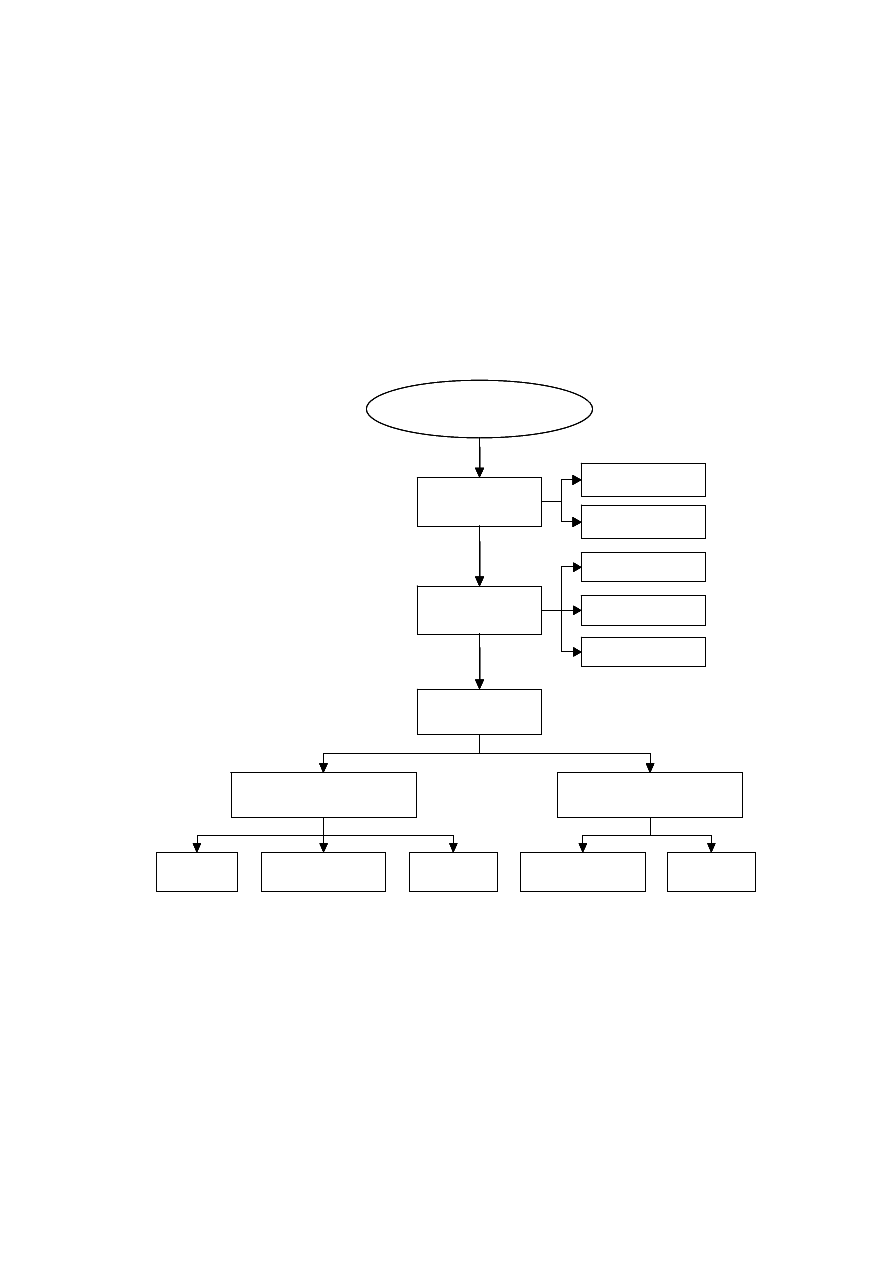
54
Chapter 3
Methodology
3.1 Introduction
The present study on landfill leachate treatment comprises of four experimental
stages, namely: toxicity study, ammonia stripping, membrane bioreactor study and sludge
characterization. The different experimental stages of this study are shown in the Figure
3.1.
Figure 3.1 Flowchart Showing Different Stages of Experimental Study
3.2 Leachate Characterization
The leachate used for the treatment was obtained from Pathumthani Landfill Site and
Ram-Indra Transfer Station, which were initially characterized. After characterization
these leachates were mixed in an appropriate proportion to simulate a medium-aged
leachate composition. The characteristic of the simulated leachate used for the study is
shown in Table 3.1.
Acclimatized yeast and
bacteria sludges
Toxicity study
Ammonia stripping
study
Membrane bioreactor
study
Lead
Ammonia nitrogen
MWCO
HRT
Sludge characteristics
Contact time
pH
Gradient velocity
Coupling ammonia stripping
with MBR process
MBR process
MWCO
Sludge characteristics
Acclimatized yeast and
bacteria sludges
Toxicity study
Ammonia stripping
study
Membrane bioreactor
study
Lead
Ammonia nitrogen
MWCO
HRT
Sludge characteristics
Contact time
pH
Coupling ammonia stripping
with MBR process
MBR process
MWCO
Sludge characteristics
Acclimatized yeast and
bacteria sludges
Toxicity study
Ammonia stripping
study
Membrane bioreactor
study
Lead
Ammonia nitrogen
MWCO
HRT
Sludge characteristics
Contact time
pH
Gradient velocity
Coupling ammonia stripping
with MBR process
MBR process
MWCO
Sludge characteristics
Acclimatized yeast and
bacteria sludges
Toxicity study
Ammonia stripping
study
Membrane bioreactor
study
Lead
Ammonia nitrogen
MWCO
HRT
Sludge characteristics
Contact time
pH
Coupling ammonia stripping
with MBR process
MBR process
MWCO
Sludge characteristics
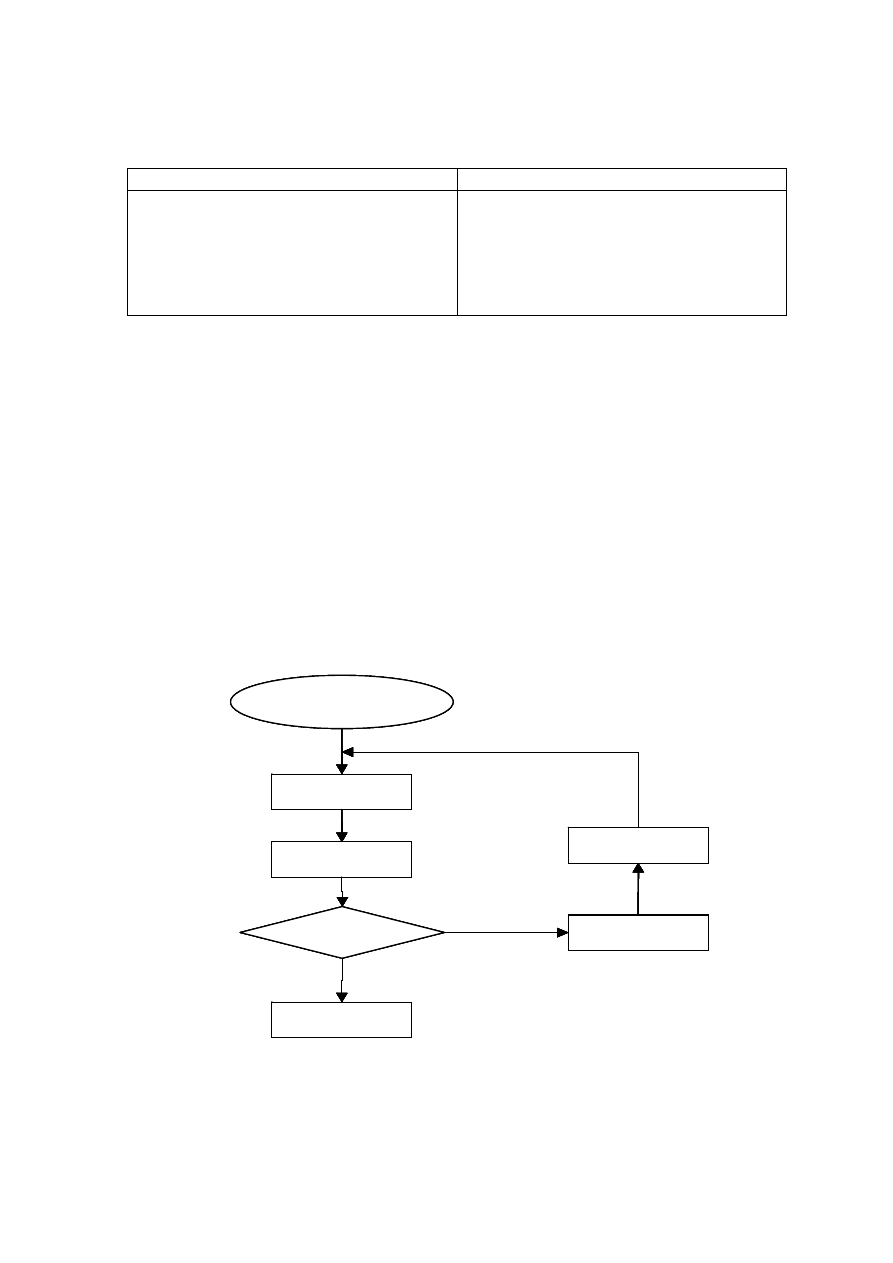
55
Table 3.1 Composition of Simulated Leachate
Parameters Concentration
pH
COD (mg/L)
BOD/COD
NH
4
-N (mg/L)
TKN (mg/L)
TDS (mg/L)
7.8-8.2
8,000±1,000
0.40±0.05
1,700±100
1,900±100
12,000±1,000
Note: Pb concentration is below 0.3 mg/L, which has no effect on microbial toxicity.
3.3 Seed Study
3.3.1 Yeast and Bacterial Sludge
a) Yeast Sludge
The mixed yeast sludge comprises of a mixture of wild yeast varieties that exist in
the raw wastewater and which quantitatively propagate under normal enrichment
conditions. The procedure for enrichment of yeasts was carried out according to the
Standard Methods for the examination of water and wastewater (APHA, et al., 1998). The
yeast strains were selected based on competition among different organisms present in
wastewater (Nishihara Ltd., 2001) by the enrichment culture technique. Figure 3.2
illustrates the procedure for enrichment of yeast.
Figure 3.2 Diagram Illustrating the Enrichment Procedure
Filling
Seed yeast sludge
(from sediments
)
Aeration
24 h
Drawing
Settling
MLSS
Completion
> 3,000 mg/L
Filling
Seed yeast sludge
(from sediments)
Aeration 24 h
Drawing
Settling
MLSS
Enriched culture
< 3,000 mg/L
Filling
Seed yeast sludge
(from sediments
)
Aeration
24 h
Drawing
Settling
MLSS
Completion
> 3,000 mg/L
Filling
Seed yeast sludge
(from sediments)
Aeration 24 h
Drawing
Settling
MLSS
Enriched culture
< 3,000 mg/L

56
The yeast sludge was collected from the bottom sediments of a pond from the
Nonthaburi landfill site, Thailand. A two-liter container was used for enrichment and was
done using fill-and-draw process. The wastewater feed (having glucose as substrate) was
mixed with a diffused aeration system. The pH was adjusted to 3.5 which is optimum for
yeast growth and can prevent bacterial contamination (Elmaleh, et al., 1996). After 24
hours of aeration, the biomass suspension was allowed to settle for 10 hours. Yeast cells,
normally, settle in the bottom, whereas the acid-tolerant bacteria and filamentous fungi
would remain in the suspension. The bacteria and fungi present in the supernatant were
removed by decanting the supernatant. Around 1.5 liters of supernatant was decanted and
fresh medium was added to the next batch. When MLSS of the yeast biomass exceeded
3,000 mg/L, the enrichment process was accomplished.
b) Bacteria Sludge
The bacterial seed sludge was collected from the aeration tank in the activated sludge
process of a wastewater treatment plant.
3.3.2 Acclimatization
Acclimatization was done in order to obtain a mixed bacterial and yeast culture
which can tolerate leachate containing low biodegradable organics and high ammonia
concentration. Five-liter batch reactors were used for acclimatization through fill-and-draw
process. The operating conditions for the reactors are summarized in Table 3.2.
Table 3.2 Operating Conditions for Yeast and Bacteria Acclimatization
Operating Conditions
Yeast Reactor
Bacteria Reactor
HRT (h)
24
24
MLSS (mg/L)
10,000
5,000
COD (mg/L)
8,000±1,000
8,000±1,000
Temperature (
O
C)
25 to 30
25 to 30
pH
3.5 to 3.8
6.8 to 7.0
Both the reactors were aerated by a diffused aeration system and the pH was adjusted
to 3.5 - 3.8 for yeast growth and 6.8 - 7.0 for bacterial growth, respectively. After 24 hours
of aeration, the biomass was allowed to settle for 3 hours. After 3 hours of settlement, the
supernatant was collected and centrifuged at 4000 rpm for 15 minutes. The experiment was
repeated for the next batch under the same conditions until a COD removal of 70% could
be achieved. Once the COD removal efficiency reached a value greater than 70%, the
acclimatization was presumed to be complete.
3.4 Toxicity
Studies
The toxicity studies were done with yeast and bacterial culture. The toxicity of the
culture was tested for different concentrations of ammonia and lead.
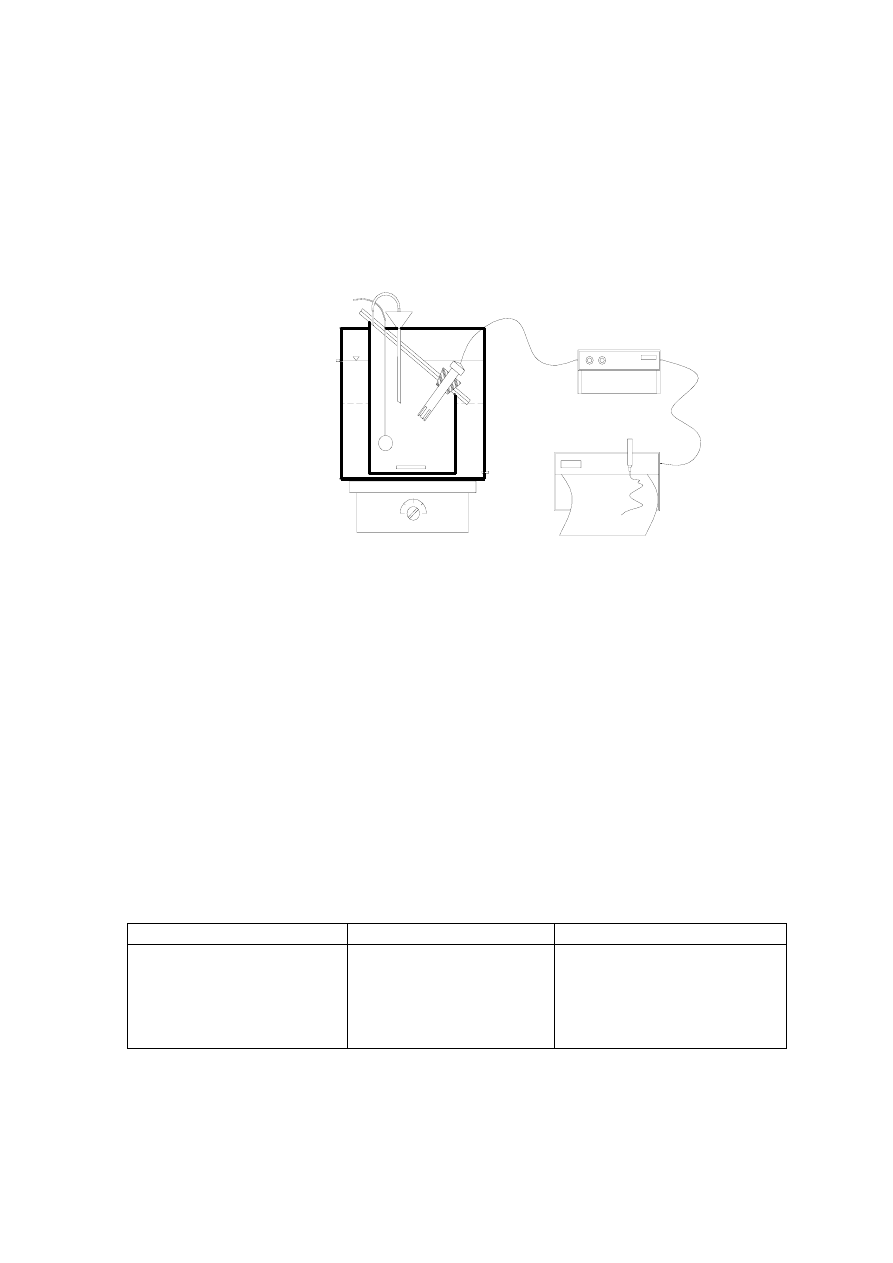
57
3.4.1 Ammonia Toxicity
The experiments were conducted in a closed 0.9-liter batch respirometer equipped
with a recorder, DO meter, and water jacket vessel to maintain a constant temperature as
shown in Figure 3.3.
Figure 3.3 Respirometer
The operating conditions for yeast and bacterial culture used in this experiment are
given in Table 3.3. The experiment was conducted with low S
o
/X
o
(initial substrate
concentration/biomass concentration) ratio. The oxygen uptake rate (OUR) was measured
until the OUR reaches a constant value, which is approximately equal to OUR in the
endogenous phase (Ekama, et al., 1986). The results from the respirometric experiments
would provide the OUR data which can be applied to evaluate the inhibition effects of
ammonia on the microorganisms. Ammonium chloride (NH
4
Cl) was used as a source of
ammonia. The NH
4
-N concentration was varied from 200 to 2,000 mg/L.
Table 3.3 Operating Conditions for Yeast and Bacteria Mixtures in Respirometer
Operating Conditions
Yeast Mixture
Bacteria Mixture
pH
3.5 to 3.8
6.8 to 7.0
Temperature (
o
C) 30±0.5 30±0.5
MLVSS (mg/L)
800 to 1,000
800 to 1,000
S
o
/X
o
ratio
0.01 to 0.02
0.01 to 0.02
Suppressing nitrification
None
Adding 70 mg/L as NH
3
-N *
Remark: * Liebeskind (1999)
The experimental procedure for the determination of the inhibitory effects is as
follows:
1
2
3
4
5
6
7
8
9
1. Respiration Cell
2. Water Jacket
3. Air Diffuser
4. DO Probe
5. Magnetic Bar
6. Magnetic Stirrer
7. Expansion Funnel
8. DO Meter
9. Recorder
1
2
3
4
5
6
7
8
9
1. Respiration Cell
2. Water Jacket
3. Air Diffuser
4. DO Probe
5. Magnetic Bar
6. Magnetic Stirrer
7. Expansion Funnel
8. DO Meter
9. Recorder

58
1. Obtaining endogenous sludge: 0.9 liter of fresh sludge without the substrate was
obtained in a respirometer and aerated for two hours.
2. Suppressing nitrification: With high ammonia concentration during the organic
oxidation, the oxygen uptake rate of nitrification process was constant. Hence,
NH
4
Cl of concentration 70 mg/L was added.
3. Recording endogenous oxygen uptake rate (OUR): After suppressing the nitrification
process, the mixture was aerated for half an hour before measuring the endogenous
OUR.
4. Adding substrate: An accurate dose of substrate was injected into the respirometer
and the total OUR was recorded by respirogram. Re-aeration was done once the DO
concentration dropped below 2 mg/L.
3.4.2 Lead Toxicity
The lead toxicity on the bacterial and yeast culture was conducted in the same
manner as described in the section 3.4.1. Lead nitrate (Pb (NO
3
)
2
) was used as Lead (Pb)
source. Soluble Pb concentration was varied from 0 to 20 mg/L. At each concentration, the
sample was filtered with 0.45 µm membrane filter and soluble Pb concentration was
analyzed using an atomic absorption spectrophotometer (AAS).
3.5 Ammonia Stripping
The characteristics of leachate used for the experiment are as described in Table 3.1.
The summary of the experiments conducted in order to optimize ammonia stripping is
illustrated in Figure 3.4.
The efficiency of ammonia stripping in ammonia removal was tested varying three
parameters namely- pH, contact time and the velocity gradient.
The experiments conducted are as follows:
1. Optimum pH for air stripping: The pH was varied from 9-12 (9, 10, 11, and 12) using
12 N NaOH solution. The removal efficiency of ammonia at varying pH was
assessed with a velocity gradient of 2,850 s
-1
for two hours.
2. Optimum velocity gradient and contact time: After the optimum pH was obtained,
the velocity gradient and the contact time were varied. The velocity gradients at
which the experiment was done were 1,530, 2,850, and 4,330 s
-1
. The contact time
was varied from 1 to 6 hours.
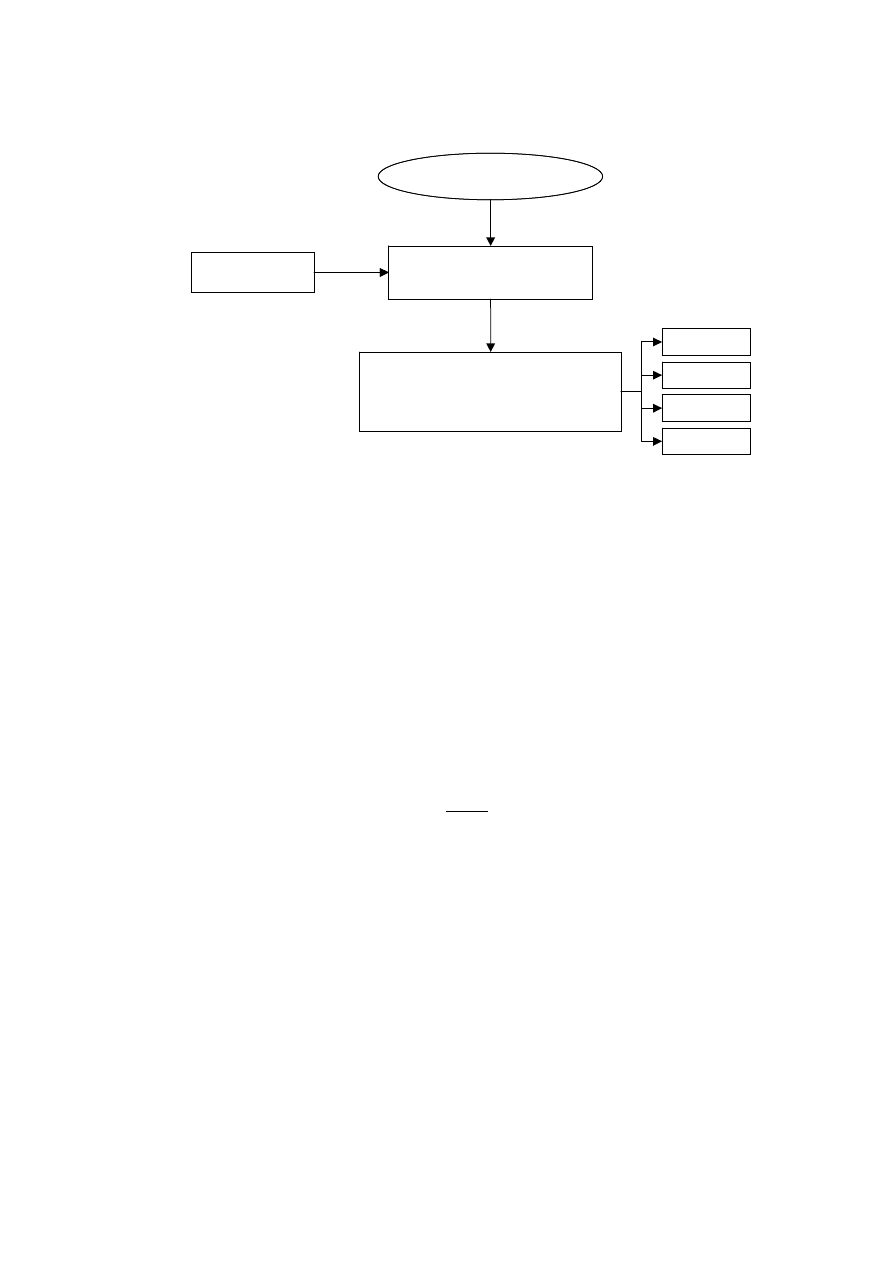
59
Figure 3.4 Experiments Conducted to Optimize Ammonia Stripping
3.6 Membrane Bioreactor
3.6.1 Membrane Resistance Measurement
The new membrane module requires a test in order to find out the initial membrane
resistance. Membrane resistance was measured based on the resistance-in-series model
which provides a simple means of describing the relationship between permeate flux and
trans-membrane pressure. According to this model, it is expressed by the following
equation:
J = TMP
Eq.
3.1
µ R
t
Where:
J
= permeate flux (m
3
/m
2
.s)
TMP = trans-membrane pressure (Pa)
µ
= permeate viscosity (Pa.s)
R
t
= total resistance for filtration (1/m)
For further understanding of the components of membrane resistances causing the
membrane clogging, the total resistance (R
t
) was measured right after the run with the
membrane still in its clogging condition. R
m
and R
n
were obtained by measuring the
resistance of the membrane after being washed with tap water to remove the cake layer.
The membrane resistance at the beginning of the run after chemical clean was considered
as R
m
. R
c
Value was derived from R
t
, R
m
, and R
n
using Equation 3.2.
Leachate
NaOH Solution
Variation of Velocity Gradient
and Contact Time
(for 2, 3, 4, 5 and 6 h)
Control
1,530 s
-1
pH Adjustment
(for pH 9, 10, 11 and 12)
2,850 s
-1
4,330 s
-1

60
R
t
= R
m
+ R
n
+ R
c
Eq.
3.2
Where:
R
m
= intrinsic resistance (1/m)
R
n
= resistance due to irreversible fouling (1/m)
R
c
= resistance due to cake layer (1/m)
The membrane after clogging was taken out of the reactor for cleaning. The
membrane was first cleaned with tap water to remove the cake layer attaching on the
membrane surface follows by chemical cleaning as listed in Table 3.4 until the membrane
resistance was recovered to the initial membrane resistance.
Table 3.4 Description of the Chemical Cleaning
Stage
Cleaning Agent
Concentration
Running Time (min)
1
NaOH
3% by weight
20
2
Ultra pure water
10
3 HNO
3
1% by weight
20
4
Ultra pure water
10
3.6.2 Experimental Set-up
The experiments were conducted in two reactors namely: (1) yeast membrane
bioreactor (YMBR), and (2) bacterial membrane bioreactor (BMBR) as shown in Figure
3.5. The reactor and the membrane dimensions of the bacterial and yeast bioreactor were
similar. The experimental set-up consists of a feed tank placed above the bioreactors. The
volume of the feed entering the bioreactor from the feed tank was maintained by a level
controller tank. A volume of 5L was maintained in the bioreactor. The technical details of
the membrane bioreactor are given in Table 3.5.
Table 3.5 Technical Parameters of the Experimental Plant
Parameters Description
Manufacture Mitsubishi
Rayon
Model STNM424
Membrane surface (m
2
) 0.42
Type of module
Hollow fibre
Membrane material
Polyethylene
Nominal pore size (
µm)
0.1
Reactor shape
Cylindrical
Reactor material
Transparent acrylic
Reactor diameter (cm)
10
Reactor volume (L)
5
Aeration Stone
diffuser
Backwashing Air
backwash
Cleaning
3% NaOH and 1% HNO
3
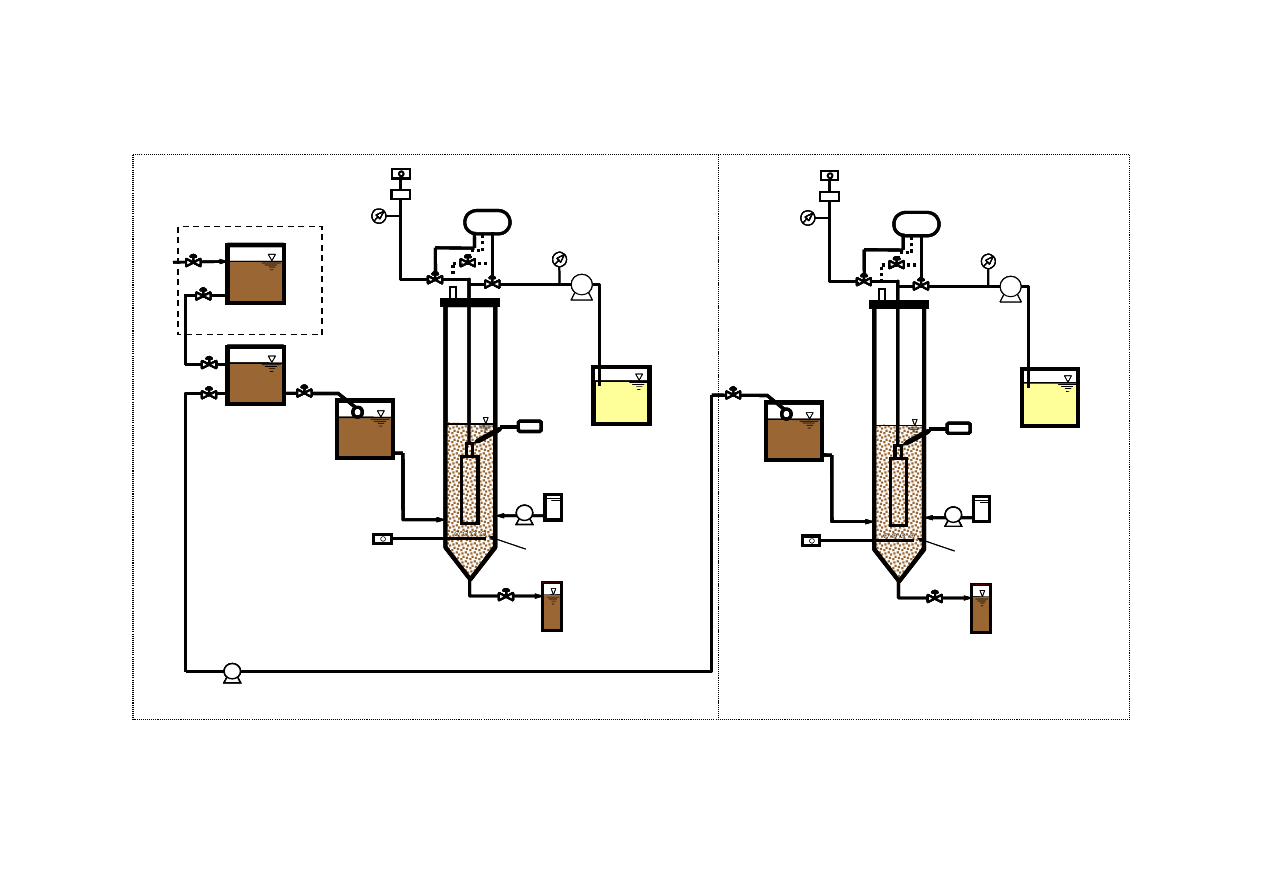
61
Figure 3.5 Schematic Diagrams of Membrane Bioreactor with and without Ammonia Stripping
Air Compressor
Ammonia Stripping
Reactor
Level Control
Tank
Treated Water
Tank
Suction Pump
Timer
Vacuum
Gauge
Air Filter
Pressure
Gauge
Air Diffuser
Excess
Sludge
Air Compressor
Air Outlet
pH Controller
Sulfuric Acid
Solution
P
P
P
Yeast Membrane Bioreactor
Leachate
Feed Tank
Dosing
Pump
Air Compressor
Level Control
Tank
Treated Water
Tank
Suction Pump
Timer
Vacuum
Gauge
Air Filter
Pressure
Gauge
Air Diffuser
Excess
Sludge
Air Compressor
Air Outlet
pH Controller
Sulfuric Acid
Solution
P
P
Bacteria Membrane Bioreactor
Dosing
Pump
Air Compressor
Ammonia Stripping
Reactor
Level Control
Tank
Treated Water
Tank
Suction Pump
Timer
Vacuum
Gauge
Air Filter
Pressure
Gauge
Air Diffuser
Excess
Sludge
Air Compressor
Air Outlet
pH Controller
Sulfuric Acid
Solution
P
P
P
Yeast Membrane Bioreactor
Leachate
Feed Tank
Dosing
Pump
Air Compressor
Ammonia Stripping
Reactor
Level Control
Tank
Treated Water
Tank
Suction Pump
Timer
Vacuum
Gauge
Air Filter
Pressure
Gauge
Air Diffuser
Excess
Sludge
Air Compressor
Air Outlet
pH Controller
pH Controller
Sulfuric Acid
Solution
P
P
P
P
P
P
P
Yeast Membrane Bioreactor
Leachate
Feed Tank
Dosing
Pump
Air Compressor
Level Control
Tank
Treated Water
Tank
Suction Pump
Timer
Vacuum
Gauge
Air Filter
Pressure
Gauge
Air Diffuser
Excess
Sludge
Air Compressor
Air Outlet
pH Controller
Sulfuric Acid
Solution
P
P
Bacteria Membrane Bioreactor
Dosing
Pump
Air Compressor
Level Control
Tank
Treated Water
Tank
Suction Pump
Timer
Vacuum
Gauge
Air Filter
Pressure
Gauge
Air Diffuser
Excess
Sludge
Air Compressor
Air Outlet
pH Controller
pH Controller
Sulfuric Acid
Solution
P
P
P
P
P
Bacteria Membrane Bioreactor
Dosing
Pump
Option

62
The reactors were continuously aerated with the help of stone diffusers placed at the
bottom of the reactors. The polyethylene hollow fibre membrane was kept in the upper end
of the reactors. Peristaltic pumps were used to withdraw permeate from these membrane
modules. The reactors were also equipped with the pH meter to monitor pH continuously.
The pH of the yeast and bacterial reactor was maintained within the range of 3.5 to 3.8 and
6.8 to 7, respectively with the help of an external dosing pump. The DO in the reactors was
maintained around 2-4 mg/L.
Both the bioreactors were operated with periodic air backwashing. The filtration
cycle of the reactor consists of 25 minutes of filtration, 3 minutes of air backwashing at a
pressure of 300 kPa, and 1 minute of air release. The operation of filtration, backwash and
release air was alternatively controlled with an intermittent controller and solenoid valves.
The trans-membrane pressure (TMP) was measured using a mercury manometer.
Sampling from the reactors was done from the sampling port. The sludge from the
reactor could be withdrawn from a sampling port present in the bottom of the reactor. The
treated leachate was collected in a container kept at the side of the reactor. The treated
effluent corresponds to permeate from the membrane bioreactor.
3.6.3 Parametric Studies
The experiments were done by varying the volumetric loading. The different
organic loading rates (OLR) used in this experiment are summarized in Table 3.6. Each
volumetric loading was maintained at least for 25 days. Furthermore, the excess sludge
was periodically withdrawn to maintain a mean biomass concentration of 10,000 to 12,000
mg/L of MLSS. The pH in the YMBR system and BMBR system was maintained around
3.5 to 3.8 and 6.8 to 7.0, respectively. The varied mean hydraulic retention time in which
the experiment was conducted are 12, 16, 20 and 24 hours. The hydraulic loading varied
from 6.75 to 17.88 kg COD/m
3
.d .
Table 3.6 Experimental Operating Conditions of YMBR and BMBR Systems
Stage Time
(days)
Mean HRT
(h)
OLR
(kg COD/m
3
.d)
1
2
3
4
1-25
26-60
61-149
150-181
24
20
16
12
6.75-8.33
7.60-11.14
9.54-14.40
13.92-17.88
3.6.4 Molecular Weight Distribution
To investigate the composition of organic content in the leachate on the basis of their
molecular weight, ultrafiltration membrane (UF) was used. Ultrafiltration was performed
in a 300 ml cell, using flat circular membrane of 76 cm diameter with molecular weight
cut-off (MWCO) of 5,000, 10,000, and 50,000 Daltons (Da). Nitrogen gas was used to
apply pressure in the UF cell at about 2 bars (Gourdon, et al., 1989; Huang, at el., 2000).
The three types of UF with molecular weight cutoff ranges are presented in Table 3.7. The
fractionated organics in the treated leachate were also measured to find out the organic
removal efficiency of the membrane bioreactor in terms of their molecular weight. The
organics were fractionated into four groups based on their molecular weight (MW): (1)
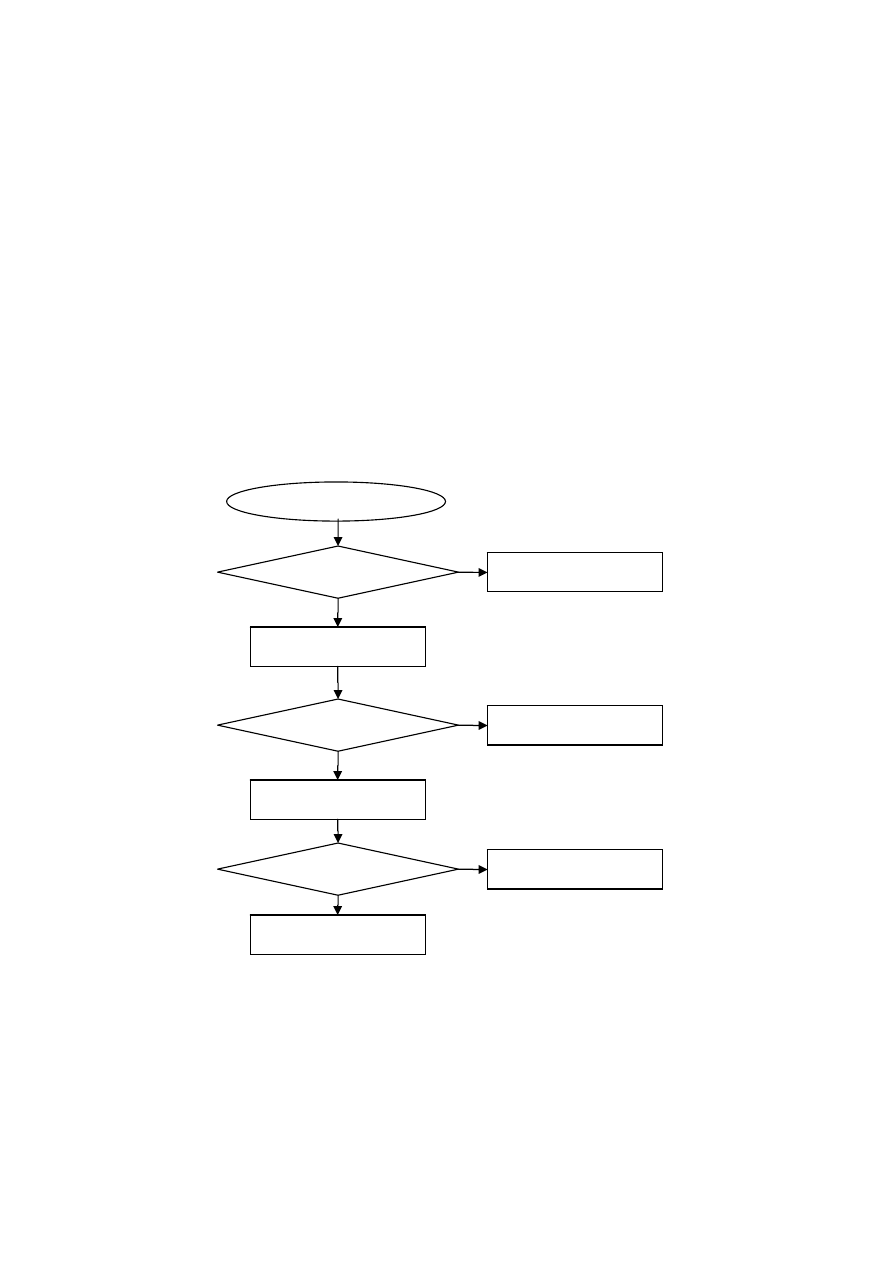
63
MW larger than 50 kDa, (2) MW between 10 kDa and 50 kDa, (3) MW between 5 kDa and
10 kDa, and (4) MW less than 5 kDa. The procedure for molecular weight distribution
study is described in Figure 3.6.The procedure for molecular weight distribution is as
follows:
1. 100 mL of sample was filtered in a 0.45 µm membrane before fractionating it with
UF at 50 kDa MWCO at a pressure of 2 bars for 30 minutes.
2. The permeate of the UF membrane used for 50 kDa MW was collected and further
fractionated with serial processing method using the corresponding UF at 10 kDa,
and 5 kDa MW, using the same mode of operation.
3. The volume of retentate of each fraction and permeate obtained after 5 kDa MW UF
were measured and analyzed for COD concentration.
Figure 3.6 Methodology for Performing Molecular Weight Cut-off Distribution
50 kDa MW
Leachate
Retentate
Permeate
10 kDa MW
Retentate
Permeate
5 kDa MW
Retentate
Permeate

64
Table 3.7 Characteristics of Ultrafiltration Membrane
UF Membrane Types
MWCO (kDa)
Koch membrane, M-100
50
Koch membrane, K-131
10
Koch membrane, K-328
5
3.6.5 Sludge Characterization
The variation in sludge characteristics was estimated in both the reactors. The
YMBR and BMBR systems can be divided into three zones based on the membrane cycle.
Based on the membrane fouling, the sludge was sampled for analysis. Sludge properties
which were determined in both the reactors were the extra cellular polymer substances
(EPS), sludge volume index (SVI), capillary suction time (CST), MLSS and viscosity.
3.7 Ammonia Stripping Coupled Membrane Bioreactor
The membrane bioreactor was coupled with ammonia stripping to find out the
treatment efficiency of this combined treatment system. The experimental set-up consists
of two treatment systems, namely: ammonia stripping and membrane bioreactor (MBR) as
shown in Figure 3.5. Figure 3.7 show the procedure of the coupling ammonia stripping
with MBR.
The operating conditions for ammonia stripping process were based on the results
obtained from the previous experiment. Mean velocity gradient, pH and the mixing time
were based on the experimental results obtained after optimization of the ammonia
stripping conditions. The ammonia stripped leachate was used as a feed in both the YMBR
and BMBR reactors. The design of the reactors used for the experiment was similar to
bioreactor as described 3.6.2.
The HRT used in this experiment are from the results obtained after performing the
parametric studies as described in session 3.6.3. The excess sludge was periodically
withdrawn to maintain a mean biomass of 10,000 to 12,000 mg/L of MLSS. The bioreactor
was assessed in terms of the membrane performance in leachate treatment and sludge
characteristics.
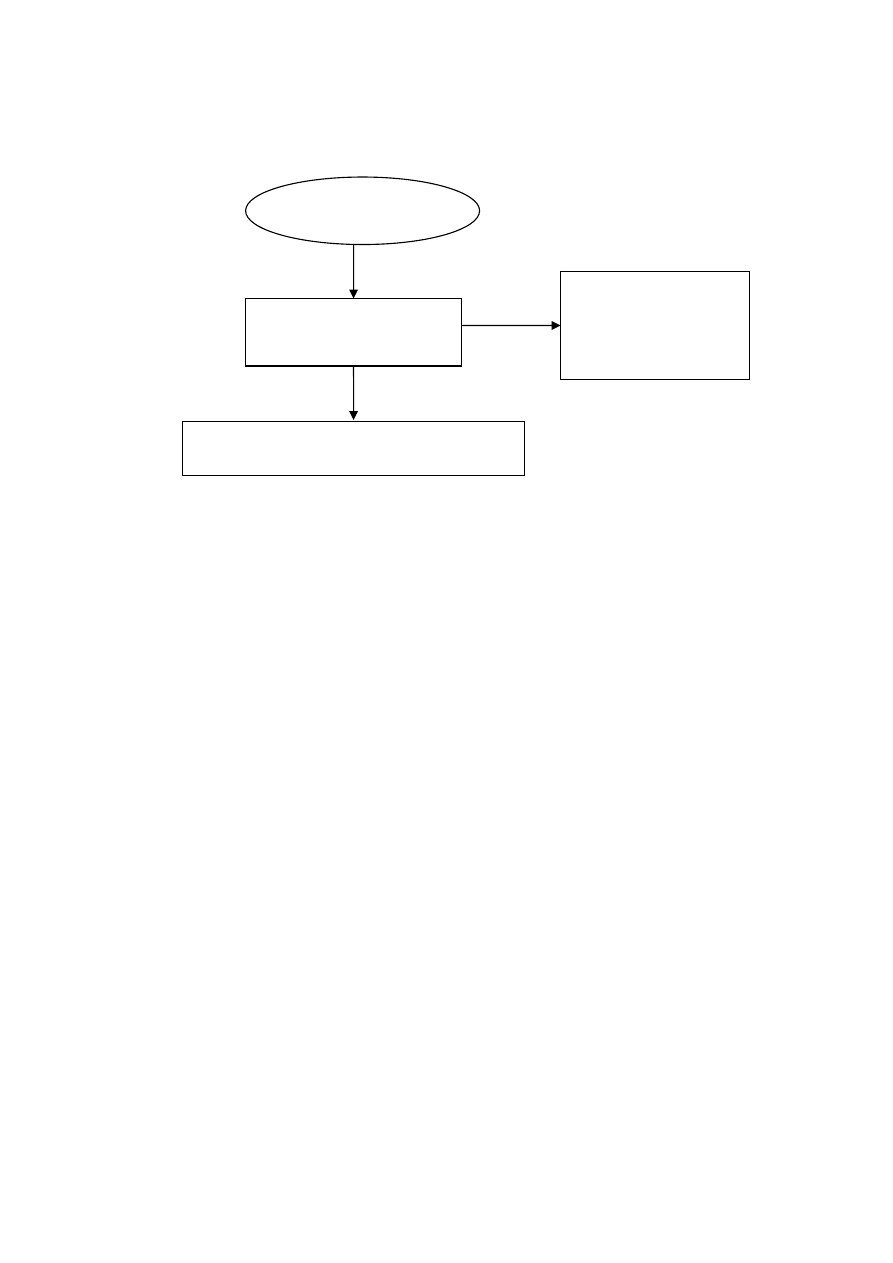
65
Figure 3.7 Flowchart Showing Ammonia Stripping Coupled MBR Process
3.8 Analytical Methods
The analyses performed were in accordance with the Standard Methods (APHA, et
al., 1998). Table 3.8 lists parameters and their analysis methods in this study.
Extraction of Extracellular Polymeric Substances (EPS)
The quantification of EPS in biomass was analyzed using thermal extraction method
(Chang and Lee, 1998). A measured volume of sludge solid was centrifuged in order to
subtract the soluble EPS at 3,200 rpm for 30 min from bound EPS. After collecting the
soluble EPS, the remaining pellet was resuspended with 0.9% NaCl solution before heating
at 80
o
C for 1 h. The extracted solution was separated from the sludge solids by
centrifugation at 3,200 rpm for 30 min. The obtained supernatant was the bound EPS. The
quantity of extracted EPS was measured by measuring total organic carbon (TOC),
proteins and carbohydrates.
Ammonia Stripping
Raw Leachate
Operating Conditions:
- pH
- Velocity Gradient
- Operation Time
Membrane Bioreactor using Bacterial and
Yeast Cultures

66
Table 3.8 Parameters and Their Analytical Methods
Parameter
Method of Analysis
Equipment Used
pH
pH meter
pH meter
DO
DO meter
DO meter
COD Dichromate
reflux Titration
BOD
Oxitop
Oxitop bottles
TOC Combustion
method
TOC
analyser
Pb
Flame atomic absorption
spectrometry
Atomic absorption spectrometry
Ammonia Distillation
Titration
Nitrite and Nitrate
Colorimetric UV-visible
spectrophotometer
TKN Macro-Kjeldahl Titration
Phosphate
Ascobic acid
UV-visible spectrophotometer
MLSS
Dried at 103-105
o
C Filter/Oven
MLVSS
Ignited at 550
o
C Furnace
TDS
Conductivity meter
Conductivity meter
Conductivity
Conductivity meter
Conductivity meter
MWCO
Membrane filtration
UF membrane module
SVI
Settle sludge volume
after 30 minutes
1000 ml cylinder
Viscosity
Rotating torque cylinder at 100
rpm
Viscometer
CST
Capillary time
CST apparatus
EPS
Thermal and
centrifugation method
Centrifugal equipment
Proteins Lowry
Spectrophotometer
Carbohydrates Phenolic-sulfuric
acid
Spectrophotometer

67
Chapter 4
Results and Discussion
4.1 Simulation of Leachate Characteristic for Treatment of Middle Aged Leachate
Leachate varies widely in quantity and in composition from one place to another
(Kennedy, et al., 1988). Such variability along with other factors make the applicability of
a method to treat leachate highly dependent on the characteristics of the leachate and
tolerance of the method against changes in leachate quality (Henry, et al., 1982). As
mentioned in section 2.13.1, it is difficult to predict the applicability of the leachate
treatment sequence with varying leachate quality. To overcome this problem, leachate with
a quality emulating the medium landfill leachate was simulated, and used in this
experimental work.
To arrive at the appropriate leachate quality to be taken for the study, a survey on the
medium aged leachate in Asian context is required. Table 2.3 gives the typical
characteristics of the middle aged landfill leachate. The medium-aged leachate contains
COD ranging of 5,000 to 10,000 mg/L and BOD/COD ratio of 0.1 to 0.5 (Qasim and
Chiang, 1994; Amokrane, et al., 1997). The medium landfill leachate is usually less
biodegradable than the young leachate. The high ammonium concentration of around 2,000
mg/L makes the medium aged leachate treatment even more complicated. The NH
4
+
-N is
dominant among the nitrogen forms making it an important parameter to be considered in
leachate treatment. Another important parameter taken into consideration is the alkalinity.
The alkalinity is also found to be high in leachate and significant in leachate treatment. As
the leachate is nutrient deficient in terms of phosphorus, and often phosphorous
supplement was added to enhance the leachate treatment. Based on the literature review, a
simulated leachate quality was used with BOD/COD ratio ranging from 0.35 to 0.45, COD
ranging from 7,000 to 9,000 mg/L, and total nitrogen ranging from 1,800 to 2,000 mg/L as
described in Table 3.1.
The leachate simulated for the study was prepared by combining the leachate
collected from Pathumthani Landfill Site (PS) and Ram-Indra Transfer Station (RIS).
Table B-1 of Appendix B gives the leachate quality of the two sites along with the mixed
leachate quality. The BOD/COD of the mixed leachate was found to be around 0.44-0.45.
Table 4.1 presents the consistency of the simulated leachate used in the study.
Table 4.1 Compositions of Leachate Simulated from Leachates Obtained from Pathum-
thani Landfill Site (PS) and Ram-Indra Transfer Station (RIS)
COD
(mg/L)
BOD
(mg/L)
BOD/COD
NH
3
-N
(mg/L)
TKN
(mg/L)
7,715
3,484 0.45 1,791 2,072
7,733
3,460 0.45 1,623 1,850
7,404
3,353 0.45 1,624 1,969
7,248
3,205 0.44 1,558 1,898

68
4.2 Biokinetic
Studies
Bio-kinetic experiments are important in any biological treatment systems. A
biological system consists of a mixture of organisms with different growth patterns and
degradation rates. The overall growth and degradation rate is important for the degradation
of the pollutants present in the waste. Therefore, bio-kinetic studies were conducted to get
an overall picture of the degradation potential and growth of the microorganisms used in
the degradation pattern.
4.2.1 Acclimatization of Mixed Yeast and Bacterial Sludge
Prior to the biokinetic study, it is necessary to acclimatize the organisms to the
prevailing toxic conditions of the leachate having high COD and ammonia concentrations
along with other humic organic components. After acclimatization of the culture to be used,
a rich mixture of resistant leachate degrading organisms could be obtained. In the present
experiment, bacterial and yeast culture were used to degrade the leachate in the membrane
bioreactors. Preceding acclimatization of the yeast culture, to obtain a wide range of the
yeast species, yeast was enriched using the standard enrichment technique. The enrichment
was completely accomplished once the yeast reached a MLSS concentration of 3,000 mg/L.
The acclimatization and the enrichment of the bacterial and yeast culture was done as
described in section 3.3.2. The pH of the yeast culture was maintained at around 3.5 as
yeast activity is pronounced at low pH and this would also help in preventing bacterial
contamination.
(1) Organic Removal
The acclimatization of the bacterial and yeast culture were done as described in
section 3.3.2 with the simulated medium-aged landfill leachate having characteristic given
in section 3.2 with variation in COD load, which was step-wise increased to finally obtain
an acclimatized culture. The operation conditions for the acclimatization process are
mentioned in the Table 3.2. The organic load while acclimatizing was step wise increased
from 3,800 to 7,300 for bacterial as well as yeast culture. The acclimatization was done
step-wise until a COD removal approximately 70% could be achieved. The changes in the
biomass concentration along with the F/M ratio and COD removal efficiencies were
noticed. These measured parameters are given in Table B-2 and B-3 of Appendix B.
Acclimatization of yeast and bacterial culture took about 67 days. The change in the
COD removal efficiency and the F/M ratio is given in Figure 4.1 and 4.2. It was found that
after 67 days, the COD removal efficiency with yeast culture was higher than that of
bacterial culture. The COD removal efficiency reached 75% in yeast sludge compared to
66% in the bacterial sludge. This indicates that, yeast culture could probably be more
effective in leachate treatment than the bacterial culture. However, as the results obtained
are not sufficient to conclude that yeast system has a better performance than bacteria
system, further investigation is necessary. F/M ratio decreased from 1.01 to 0.62 kg
COD/kg SS.d in the yeast culture and from 1.45 to 1.14 kg COD/kg SS.d in the bacterial
sludge. The difference between the F/M ratios in the bacterial culture was not as much as
the yeast culture. This suggests that the growth of the yeast culture was more prominent
than the bacterial culture. Lower the F/M ratio, the better is the leachate treatment capacity
of the system. This could be the reason for the better removal efficiency of COD by the
yeast culture.
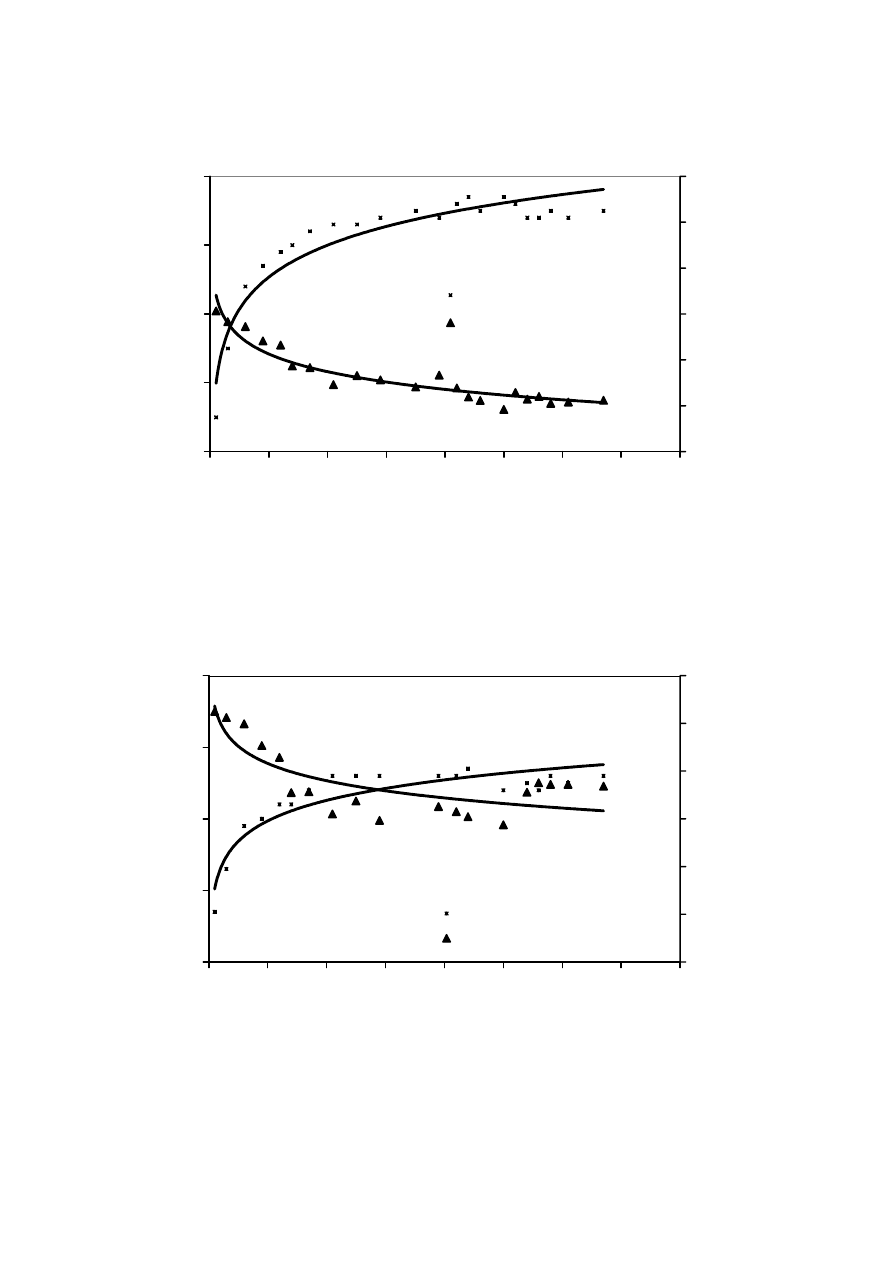
69
Figure 4.1 Variation in F/M and COD Removal Efficiency in Yeast Sludge
Figure 4.2 Variation in F/M and COD Removal Efficiency in Bacterial Sludge
40
50
60
70
80
0
10
20
30
40
50
60
70
80
Time (Days)
C
OD Rem
oval
Effeciency (%)
0.40
0.60
0.80
1.00
1.20
1.40
1.60
F/M (
kg
C
O
D
/k
g SS.d)
COD Removal Effeciency
F/M Ratio
40
50
60
70
80
0
10
20
30
40
50
60
70
80
Time (Days)
COD R
em
oval Effec
iency (%) .
0.40
0.60
0.80
1.00
1.20
1.40
1.60
F/M (
kgCO
D
/kg SS.d)
COD Removal Effeciency
F/M Ratio
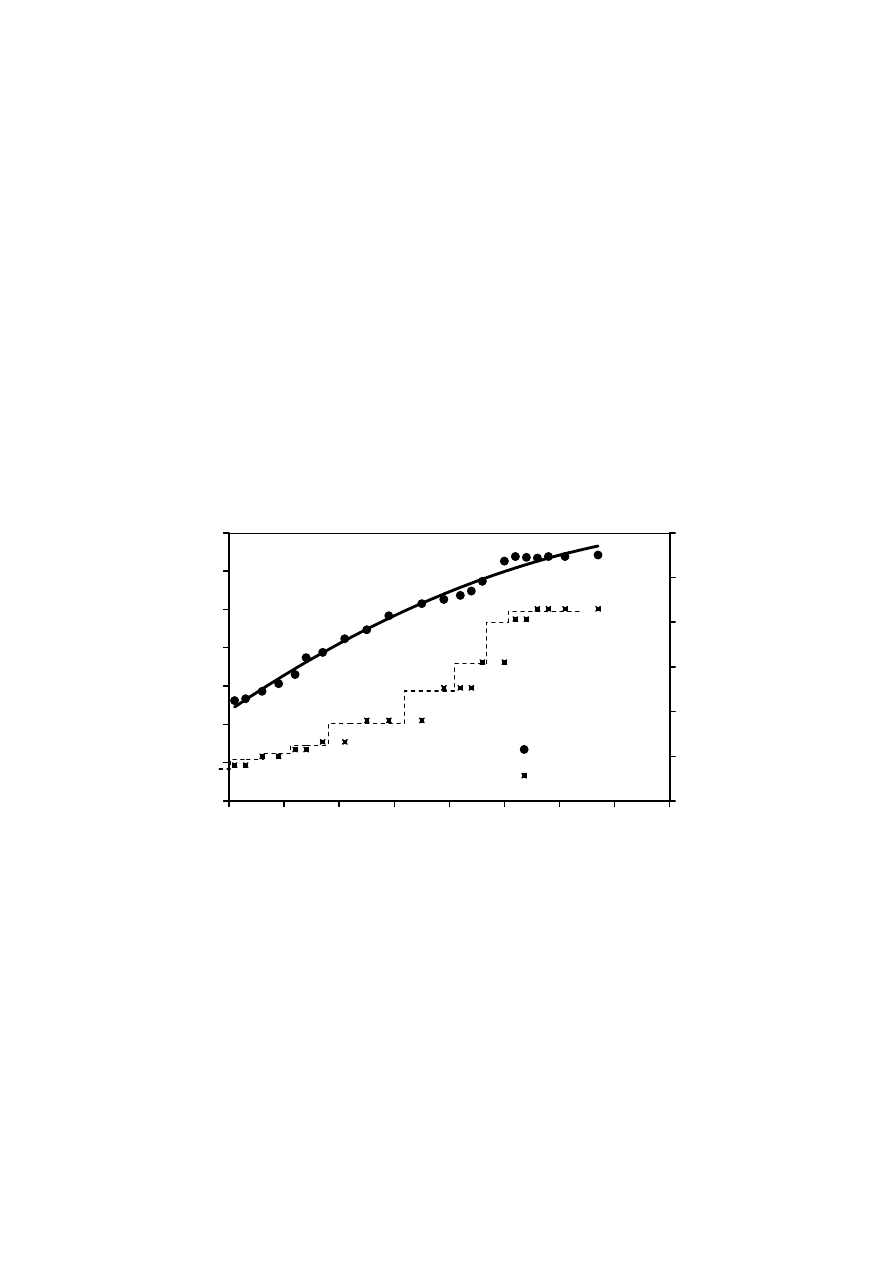
70
(2) Biomass
The growth of biomass is important for the treatment of the leachate. Sufficient
MLSS should be obtained in order to get a good COD removal efficiency. The change in
the biomass for the bacterial and the yeast culture when stepwise COD load was increased
is illustrated in the Figure 4.3 and 4.4. The initial MLSS of the yeast reactor was around
3,750 mg/L, while the bacterial initial sludge MLSS was 2,620 mg/L. The final MLSS of
yeast and bacteria after acclimatization were 11,700 and 6,420 mg/L, respectively. The
MLSS concentration maintained throughout the membrane bioreactor experiment was
about 10,000 mg/L for the yeast reactor and 5, 000 mg/L for the bacterial reactor. The final
MLSS in the yeast system was about 3.12 times the initial MLSS concentration which
shows a 21 % increase in the biomass. In the bacterial system, the final MLSS was 2.5
times initial biomass, which shows an increase of 14.5% in the biomass. Once the cultures
have been acclimatized with a final leachate concentration having COD of 7,300 mg/L
(approximately the initial concentration to be used in the bioreactors), the cultures was
used for the experimental studies.
Figure 4.3 Increase in Biomass during Acclimatization of the Bacterial Sludge
0
1000
2000
3000
4000
5000
6000
7000
0
10
20
30
40
50
60
70
80
Time (Days)
MLS
S
(mg/L
)
3000
4000
5000
6000
7000
8000
9000
Influent C
OD (mg
/L) .
MLSS
Influent COD
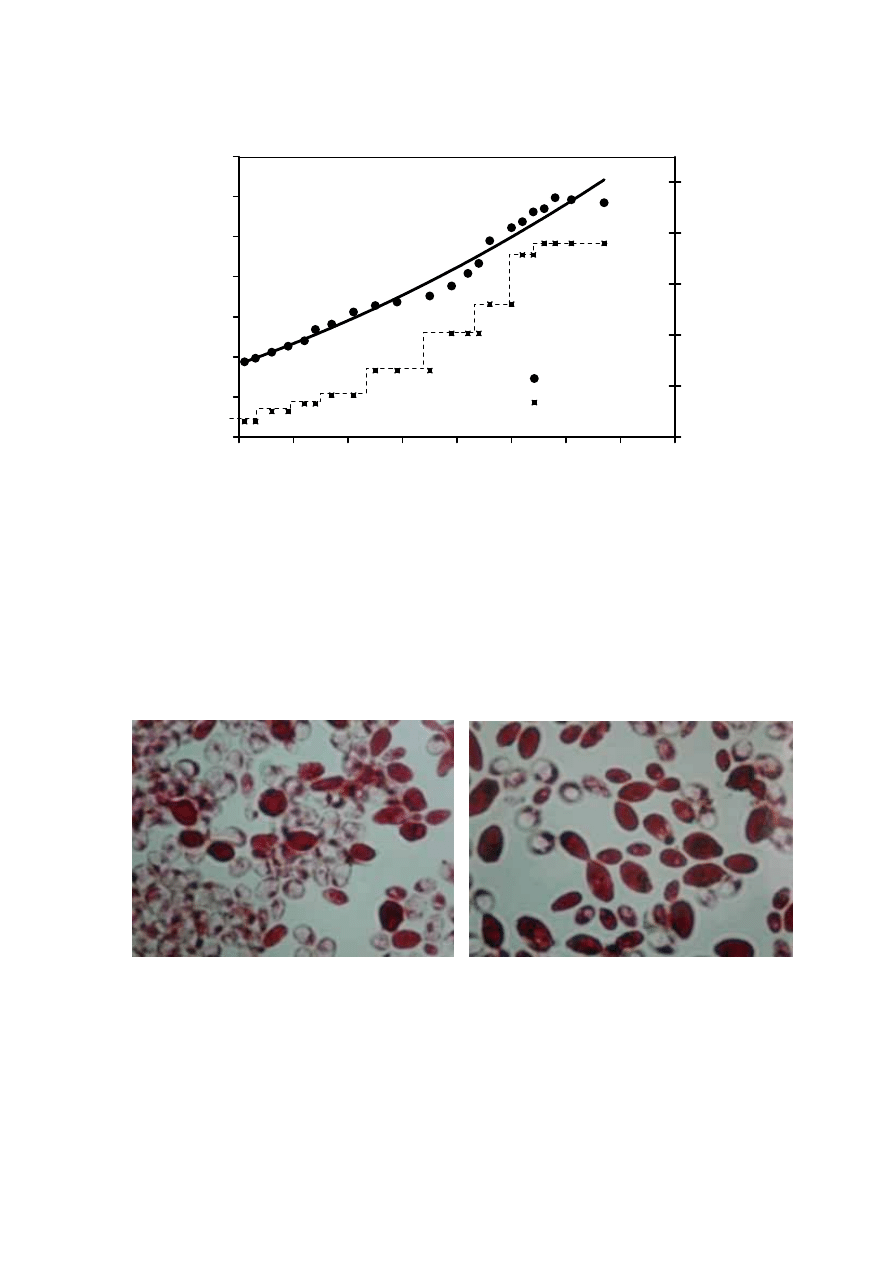
71
Figure 4.4 Increase in Biomass during Acclimatization of the Yeast Sludge
After the acclimatization process, the organisms were microscopically observed.
The Figure 4.5 and 4.6 show the yeast and the bacterial culture under the microscope. The
yeast cells contained egg-shaped and spherical cells. The bacterial culture was dominated
by the rod-shaped organisms containing both gram positive and gram negative organisms.
Figure 4.5 Predominantly Spherical and Egg-shaped Yeasts with Budding in the Yeast
Reactor (x1500)
0
2000
4000
6000
8000
10000
12000
14000
0
10
20
30
40
50
60
70
80
Time (Days)
MLSS (mg/L)
3500
4500
5500
6500
7500
8500
Influe
nt COD
(mg/L
)
MLSS
Influent COD
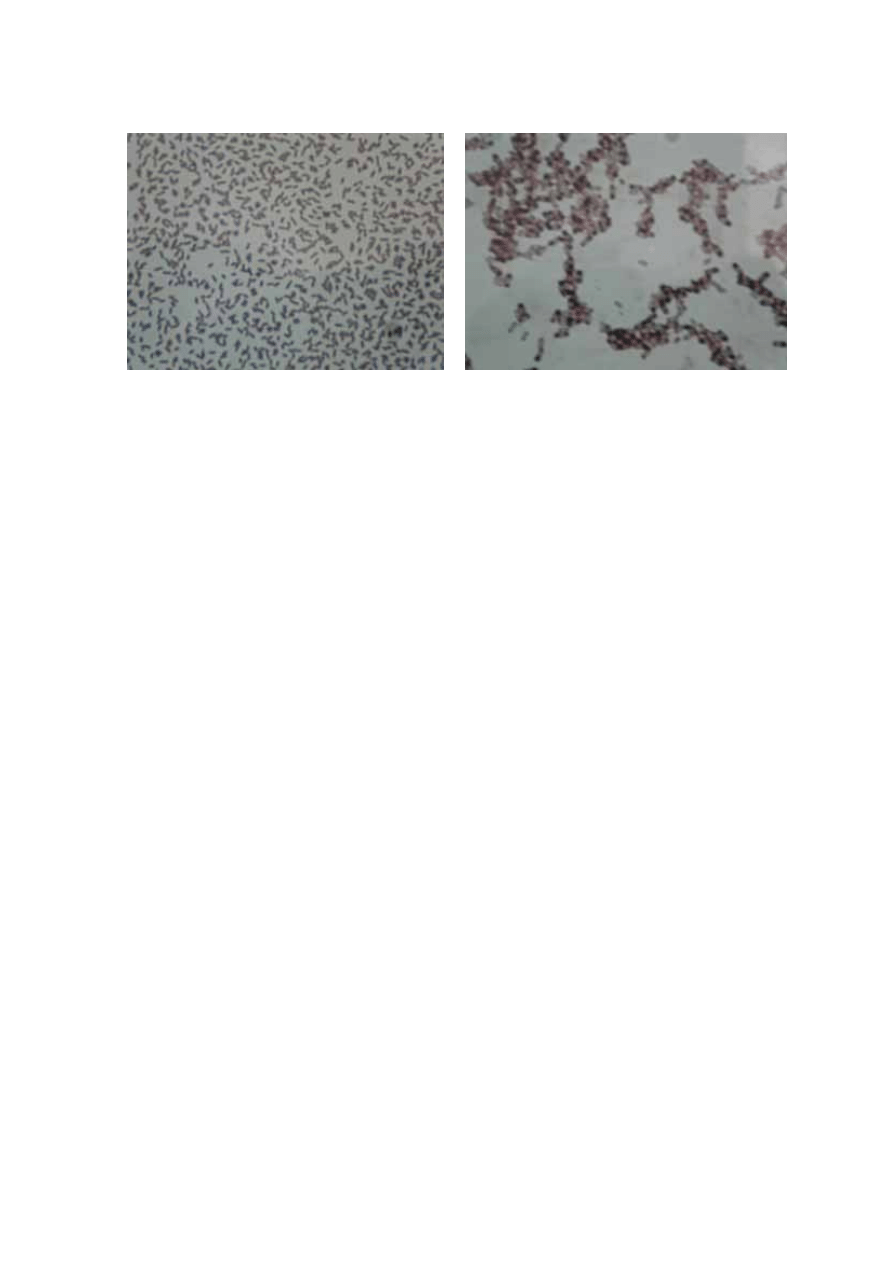
72
(a)
(b)
Figure 4.6 Bacteria Cells in the Mixed Bacteria Sludge: a) Gram Negative and b) Gram
Positive (x1500)
4.2.2 Kinetics of Yeast and Bacterial Growth
Optimum environmental conditions are important for the growth of the
microorganisms as well as the degradation of the organic components. To assess the
optimum conditions in the systems, it is necessary to monitor the growth of the
microorganisms. This could be achieved in several ways. Respiration (oxygen
consumption) is probably the most widely tested and accepted bacterial monitoring
technique (Cairns and Van Der Schalie, 1980). Normally, bacterial respiration results in a
certain decrease in oxygen concentration in the medium depending upon the retention time
of the chamber and temperature. This oxygen uptake by the organism can help us describe
the growth pattern of the microorganism. Reeves (1976) used the respirometer to record
the oxygen uptake in the activated sludge unit.
The Oxygen Uptake Rate (OUR) refers to the rate of oxygen consumption by
aerobic bacteria per unit time (Chen, et al., 1997). It is produced by the slope of the
relationship between the dissolved oxygen and the exposure time. By measuring the
oxygen uptake rate, one can indirectly obtain the specific growth rate of the
microorganisms as rate of the oxygen uptake is stoichiometrically related to the organic
utilization rate and the growth rate. The operation condition used in the biokinetic studies
in the bacterial and yeast reactor is described in Table 3.3. In the treatment process, the
substrate concentration and the limiting nutrients has an effect on the specific growth rate
of the microorganism. The effect of the substrate concentration in the bacterial and yeast
culture is given the Figure 4.7 and 4.8, respectively.
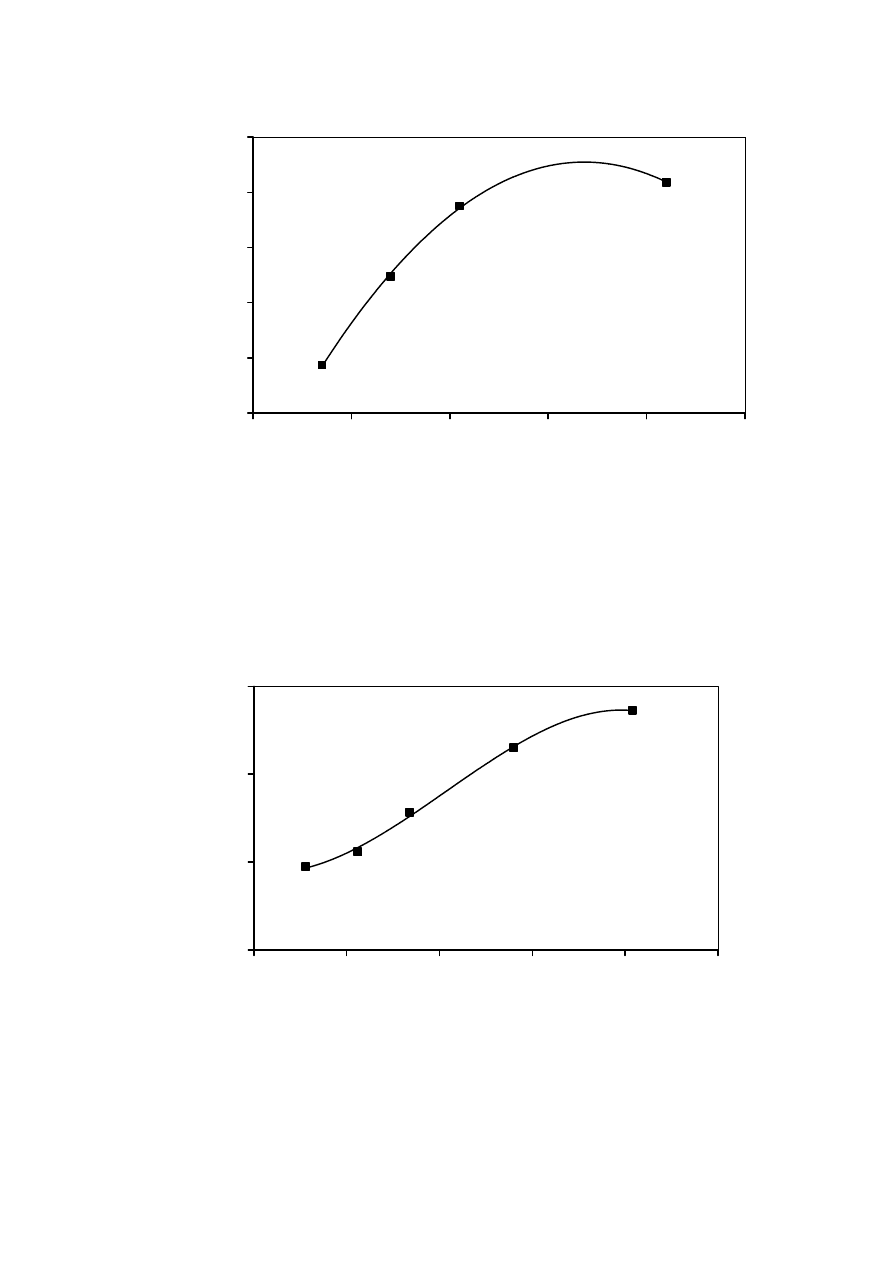
73
Figure 4.7 Specific Growth Rate of Mixed Bacteria Sludge with Increasing Substrate
Concentration
Figure 4.8 Specific Growth Rate of Mixed Yeast Sludge with Increasing Substrate
Concentration
0.00
0.10
0.20
0.30
0.40
0.50
0
10
20
30
40
50
Substrate (mg COD/L)
Spe
cific Growth Rate
( d
-1
)
0.00
0.10
0.20
0.30
0
10
20
30
40
50
Substrate (mg COD/L)
Sp
ecific Growth Rate
(d
-1
)
74
The various parameters concerned with biokinetic study of the bacterial and yeast
culture are given in Table C-1 and C-2 of Appendix C. The various biokinetic parameters
were measured using the Monad’s model. The substrate concentrations used in the
experiment from 5 to 40 mg/L and 7 to 42 mg/L with yeast and bacterial culture,
respectively. The rate of growth of the organisms in the bacterial culture was found to be
0.009 to 0.03 mg COD/mg VSS. h and 0.008 to 0.02 mg COD/mg VSS. h in the yeast
culture when the substrate concentration was gradually increased. The maximum yield
coefficient was 0.60 mg VSS/mg COD in the bacterial culture and 0.51 mg VSS/mg COD
in the yeast culture. The important parameters for yeast and bacteria sludge are presented
in Table 4.2. Additionally, estimation of the parameter group (µ
max
/(Y.K
s
)) is used as a
measure for comparing the biodegradation kinetics, as suggested by Grady, et al. (1999).
Comparison of the biokinetic parameters for both yeast and bacteria sludge treating
leachate illustrates that the maximum specific growth rate (µ
max
) and the substrate
utilization rate (k) were determined to be less than the typical values for domestic
wastewater whereas Y value was in the range of domestic wastewater. There is a case that
the µ
max
and Y values are higher than usual. This might be noted that the µ
max
and Y values
are not always indicated the biodegradability because there are other factors that control
the biodegradation kinetics such as enzyme activity and substrate concentration. The yield
coefficient might be high and yet the enzyme activity might be low, resulting in slow
degradation rate. Sometimes the degradation rate might be dependent upon substrate
concentrations. Moreover, the parameter group (µ
max
/(Y.K
s
)) of yeast and bacteria is 1.77 x
10
-3
and 3.06 x 10
-3
L/mg.h, respectively, indicating that the biodegradation of organics by
yeast is less than that of bacteria. Comparison of biokinetic parameters with the other
leachate case studies and the domestic wastewater is expressed in Table 4.2.
Table 4.2 Biokinetic Coefficients of Yeast and Bacteria Sludge for the Leachates
Biokinetic parameters
Type of
Sludge
µ
max
(d
-1
)
Y
(mgVSS/mgCOD)
k
(d
-1
)
µ
max
/Y.K
s
(L/mg.h)
Reference
Yeast sludge
0.27
0.49
0.51
1.77 x 10
-3
Present study
0.42
0.52
0.81
3.06 x 10
-3
Present study
0.30
0.45
0.39
0.63
0.77
0.71
1.57 x 10
-3
1.00 x 10
-3
Zapf-Gilje and
Mavinic, 1981
0.23
0.50
0.46
1.06 x 10
-4
Gaudy,
et al.,
1986
8.16
0.12
0.85
0.67
9.6
0.18
2.8 x 10
-4
0.4 x 10
-4
Pirbazari, et al.,
1996
Bacteria
sludge
0.56
0.36
1.56
1.06 x 10
-4
Chae,
et al.,
1999
Domestic
wastewater
6.00 0.60
(0.4-0.8)
2-10
2.08 x 10
-2
Grady, et al.,
1999
In both cases, the maximum specific growth rate (µ
max
) was found to be less than the
domestic wastewater. This could be the type of organisms prevailing in the domestic
wastewater is different from that of the leachate. Though the maximum specific rate
differed from that of the domestic wastewater, the yield coefficient of both yeast and
bacteria sludge were found to be in the same range as domestic wastewater, while the
substrate utilization rate was lower than that of domestic wastewater. This might be due to

75
change in the predominant species while carbon assimilation metabolism with different
substrates.
The yield depends upon the oxidation state of the carbon sources and nutrient
elements, degree of polymerization of the substrate, pathway of metabolism, growth rate
and other physical parameters of cultivation (Tchobanoglous, et al., 2003). The maximum
yield coefficient of the bacterial culture was found to be greater than that of the yeast
culture signifies that bacterial growth is more pronounced than that of the yeast culture.
This is further supported by the evidence that the specific growth rate of the bacterial
culture was 0.42 d
-1
compared to that of 0.27 d
-1
of the yeast culture.
The growth rate of the bacterial culture was almost 1.53 times the yeast culture at a
maximum substrate concentration of around 40 mg/L COD. Such an observation is in
accordance with the biokinetic studies conducted by Dan (2002) in high saline wastewater,
where the yeast culture showed a lower yield coefficient and specific growth rate in the
yeast system compared to that of the bacterial system.
4.2.3 Toxicity Studies
In addition to many organic and inorganic compounds that are present in the landfill
leachate, the presence of toxic substances also persists. These toxic compounds not only
pose harm to the environment when released but also affect the efficiency of the biological
treatment system. These metals affect the performance of the bioreactors by inhibiting the
bacterial growth. Oxygen consumption in a biological system has been monitored in
several studies to monitor the toxicity of the wastewater from several sources (Solyom, et
al., 1976; Solyom, 1977). For an aerobic organism, toxicity test could be measured by
measuring the oxygen uptake rate (OUR) in presence of the toxicant, which will signify the
inhibitory effect of the toxicant on the microorganism (Chen, et al., 1997).
(1) Ammonia Toxicity
The ammonium concentration in the leachate is usually found to be very high. As
mentioned by Keenan, et al. (1984), the high concentration of ammonia is a challenge for
the biological treatment of leachate as it may brings about toxicity to the organisms. For
better understanding of the effect of the ammonia concentration on the growth of the
organisms used in the present study, toxicity test was done with ammonium chloride as the
source of ammonia. The operational parameters for the toxicity test are described in Table
3.3. The procedure of toxicity test is described in section 3.4.1. The ammonium chloride
concentration used in the study were 70, 1000, 1500 and 2000 mg/L. The substrate
concentration used in the study was 7 mg COD/L for the bacterial system and 5.6 mg
COD/L for the yeast system.
An aerobic biological process contains two major classes of aerobic microorganisms,
namely nitrifying bacteria and heterotrophic bacteria. The heterotrophs represent the
microorganisms responsible for carbonaceous removal. Nitrifying bacteria (Nitrosomonas
and Nitrobactor) are responsible for the oxidation of ammonia to nitrite and nitrate
nitrogen. The optimum pH is 7.5 to 8.6 for Nitrosomonas and 6.0 to 8.0 for Nitrobactor.
The range of free ammonia concentration affecting to Nitrosomonas had been investigated
by some researcher is around 7 to 150 mg/L and Nitrobactor is around 0.1 to 1.0 mg/L
(Barnes, 1983; Abeling and Seyfried, 1992). It was observed by Blum and Speece (1992)

76
that the nitrifying bacteria are more sensitively inhibited by a given concentration of
chemical toxicant than the heterotrophic bacteria. Thus, failure of the nitrifying process
would occur before the carbonaceous removal process. Blum and Speece (1992) also
reported that Nitrobactor exhibited approximately the same toxicity as aerobic
heterotrophs. Thus, to prevent the interference of the nitrifying system in the toxicity test,
70 mg/L of Nitrogen as NH
3
-N was added to suppress nitrification (Liebeskind, 1999) in
the bacterial system.
The major biokinetic parameters found in the two systems namely, the bacterial and
yeast sludge are expressed in Table 4.3 and 4.4, respectively. The concentration of free
ammonia produced in the system was also measured using a dissociation equation of
ammonium salt into ammonia and hydrogen ion (Ortiz, et al., 1997). The formulae used for
measuring the free ammonia in given below:
[NH
3
-N] = 17 [NH
4
+
-N] 10
pH
Eq. 4.1
14
exp [ 6344 / ( 273 + T ) ] + 10
pH
The inhibition was found to be much higher in the bacterial sludge than that of the
yeast sludge. The probable reason for this could be the low oxygen uptake of 0.0030 mg
O
2
/mg VSS. h compared to that 0.0078 mg O
2
/mg VSS. h of the bacterial culture even at
an ammonium chloride concentration of 70 mg/L. The complete biokinetic parameters
measured for the yeast and bacterial system are presented in Table C-3 and C-4 of
Appendix C. The free ammonia nitrogen concentration in the bacterial sludge was found to
reach a maximum of 20 mg/L whereas that found in yeast sludge was 0.013 mg/L. It has
been found that the ammonia concentration of 31 to 49 mg/L can cause toxicity (Cheung,
et al., 1997) and at a concentration of 200 mg/L can adversely affects the sludge properties
(Robinson and Maris, 1985). The toxicity of the compound also depends upon the nature
and the composition of the waste. This could be the reason for relatively high toxicity of
the ammonia in the landfill leachate. In a yeast based biological system, it was found that a
free ammonia concentration of 11 mg/L would inhibit the growth of Candida utilis where
the ammonium nitrogen concentration was 350- 520 mg/L (Ortiz, et al., 1997). Relatively
low toxicity in the leachate studies could be attributed to the low pH.
Table 4.3 Effect of Free Ammonia Concentration on Yield Coefficient and the Specific
Growth Rate of the Bacterial Sludge
NH
4
Cl
(mg NH
4
-N/L)
Free NH
3
(mg NH
3
-N/L)
Y
(mg VSS/mg COD)
µ
(d
-1
)
70 0.44-0.70 0.39 0.093
1000 6.36-10.05 0.38
0.055
1500 9.54-15.07 0.35
0.046
2000 12.72-20.10 0.29
0.031
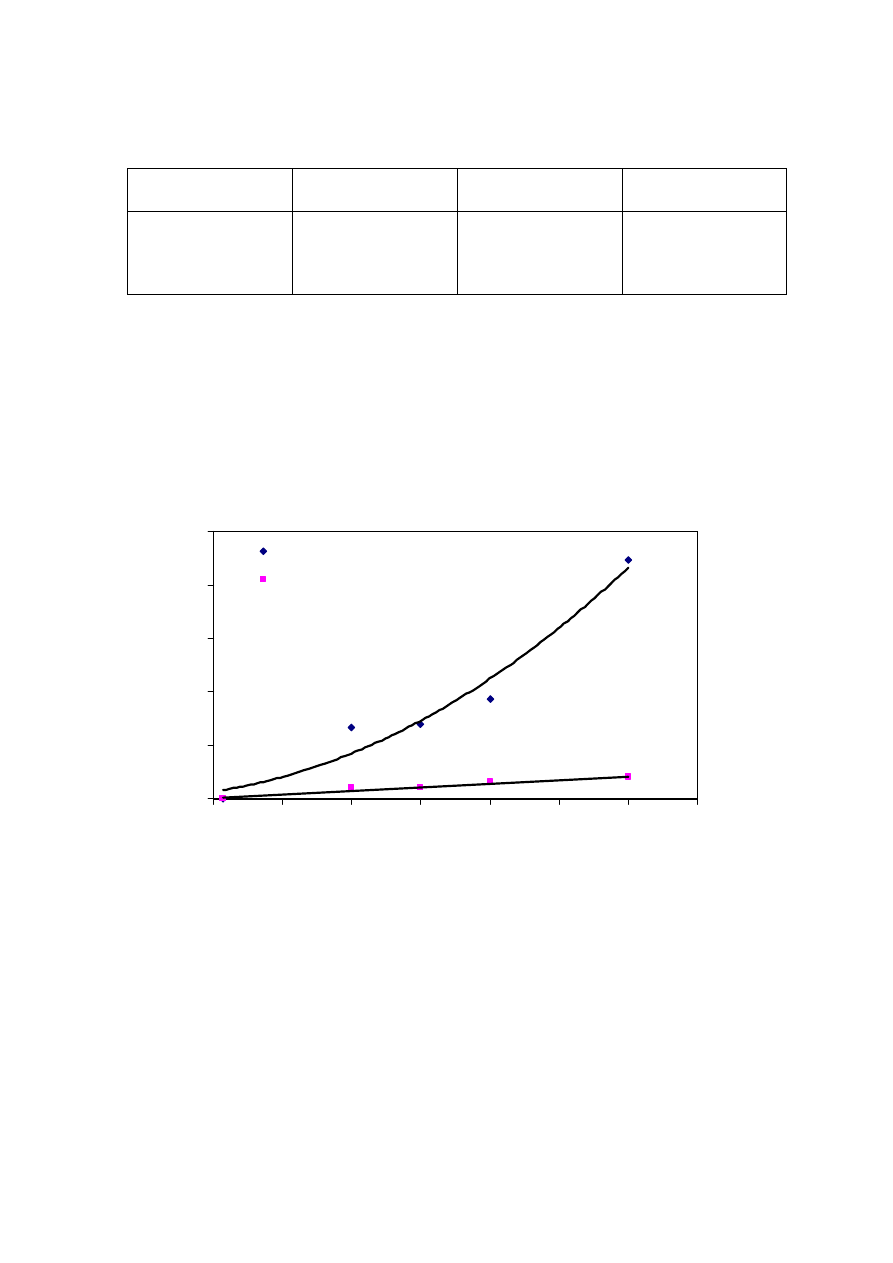
77
Table 4.4 Effect of Free Ammonia Concentration on Yield Coefficient and the Specific
Growth Rate of the Yeast Sludge
NH
4
Cl
(mg NH
4
-N/L)
Free NH
3
(mg NH
3
-N/L)
Y
(mg VSS/mg COD)
µ
(d
-1
)
70 0 0.50
0.095
1000 0.003-0.006 0.49
0.089
1500 0.005-0.010 0.48
0.087
2000 0.006-0.013 0.49
0.090
The inhibition of the bacterial and the yeast culture with increasing concentration is
expressed in Figure 4.9. The inhibition of the bacterial culture increased from 27 to 37%
with corresponding increase in ammonium chloride concentration from 1,000 to 2,000
mg/L. The inhibition of the yeast culture was found to be around 6% even at an ammonium
chloride concentration of 2,000 mg/L.
Figure 4.9 Inhibition of the Yeast and Bacterial Culture with Increasing Ammonium
Chloride Concentration
Another reason that would contribute to the resistance of the yeast sludge to the
ammonia toxicity could be the ammonium and free ammonia concentration. It is well
known that the molecular ammonia is toxic but not the ammonium ion. The relationship
between the ammonium ion and ammonia is pH dependent. The ammonium ion in the
wastewater is usually is in equilibrium with the ammonia and hydrogen ion concentration.
The equation of which is expressed as follows:
R
2
= 0.9546
R
2
= 0.9592
0
20
40
60
80
100
0
500
1000
1500
2000
2500
3000
3500
NH
4
Cl Concentration (mg/L)
%
I
nhi
bi
tio
n
Mixed bacteria
Mixed yeast

78
NH
3
+ H
+
NH
4
+
At low pH, when H
+
is high, the equilibrium shifts towards the right direction. This
results in low ammonia concentration. The low percentage inhibition in the yeast system
could be attributed to this, as the operation pH of the yeast system is around 3.5 to 3.8
compared to 6.8 to 7.0 in the bacterial sludge.
Though, the ammonia concentration did not affect the yeast sludge much, it was
found to inhibit the microbial growth in the bacterial system. As the ammonium is present
in high concentration in the leachate, leaching becomes necessary prior to further
biological treatment. Thus, ammonia stripping was done to ensure better efficiency of the
biological system and prevent the inhibition of the toxic compounds to the organisms.
(2) Lead Toxicity
Many researches have shown the presence of toxic compounds in many landfill
leachate (Brown and Donnelly, 1988; Baun, et al., 1999). Other studies have shown that
leachate from a municipal solid waste landfill can be more toxic than the leachate from the
hazardous waste landfill (Brown and Donnelly, 1988; Schrab, et al., 1993; Clement, et al.,
1996). Even though large scale disposal of hazardous toxic metals is no longer practiced,
but small generators such as small businesses and households do continue to dispose
hazardous chemicals in the municipal landfills (Brown and Donnelly, 1988). One of such
compounds is the lead, which is present in the landfill leachate. The source of lead is
probably from plumbing fixtures in the individual homes and other lead-containing
products (such as leaded solder, battery, glass, PVC, and small lead items) which are
disposed of as waste.
Though, lead is found at a concentration lower than 1 mg/L (Chian and DeWalle,
1976; Ehrig, 1983; Keenan, et al., 1984; Robinson and Maris, 1985; Robinson, 1992), an
increased concentration of the lead can pose failure of the biological systems. To find out
the effect of the increasing lead concentration on the activated sludge, toxicity studies was
done with it using lead nitrate as a lead source. The lead nitrate in the bacterial system was
varied from 20-100 mg/L compared to 2-25 mg/L in the yeast system. The lead nitrate used
in the yeast system was lower than that of the bacterial system due to the reason that at
lower pH, lead would easily dissociate as a free ion (Cui, et al., 2000). The lead toxicity
was done as described in section 3.4.2. The biokinetic parameters for the lead toxicity
studies in bacteria and yeast leachate is given in Table C-5 and C-6 of Appendices C. The
substrate concentration in the study was similar to that of the ammonia toxicity study.
The substrate utilization by the yeast and bacterial sludge is presented in Table 4.5. It
is found that the substrate utilization of the bacterial system is higher than that of yeast
sludge. As the soluble lead concentration increased from 0 to 10.98 mg/L, the oxygen
utilization rate decreased from 0.519 mg O
2
/mg VSS.h to 0.075 mg O
2
/mg VSS.h. The
percentage inhibition at high concentration was found to be 85%. The inhibition effects of
the lead on the bacterial and yeast system is expressed in Figure 4.10 and 4.11, respectively.
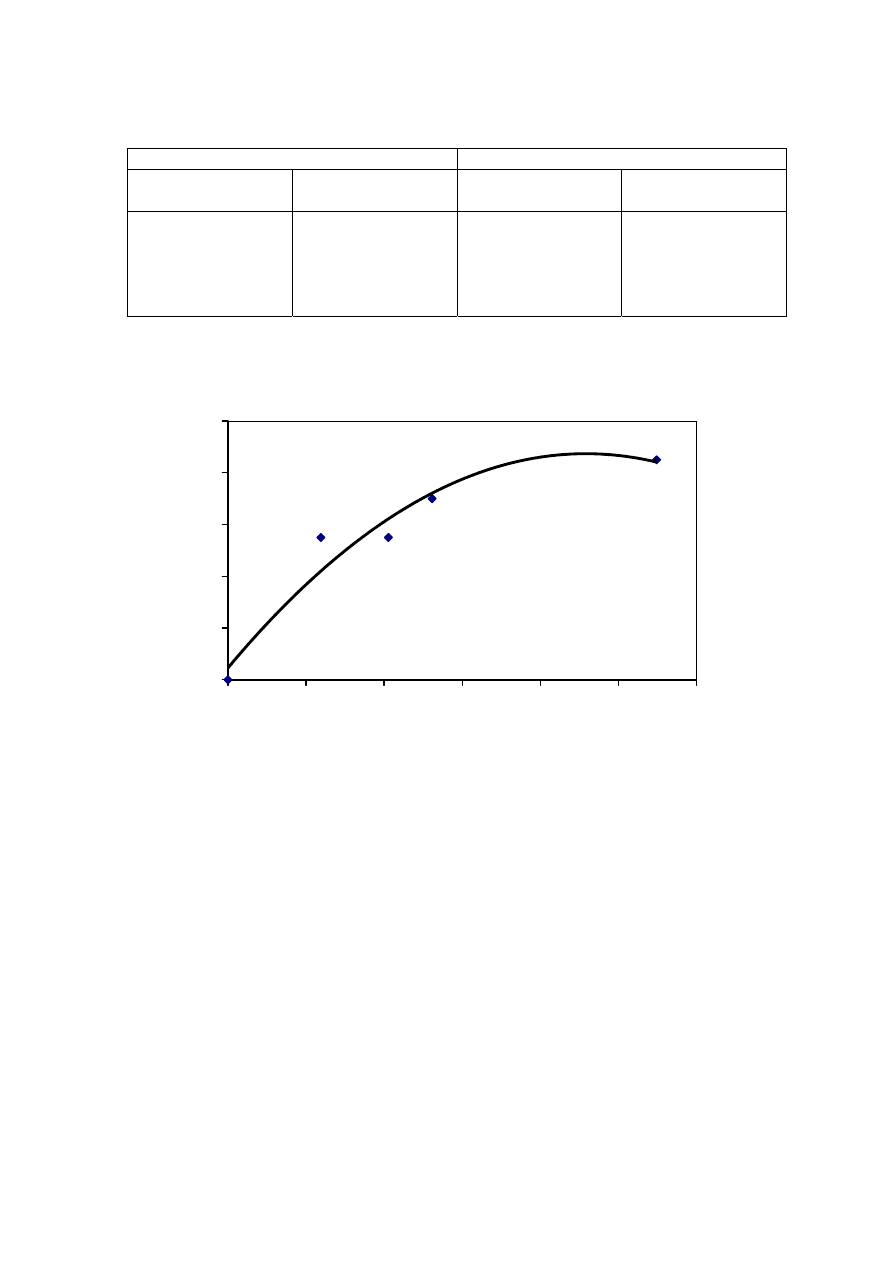
79
Table 4.5 Substrate Utilization by the Yeast and Bacterial Sludge
Bacteria Yeast
Soluble Pb in
Sample (mg/L)
Oxygen Utilization
(mg O
2
/mg VSS.h)
Soluble Pb in
Sample (mg/L)
Oxygen Utilization
(mg O
2
/mg VSS.h)
0.00 0.519 0.00 0.071
2.38 0.233 1.15 0.042
4.11 0.233 1.41 0.042
5.23 0.158 1.98 0.032
10.98 0.075 2.10 0.017
Figure 4.10 Inhibitory Effect of Lead in Bacterial Sludge
The soluble lead concentration in the yeast culture was from 0 to 2.10 mg/L
concentration. The oxygen utilization rate of the yeast sludge decreased from 0.071 to
0.017 mg O
2
/mg VSS.h. The inhibition of the yeast system was 76% at a soluble lead
concentration of 2.10 mg/L. The percentage of inhibition of yeast sludge was comparable
to that of the bacterial sludge. The soluble lead concentration of 2.38 mg/L in the bacterial
system showed 55% inhibition. In the yeast system, 50% inhibition occurred at a soluble
lead concentration of 1.50 mg/L. The toxicity effect is close to that reported by Cui, et al.
(2000), where it is said that toxicity effect on yeast occurs at concentration of 1 mg/L.
0
20
40
60
80
100
0
2
4
6
8
10
12
Concentration of Soluble Lead (mg/L)
% Inhibition .
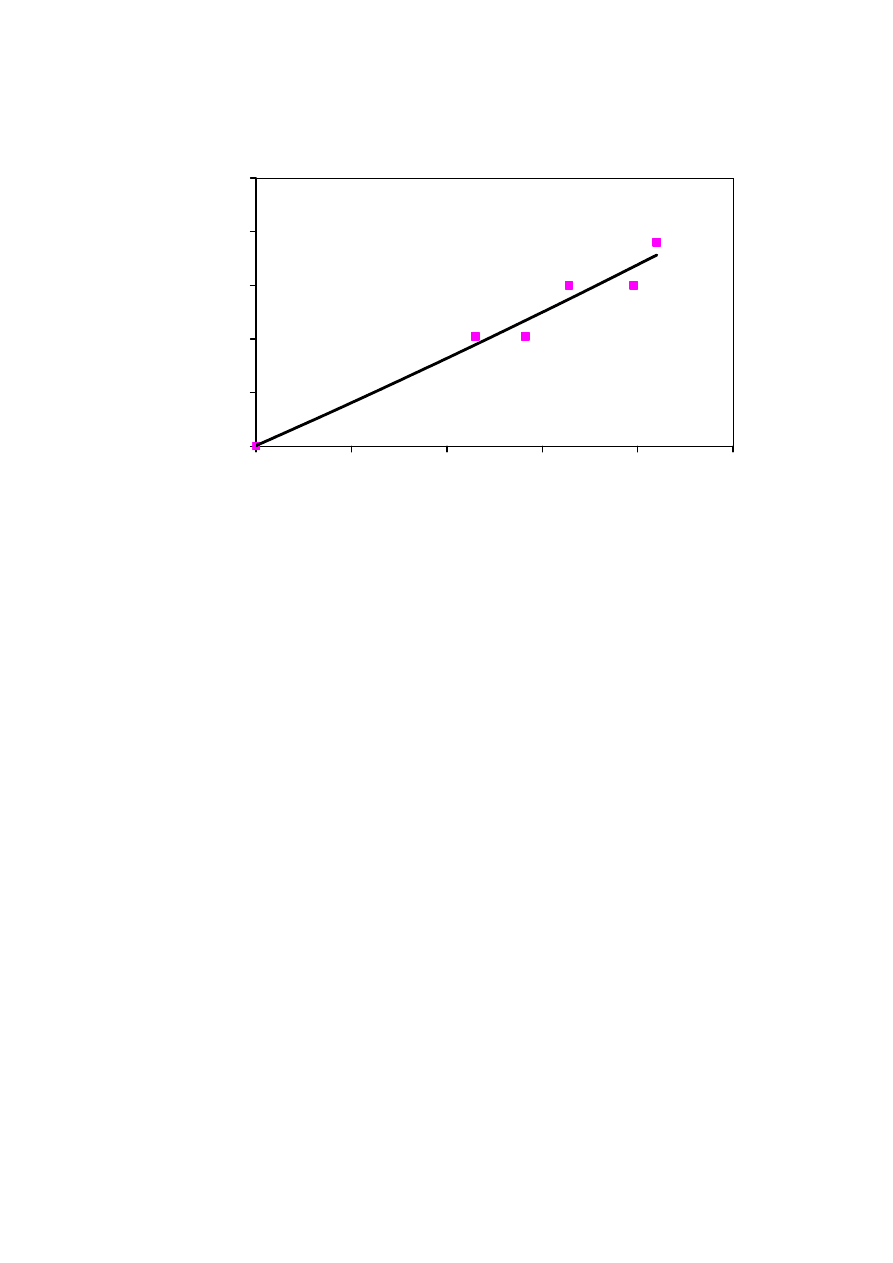
80
Figure 4.11 Inhibition Effect of Lead in Yeast Sludge
In the bacterial system, 50% inhibition occurred at a concentration approximately 3
mg/L. The toxicity effects to both marine and freshwater invertebrates have been recorded
at the concentrations range between 0.5 and 5.0 mg/L (Oladimeji and Offem, 1989),
whereas it was between 2 and 6 mg/L for the activated sludge process (Madoni, et al.,
1996). Madoni, et al. (1999) also found that the microbial activity in an activated sludge
plant treating wastewater containing 3.5 to 9.2 mg/L of soluble lead could be adversely
affected. The higher concentrations of soluble lead applied in the experiments point out the
higher resilience of bacteria in the presence of lead.
4.3 Application of Yeast and Bacteria Based Membrane Bioreactors in Leachate
Treatment
Landfill leachate treatment is a complex task due to the highly variable waste
landfilled, the type and design of the landfill, landfill age and climatic and seasonal
variations in different regions. Hence, rather than recommending treatment options based
on specific factors, it would be necessary to consider landfill age as a unique case.
Medium-aged landfill leachate is characterized by a high COD and ammonia content with
a relatively lower BOD. Leachate treatment systems in recent years are sophisticated,
reliable and are able to consistently treat leachate to keep up the specific discharge
standards (Robinson, 1999). One such treatment technique is the membrane bioreactors.
Membrane reactor in recent years has been proved to be effective and economically
feasible for treatment of various kinds of toxic wastewaters. Moreover, industrial
utilization of the MBR has worked successfully for treating complex wastes like landfill
leachates and cosmetic wastewaters (Manem, 1993; Mandra, et al., 1995). In the present
study, initially performance of the membrane bioreactors have been evaluated without any
pre-treatment based on various factors such as removal efficiency of TKN and COD,
membrane fouling, etc.
0
20
40
60
80
100
0.0
0.5
1.0
1.5
2.0
2.5
Concentration of Soluble Lead (mg/L)
% Inhibition .
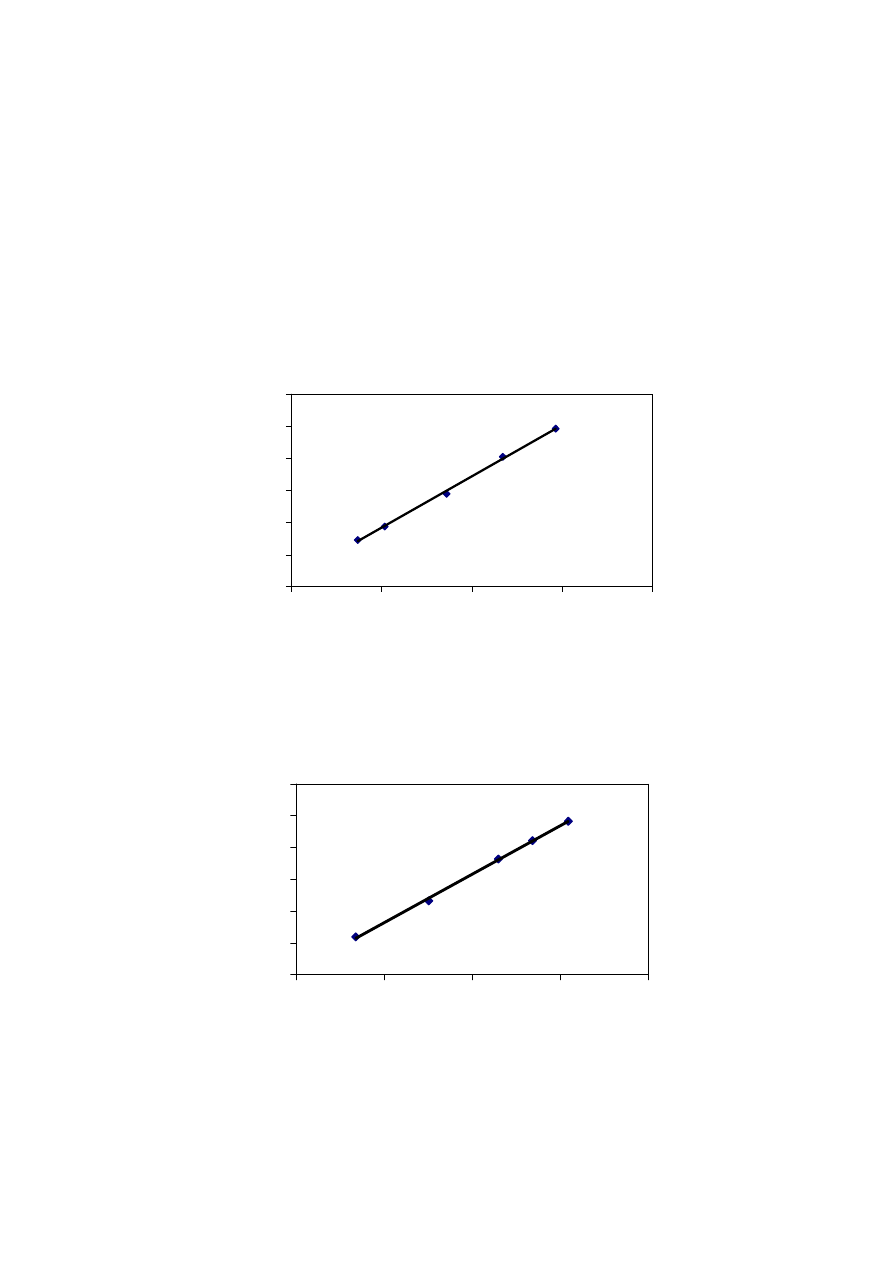
81
4.3.1 Initial Membrane Resistance
Prior to starting up the experiment, it is necessary to measure the membrane
resistance to understand the filtration capacity of the membrane and the change in the
resistance after fouling. The linear flux variation along with the applied pressure was
obtained by varying the flow rate. The detailed experimental data is presented in Table D-1
and D-2 of Appendix D for the bacterial based membrane bioreactor (BMBR) and yeast
based membrane bioreactor (YMBR), respectively. The graph showing linear flux of the
membrane reactors are represented in Figure 4.12. Membrane permeate flux was measured
by weighing permeate with the electronic balance. Initial membrane resistance was
determined from the relationship between flux and applied pressure as follows:
Figure 4.12 Variation in Transmembrane Pressure with Permeate Flux (a) YMBR and
(b) BMBR
y = 0.1609x + 1.0378
R
2
= 0.9984
0
5
10
15
20
25
30
0
50
100
150
200
Flux (L/m
2
.h)
P
re
ss
ure
(k
P
a)
(a)
y = 0.1521x + 0.5234
R
2
= 0.9988
0
5
10
15
20
25
30
0
50
100
150
200
Flux (L/m
2
.h)
Pressu
re (kPa
)
(b)

82
J = ∆P Eq. 4.2
µR
t
Where;
J = Permeate flux (L/m
2
.h)
∆P
= Applied pressure (kPa)
µ = Dynamic viscosity (N.s/m
2
)
R
t
= Total resistance for filtration or Hydraulic resistance of clean
membrane (m
-1
)
The membrane resistance (R
m
) of the YMBR was found to be 6.66 x 10
11
m
-1
and
that of BMBR was found to be 6.29 x 10
11
m
-1
. The membrane used in the study had a
surface area of 0.42 m
2
and pore size of 0.1 µm. Both the membranes had a similar pore
size and almost the same membrane resistance. The membrane resistant is important as
with increasing membrane operation, the membrane resistance tends to increase the
transmembrane pressure, which after a certain limit decreases the flux to a great extent.
During this stage when the transmembrane pressure reaches a maximum, the membrane is
said to be fouled. The effect of the membrane resistance prior to and after fouling has also
been studied which would be discussed in later part of this chapter.
4.3.2 Optimization of HRT in Terms of Membrane Bioreactor Treatment Efficiency
(1) COD Removal Efficiency
The influent COD concentration was maintained around 7,000 to 9,000 mg/L, and
the volumetric loading rate was gradually increased from 6.7 to 17.9 kg COD/m
3
.d by
decreasing HRT from 24 h to 12 h with 4 h decrement. A detailed tabulation of the results
is given in Table E-1 and E-2 of Appendix E for the BMBR and YMBR systems,
respectively. The increase in organic loading in terms of COD concentration and change in
HRT is presented in Figure 4.13. As a real leachate from the transfer station and sanitary
landfill was used, fluctuations in the feed could not be avoided. In all experimental runs,
the MLSS of both the systems were maintained around 10,000 to 12,000 mg/L and DO
concentration of above 2.0 mg/L. Figure 4.14 and 4.15 illustrates the MLSS concentration
and pH, respectively in both the membrane bioreactors. The fluctuations in the pH of the
BMBR reactor could be due to the products if the degradation taking place within the
system.
While treating the medium-aged landfill with membrane bioreactors, the effluent
COD concentration fluctuated with that of the influent concentration. The influent and
effluent COD concentration in the BMBR and YMBR are presented in Figure 4.16. It was
observed that the average COD removal efficiency of the YMBR was slightly higher than
that of the BMBR for varied HRT, though the difference was just marginal. The reason for
the increased run period at 16h HRT was the absence of significant improvement in the
treatment performance in terms of COD removal. In a study conducted by Sun, et al., 2002
found similar results. When an influent wastewater with 2,400 mg/L COD was treated
using a submerged MBR, it was found that a change in HRT from 3 to 6 days did not
significantly affect the performance. The removal efficiency just changed from 92 to 93%.
A high COD removal of the high strength wastewater could be due to the increased HRT
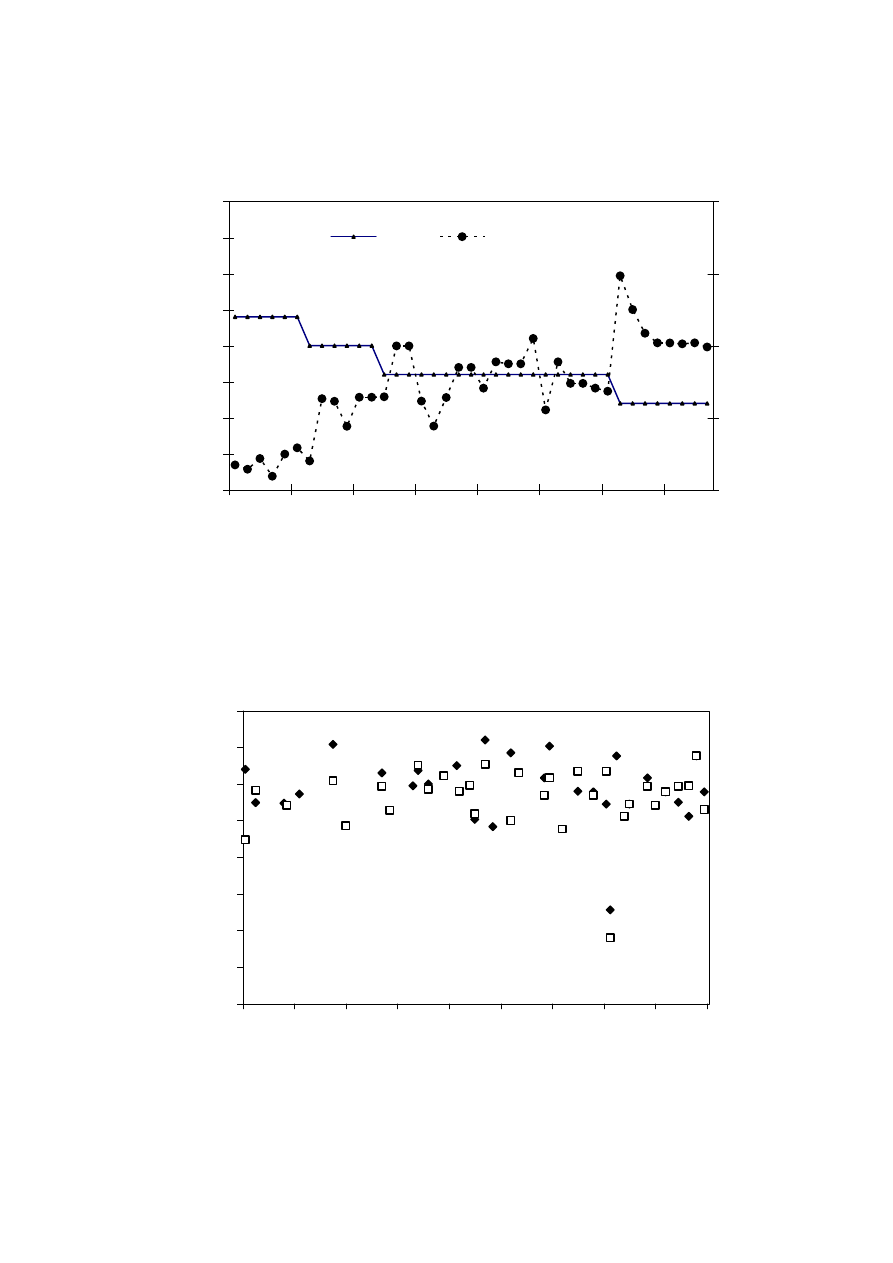
83
when compared with the present study. Figure 4.17 shows the efficiency of COD removal
for both YMBR and BMBR systems for various HRT throughout the run period.
Figure 4.13 Variation in Organic Load with HRT
Figure 4.14 Variation in MLSS in the MBR Systems
0
5
10
15
20
25
30
35
40
1
22
48
72
94
119
145
173
Time (days)
HRT (h)
6
10
14
18
22
COD O
rganic Lo
ad (kg/m
3
.d)
HRT
Organic Load
0
2000
4000
6000
8000
10000
12000
14000
16000
0
20
40
60
80
100
120
140
160
180
Time (days)
MLSS (mg/L)
BMBR
YMBR
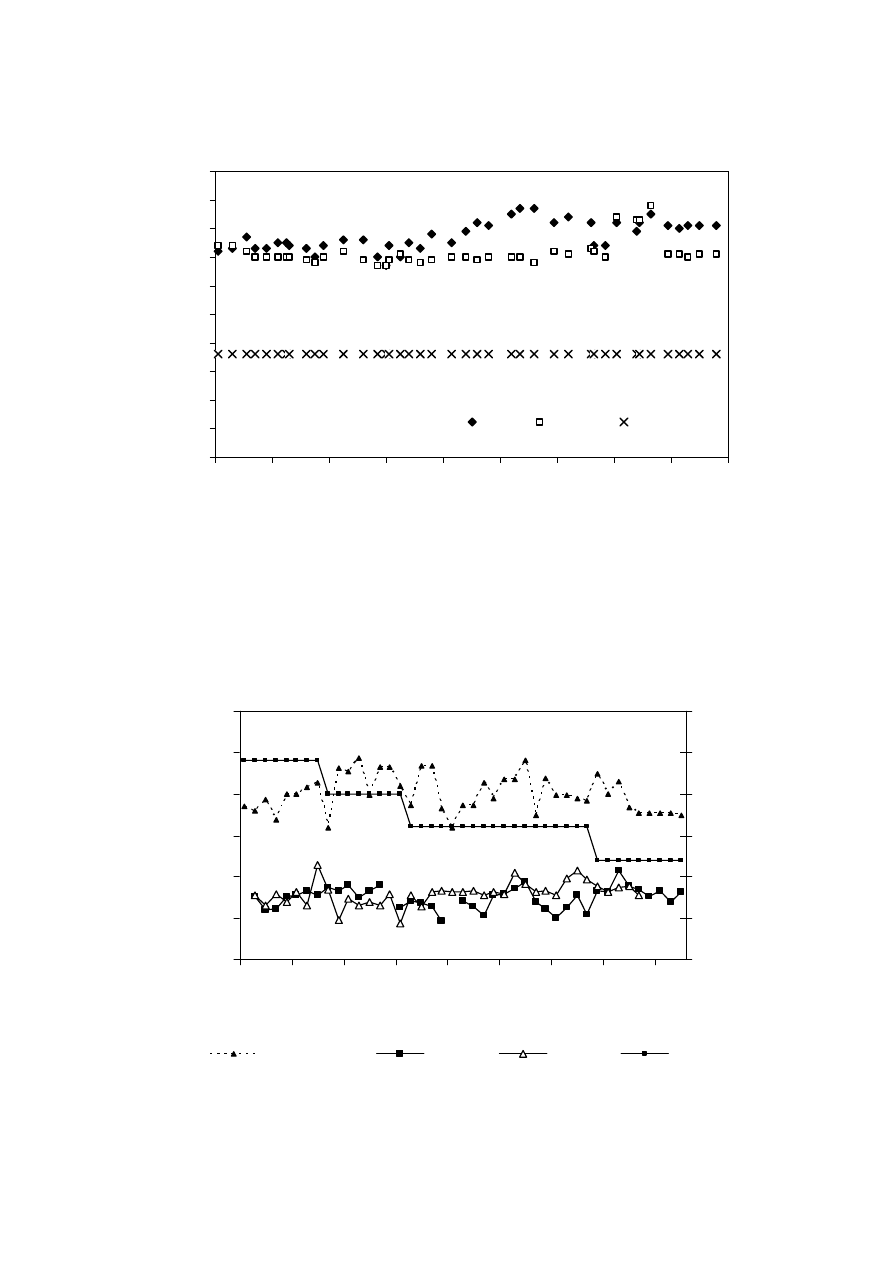
84
Figure 4.15 Variation in pH in the MBR Systems
Figure 4.16 COD Concentration in the Influent and Effluent in the BMBR and YMBR
at Different HRT
0
1
2
3
4
5
6
7
8
9
10
0
20
40
60
80
100
120
140
160
180
Time (days)
pH
Feed
BMBR
YMBR
0
2000
4000
6000
8000
10000
12000
1
22
48
72
94
119
145
173
Time (days)
CO
D
(
m
g/
L)
0
5
10
15
20
25
30
HR
T
(
h)
Influent COD
YMBR
BMBR
HRT
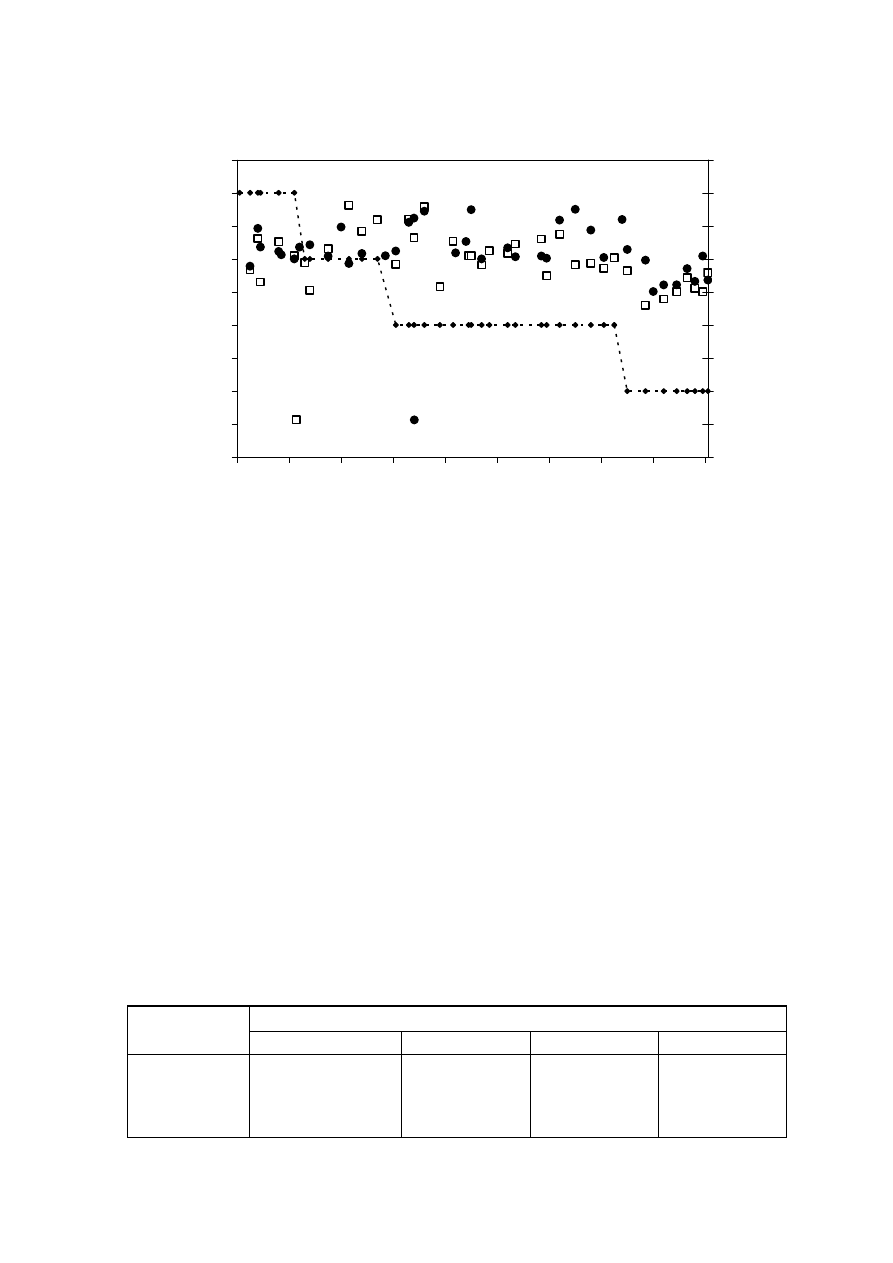
85
Figure 4.17 COD Removal Efficiency in the BMBR and YMBR at Different HRT
The average COD removal efficiency in YMBR system was 63% when HRT
ranged from 16 h to 24 h, whereas in BMBR system, the average COD removal efficiency
was 60% at HRT from 16 h to 24 h as listed in Table 4.6 and Table 4.7. When municipal
wastewater with 300 mg/L COD was treated, a 97% of removal could be achieve (Fan, et
al., 1996). At HRT of 12 h, the average COD removal efficiency in YMBR and BMBR
was to 60% and 51%, respectively. The decrease in removal efficiency in the bacterial
system at a lower HRT was more apparent, which could be due to the presence of
ammonia in the leachate posing toxicity to the bacterial culture. This aspect is also
supported by the biokinetic studies, which states that the ammonia inhibits bacterial cells to
a greater extent than the yeast cells.
The COD removal in 12 h HRT in both the reactors was very low compared to that in
other HRTs. In addition to a better COD removal efficiency, YMBR was more stable than
BMBR. As, the yeast system did not show a significant improvement compared to bacteria
in terms of COD removal, it could be suggested that further investigations are required to
conclude.
Table 4.6 COD Removal Efficiency in YMBR System at Different HRT
COD Removal (%)
Values
HRT 24 h
HRT 20 h
HRT 16 h
HRT 12 h
Maximum 69 70 75 72
Minimum 58 60 59 50
Average 63 64 66 60
Std.
Dev. 4 4 6 8
0
10
20
30
40
50
60
70
80
90
0
20
40
60
80
100
120
140
160
180
Time (days)
COD
Removal Effic
iency
(%)
8
10
12
14
16
18
20
22
24
26
HRT (h)
BMBR
YMBR
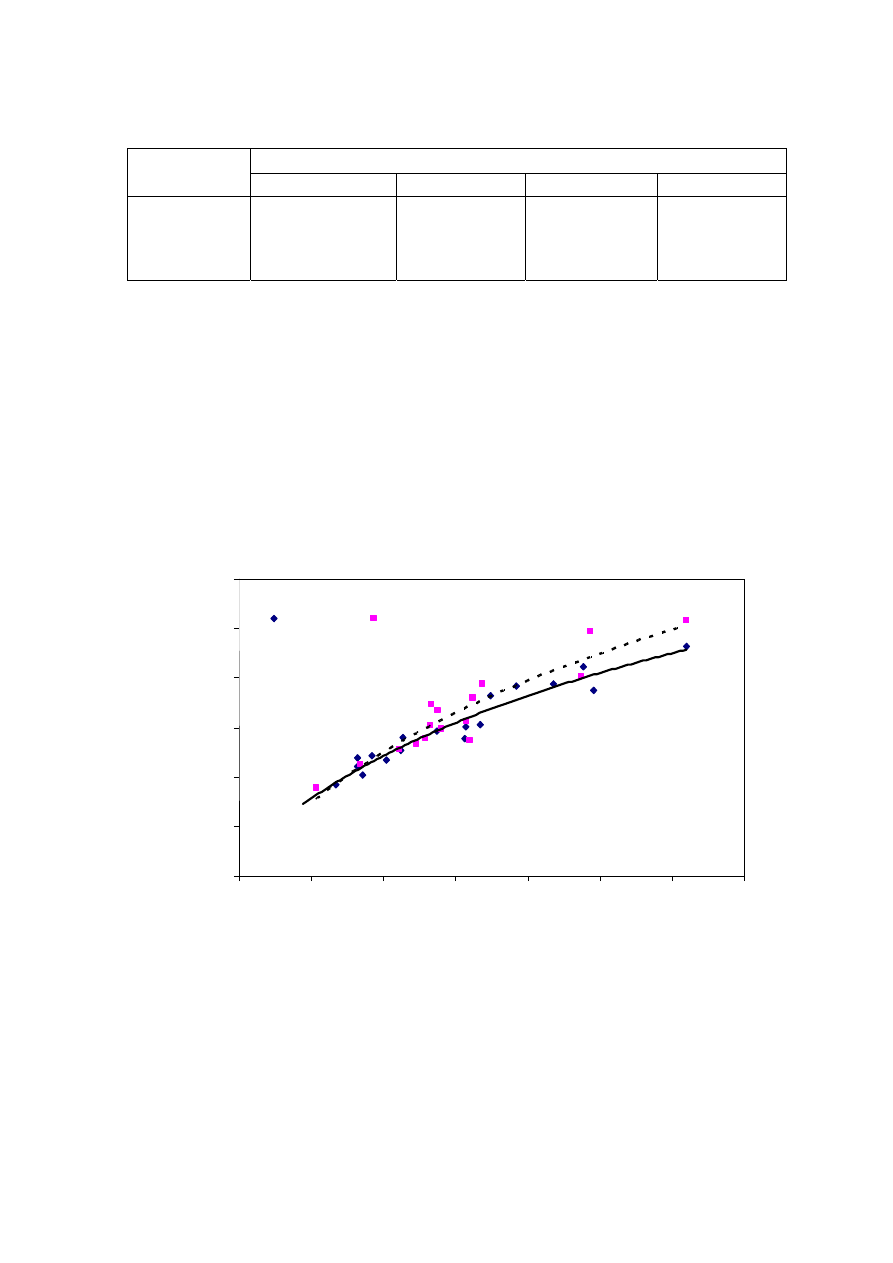
86
Table 4.7 COD Removal Efficiency in BMBR System at Different HRT
COD Removal (%)
Values
HRT 24 h
HRT 20 h
HRT 16 h
HRT 12 h
Maximum 66 76 76 56
Minimum 53 50 52 46
Average 60 65 62 51
Std.
Dev. 6 9 6 4
To further verify the treatability in the yeast and bacterial system, the F/M ratio and
the COD removal with MLSS were compared. Figure 4.18 represents the organic removal
with variation in F/M ratio. It indicated that while comparing the BMBR, YMBR obtained
higher specific COD removal rate at F/M ratio greater than 0.85 mg COD/mg SS.d. It also
showed that the COD removal rate of YMBR is higher than that of BMBR at the same F/M
ratio. Thus, it could be said that though the performance in terms of removal efficiency
cannot be compared, in terms of total organic removal for available biomass in the YMBR
system is better.
Figure 4.18 Variations in COD Removal Rate as a Function of F/M Ratio
As the loading rate was progressively increased through different stages, COD in the
effluent in the yeast ranged from 1,860 to 4,270 mg/L and from 1,765 to 4,560 mg/L in the
bacterial system.
y = 0.5993Ln(x) + 0.6183
R
2
= 0.937
y = 0.7156Ln(x) + 0.6578
R
2
= 0.8766
0.00
0.20
0.40
0.60
0.80
1.00
1.20
0.40
0.60
0.80
1.00
1.20
1.40
1.60
1.80
F/M Ratio (d
-1
)
CO
D
Re
m
ov
al
Ra
te
(m
g C
OD/
m
g
SS
.d
)
BMBR
YMBR
BMBR:
YMBR:
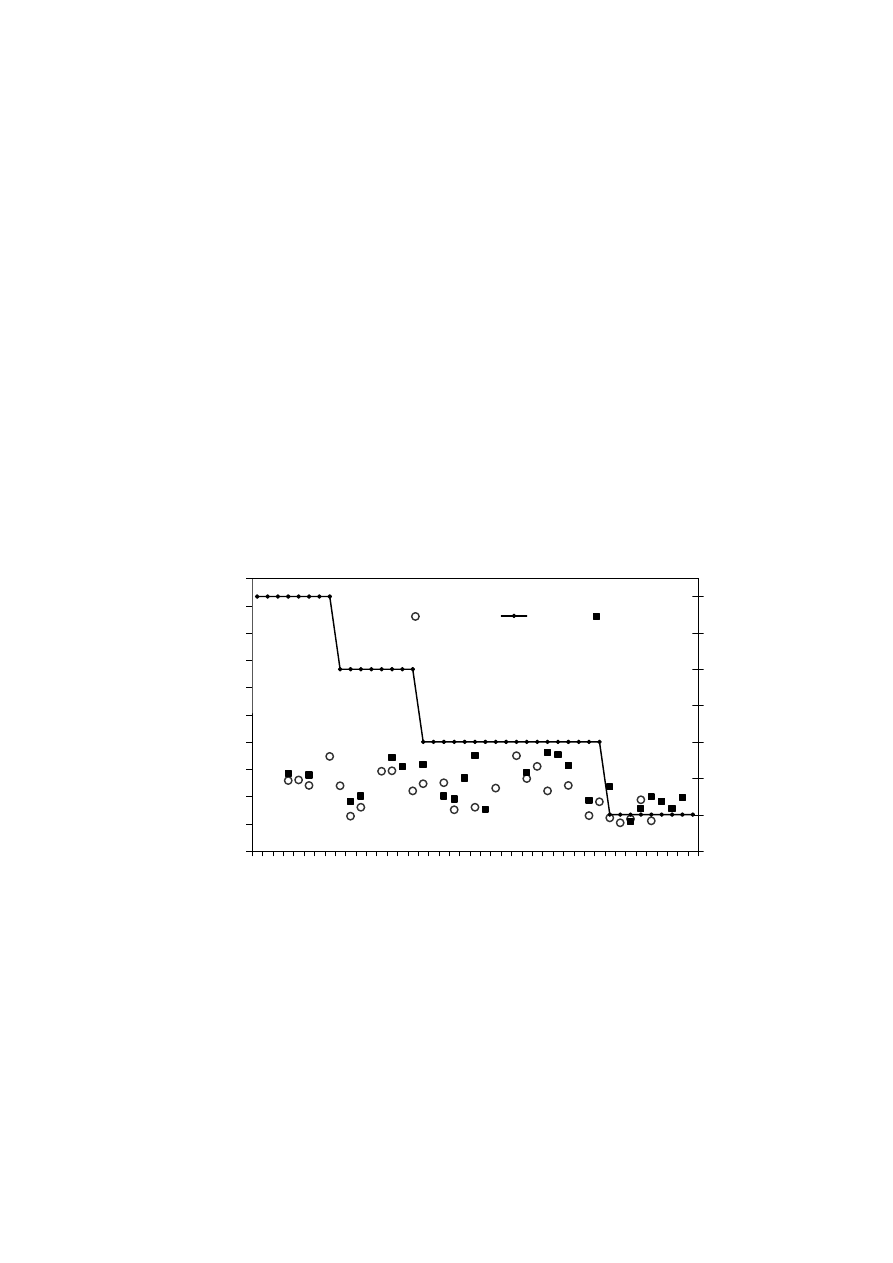
87
(2) TKN Removal Efficiency
Prior to optimizing the HRT in the MBR systems, TKN removal in the leachate was
also studied. A TKN concentration of about 2,000 mg/L was used. The graph showing
influent and effluent TKN concentration in the BMBR and YMBR systems are presented
in Figure E-1 of Appendix E. For the yeast system, the pH range was controlled around 3.6,
to enhance yeast growth and prevent bacterial contamination. In the acidic pH, the
ammonium compounds tend to remain in the form of ammonium ion rather than as
ammonia. Thus, it could be said that the free ammonia concentration in the YMBR would
be less than 1.0 mg/L. The free ammonia in the BMBR was around 12 to 20 mg/L (Section
4.2.3) due to the pH range 6.8-7.0.
Figure 4.19 shows TKN removal efficiency for both YMBR and BMBR systems at
different HRT. There was not any significant difference, though the YMBR was
marginally better than BMBR. Average TKN removal efficiency in YMBR and BMBR
systems was from 19% to 29% and 14% to 25%, respectively as given in Table 4.8 and 4.9.
At a HRT of 12 h, the average TKN removal efficiency in YMBR and BMBR was as low
as 18% and 14%, respectively, similar to low COD removal.
Figure 4.19 TKN Removal Efficiency in the YMBR and BMBR with HRT
0
10
20
30
40
50
60
70
80
90
100
1
22
48
72
94
119
145
173
Time (days)
TKN
Remov
al (%) .
10
12
14
16
18
20
22
24
HRT (h)
BMBR
HRT
YMBR

88
Table 4.8 TKN Removal Efficiency in YMBR System
TKN Removal (%)
HRT (h)
24 20 16 12
Maximum 28 20 36 23
Minimum 28 18 15 11
Average 28 19 29 18
Std. Dev.
0
1
7
5
Table 4.9 TKN Removal Efficiency in BMBR System
TKN Removal (%)
HRT (h)
24 20 16 12
Maximum 26 35 35 19
Minimum 24 13 15 10
Average 25 22 25 14
Std. Dev
1
10
6
3
Along with TKN Removal, the total ammonium content was also measured. The
influent ammonium concentration was around 1,700 mg/L. The ammoniacal nitrogen
contributed to about 85% and above of the total organic nitrogen. The effluent ammonium
concentration in the YMBR and BMBR systems was 1,235 and 1,285 mg/L, respectively.
The ammonium removal concentration was also found to be very low with 18% and 20%
in the BMBR and YMBR system, respectively. The ammonium concentration contributed
to 85-90% of the total nitrogen. The nitrite and nitrate concentrations (NO
2
-
and NO
3
-
) in
both YMBR and BMBR effluents were found to be very low. NO
2
-
and
NO
3
-
concentration
in the YMBR and BMBR effluent ranged from 0.8 to 6.4 mg/L and less than 1.0 mg/L,
respectively. The probable reason for the absence of a notable range of nitrate and nitrite
could be due to the absence of nitrifying bacteria, namely the Nitrosomonas and
Nitrobacter. The inhibition of Nitrosomonas could be due to the free ammonia present in
leachate as suggested by many researchers, that around 7 to 150 mg/L would affect the
Nitrosomonas and a concentration of around 0.1 to 1.0 mg/L would affect the Nitrobacter
(Barnesand and Bliss, 1983; Abeling and Seyfried, 1992). This would have therefore
affected the nitrification process, as a result of which, the leachate should be pre-treated to
reduce ammonia concentration.
Along with the nitrogen content, the phosphorus content in the leachate was also
measured. The average phosphorus concentration found in the leachate was 68 mg/L. The
COD: P ratio was also calculated to find out the nutrient deficiency in the leachate. The
COD: P ratio in the leachate was 100:0.85. Though, the leachate was said to be marginally
phosphorus deficient, it did not adversely affect the COD removal efficiency in the MBR
systems. This was tested with and without addition of polyphosphate in the treatment
system. Further, many biological treatment systems have been used for treating leachate
even with a COD:P as low as 100.02 (Pohland and Harper, 1985). The phosphate removal
in both the reactors was approximately 50%.
During the operation of membrane bioreactors, a frequent problem faced was
foaming. Antifoam addition was used to prevent foam development (Praet, et al., 2001).

89
As there was no significant improvement when the HRT was increased from 16 to 24
h in terms of COD removal, further investigations were done at these two HRT, with 16 h
HRT followed by 24 h HRT.
4.3.3 Membrane Fouling and Membrane Resistance
The membrane fouling is the result of accumulation of rejected particles on the top of
the membrane (external fouling), or deposition and adsorption of small particles or
macromolecules at the pores or within the internal pore structure (internal fouling) of the
membrane (Guell, et al., 1999). The processes that contribute to the fouling are varied.
They include adhesion of the colloidal matters and macromolecules on the external and
internal surface, growth and adhesion of biofilms on the membrane surface, precipitation
of solved matters, aging of the membrane, etc (Gunder, 2001). Because of the complex and
diverse relationships, it is not possible to localize and define fouling clearly. The adverse
effects of the membrane fouling is the reduction of the permeate flux.
In the present study, a constant flux was maintained in the membrane bioreactors.
The resistance of the membrane influences the permeate flux. To maintain a constant flux,
the flow rate was increased correspondingly by adjusting the suction pump. The rapid
membrane fouling is indicated by a sudden increase in the transmembrane pressure. As a
high transmembrane pressure is a result of the membrane fouling process, it was used as a
parameter indicating requirement of cleaning. The membrane in the membrane reactors
were cleaned when the transmembrane pressure difference increased significantly. The
membranes were cleaned before it reached the maximum pressure to prevent damage to the
membrane operation. The transmembrane pressure difference of the YMBR and BMBR
systems is given in Figure 4.20. The detailed results are given in Table E-3 and E-4 of
Appendix E. Though the two reactors, with bacterial and yeast culture did not show much
difference in the performance, the yeast reactor showed an added advantage of lower
membrane fouling and thus, longer membrane life.
The cleaning was done by first flushing the membrane with tap water to remove the
cake layer from the membrane surface. Later, a 3% sodium hydroxide solution was filtered
through the membrane and then, washed with tap water. Finally, 1% solution of nitric acid
was filtered through the membrane followed by tap water. This cycle was repeated until
the membrane resistance was almost equal to the initial membrane resistance.
The frequency of cleaning was greater in bacterial membrane bioreactor than the
yeast membrane bioreactor. The frequency of membrane fouling is presented in the Table
4.10 for both the systems. The membrane resistance after cleaning is presented in Table
4.11. The detailed calculation is summarized in Table D-3 and D-4 and Figure D-1 and D-
2 of Appendix D. The bacterial system was first cleaned after 63 days of operation while
the yeast based system was cleaned after 80 days. It could be said that the membrane with
yeast reactor could be operated 27% more than the bacterial system. Further, in a total of
181 days of operation of the MBR systems, the BMBR was cleaned five times compared to
three times in the YMBR system. The operating time of the yeast membrane was about 1.3
times longer than the bacteria membrane.
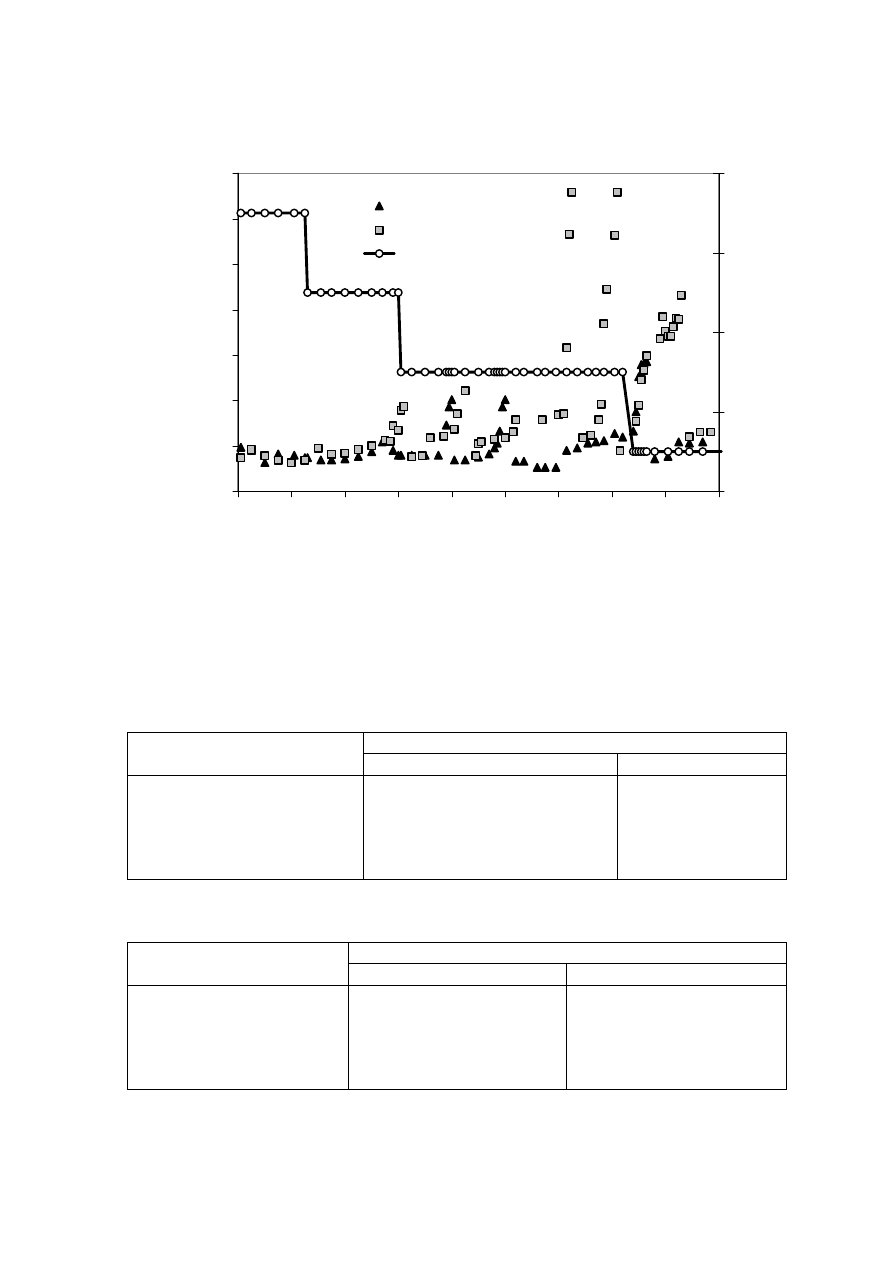
90
Figure 4.20 Cleaning of membranes in the YMBR and BMBR system in relation to TMP
Table 4.10 Membrane Cleaning Frequency in the MBR Systems
Days after Membrane Operation
Membrane Cleaning
BMBR YMBR
1 63
80
2 85
101
3 126
154
4 143
-
5 167
-
Table 4.11 Membrane Resistance in the MBR Systems
Membrane Resistance (m
-1
) after Cleaning
Cleaning Frequency
BMBR YMBR
Initial 6.29×10
11
6.66×10
11
1 1.79×10
12
5.64×10
11
2 1.02×10
12
3.31×10
12
3 1.13×10
12
1.31×10
12
4 2.81×10
12
-
0
10
20
30
40
50
60
70
0
20
40
60
80
100
120
140
160
180
Time (day)
Tran
s-memb
rane Pressure
(kPa)
10
14
18
22
26
HRT (h)
YMBR
BMBR
HRT

91
The probable reason for frequent fouling in bacterial system than yeast system could
be EPS formation. The EPS formation in reactor was greater in bacterial system than in the
yeast system. The mechanism of biofilm development in the YMBR is different from that
of the BMBR. In the YMBR, the yeasts attach itself physically to the membrane surface
during filtration instead of getting trapped in a matrix as the bacterial cell. The yeast cells
usually attach together by means of physical interwinding of mycelia or pseudomycelia
(Nishihara ESRC Ltd., 2001).
Another probable reason for frequent fouling in the bacterial based membrane
bioreactor could be the size and nature of bacterial cells in comparison with the yeast cells.
The bacterial cells have a size of 0.5 to 1.0 µm diameter for the spherical shaped, and 0.5
to 1.0 µm wide and 1.5 to 3.0 µm long for the cylindrical (rods) shaped bacteria whereas
the size of yeast is around 5 to 30 µm length and 1 to 5µm width. The large yeast cells are
said to form a dynamic membrane on the top of the original membrane that is capable of
entrapping some of the protein aggregates. This may enhance the recovery of the viscous
aggregates and thus slowing down the fouling layer on the surface of the primary
membrane. Thus, the yeast interactions slow down the pore blocking by capturing a
significant fraction of protein aggregates (Guell, et al., 1999). In addition to this low
operating pH, poor adhesion capacity and low viscosity could be other reasons for low
fouling frequency in the yeast based MBR systems (Dan, 2002). Thus, yeast sludge can
reduce membrane fouling rate more significantly than the bacterial sludge. Therefore, it
could be suggested that the use of yeast system in the membrane bioreactor could be
beneficial as it has the potential to reduce the operating and maintenance costs of the
treatment system.
4.4 Application of Yeast and Bacteria Based Membrane Bioreactors in Ammonia
Stripped Leachate Treatment
Leachate with high load of refractory compounds, low value of BOD/COD ratio,
heavy metals and high concentration of nitrogen compounds, especially ammoniacal
exhibit difficulty in treatment (Dichtl, et al., 1997). Biological treatment becomes difficult
when the regarded leachate is inhibitive, toxic and older-less biodegradable (Geenens, et
al., 1999). Due to the presence of high ammonium content in the leachate, it could be
suggested that removal of ammonium is required prior to biological membrane treatment.
4.4.1 Ammonia Stripping Studies
The toxicity of ammonia-bearing waste to bacteria, algae, zooplankton and fish is a
universal phenomenon. Ammonia has been shown to be toxic in oxidation ponds where
high free ammonia and pH inhibit photosynthesis (Abeliovich and Azov, 1976). The
activated sludge process has also been shown to fail due to the ammonia toxicity and
phosphorous limitation (Keenan, et al., 1984). In addition, Cheung, et al. (1993) through
algal toxicity suggested that ammonia concentration as ammoniacal nitrogen is a major
factor governing the toxicity of landfill leachate. Along with this, it was difficult to
overcome the ammonia toxicity and to treat the leachate containing a low COD/N ratio
with biological process (Keenan, et al., 1984; Robinson and Maris, 1985; Cheung, et al.,
1997). Therefore, there is a need to reduce the concentration of ammonia in the leachate
below inhibitory level for the success of biological systems in proper leachate treatment.
As ammonia stripping is simple and less expensive than other physico-chemical methods

92
available, and appears to be cost effective pretreatment option for landfill leachate (Cheung,
et al., 1997), it was used in the present studies.
The initial ammoniacal nitrogen in the simulated landfill leachate proposed in the
study was around 1,600-1,800 mg/L. Ammonia stripping studies were done in two stages-
one in the laboratory scale to optimize the parameters to be used for ammonia studies prior
to MBR process and secondly, in the pilot scale studies to confirm the results of the
laboratory studies in a larger scale. The laboratory scale studies were done with leachate
volume of 2 L whereas pilot scale studies were done with leachate volume of 40 L.
Firstly, the pH for the ammonia stripping was standardized using a velocity gradient
of 1,530 s
-1
with a contact time of 2 h. The alkaline pH facilitates the formation of the free
ammonia molecule in comparison with the ammonium ion, thus making it easy to remove
ammonia. For this reason, the pH was adjusted to alkaline condition. The pH was adjusted
to 9, 10, 11, and 12 using sodium hydroxide solution. The variation in removal efficiency
was tested for three samples with different concentrations to eliminate the standard error in
the analysis. It was found that the ammonia removal efficiency significantly increased
when pH was increased from 10 to 11 or 12. The detailed results are presented in Table F-1
of Appendix F. The removal efficiency was 38-45 % at pH 11 compared to 16-23% at pH
9 and 24-30% at pH 10 (Figure 4.21). The difference between the removal efficiency at pH
11 and 12 was around 5%, which was considered not much significant. Thus, it could be
said that the effective pH for the ammonia stripping would be around 11-12. The results of
ammonia stripping were similar to other studies done in municipal landfill leachate
(Cheung, et al., 1997; Ozturk, et al., 1999).
After standardization of pH, the velocity gradient and the contact time were
standardized using leachate samples with pH 11-12. The ammonia concentration and
removal efficiency at different contact time and the velocity gradients are given in the
Table F-2 to F-4 of Appendix F. The contact time for the ammonia removal was varied
from 2 to 6 h. The velocity gradient used in the study was 1,530, 2,850 and 4,330 s
-1
,
which were varied along with the contact time. Figure 4.22 elaborates the removal
efficiency and ammonia concentration with varying contact time and velocity gradient for
the initial leachate ammonia concentration of 1, 380 mg/L.
The summary of the results for different samples at varied contact time and velocity
gradient is summarized in Table 4.12. The rate of ammonia removal is directly
proportional to the velocity gradient or the volume of air diffused through the liquid. The
main mechanism used for ammonia removal was simple mechanical mixing. It was found
that when the velocity gradient was increased from 2,850 s
-1
to 4,330 s
-1
, the removal
efficiency did not improve much with 2, 4 and 6 h contact time. Therefore, it could be
concluded that 2,850 s
-1
was the optimum velocity gradient for ammonia stripping. The
ammonia removal efficiency was found to be between 88 and 95% at 4 h contact time at
velocity gradient of 2,850 s
-1
. Though at 6 h contact time, the ammonia removal efficiency
improved further, the difference in ammonia removal between 4 and 6 h was not
significant. Thus, the standard velocity gradient and the contact time were taken as 2,850
s
-1
and 4 h, respectively. At optimum conditions, the system consumed NaOH of 12.5
kg/m
3
and produced sludge at a rate of 80-100 L/m
3
.
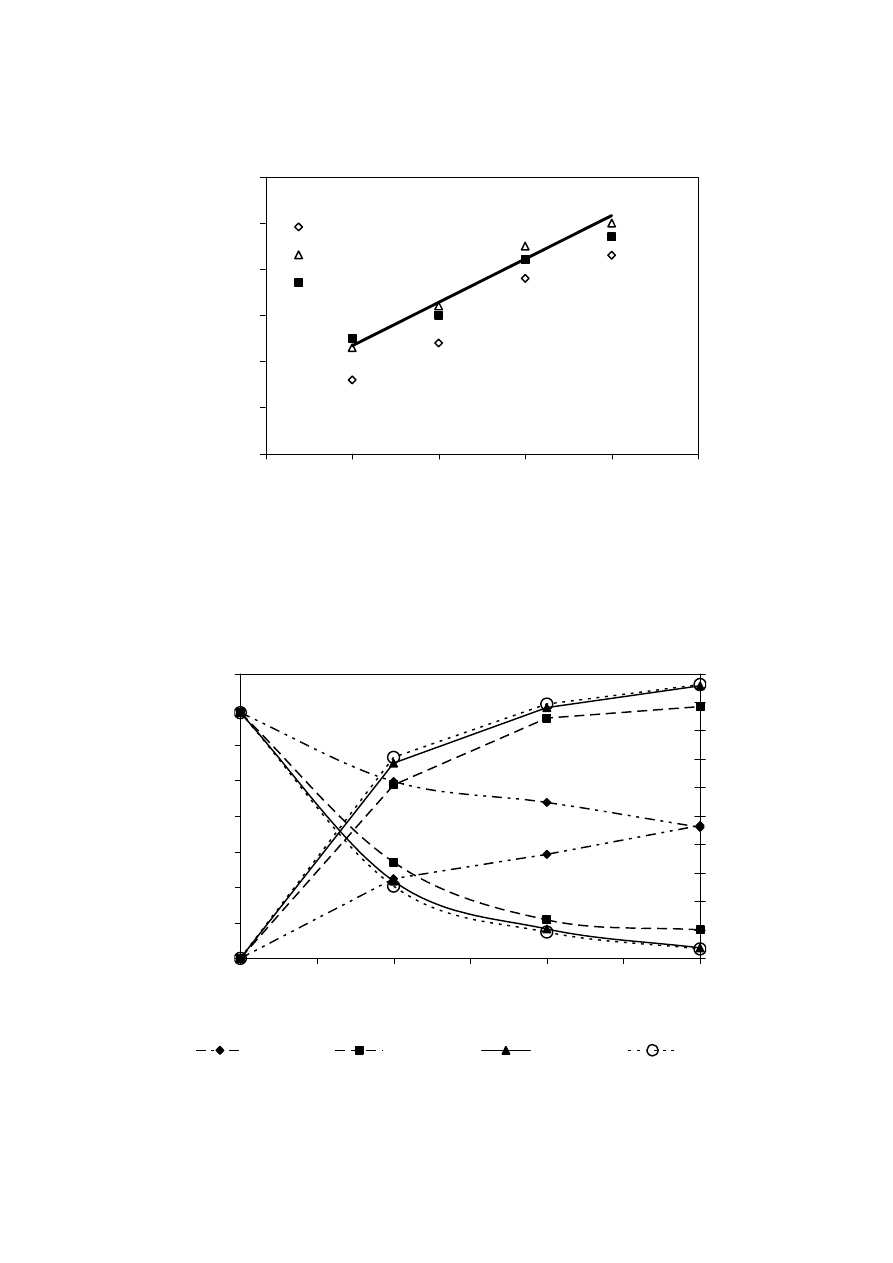
93
Figure 4.21 Variation in the Ammonia Removal Efficiency with pH
Figure 4.22 Ammonia Removal Efficiency with Varying Velocity Gradient and pH
0
200
400
600
800
1000
1200
1400
1600
0
1
2
3
4
5
6
Contact Time (h)
Ammonia Concentration
(m
g/
L)
0
10
20
30
40
50
60
70
80
90
100
R
emova
l Effec
iency
(%)
Control
1530 s-1
2850 s-1
4330 s-1
R
2
= 0.9753
0
10
20
30
40
50
60
8
9
10
11
12
13
pH
Ammonia Removal
(%)
1,106 mg/L
1,366 mg/L
1,380 mg/L

94
Table 4.12 Variation in Ammonia Removal Efficiency
Ammonia Removal (%)
Contact Time (h)
Velocity Gradient
(s
-1
)
2 4 6
0 28-31
37-46
47-51
1,530 61-66
84-86
88-93
2,850 69-74
88-95
96-98
4,330 71-76
89-95
96-98
While Diamadopoulos, 1994 did the ammonia removal experiments using air
stripping at pH 11.5 with air flow rate 2-3.5 L air/L in leachate, he could achieve 95%
ammonia removal after a time period of 24 h. The removal efficiency of air stripping was
similar with the present study, with the advantage that the present study required a lower
time period. The main role of agitation was to create turbulence sufficient enough in the
free leachate surface, to increase the surface area for ammonia removal (Smith and Arab,
1988). In this case, the ammonia desorption would be less important than the surface area
similar to studies done by Cheung, et al. (1997). This could be the probable reason for the
efficient removal at a lower contact time. Another added advantage is that the present
process can withstand changes in the volume and leachate concentration in comparison
with the nitrification and denitrification processes for ammonia removal. It could also be
said that ammonia stripping is an appropriate option for pre-treatment of leachate even in
terms of cost-effectiveness (Cheung, et al., 1997).
In the second stage of ammonia stripping studies as mentioned above, the pilot-scale
studies were done to confirm the results obtained from laboratory-scale studies. The pilot
scale study was conducted with leachate volume of 40 L at pH 11-12 and velocity gradient
of 2,850 s
-1
. The summary of the pilot scale studies are given in Table F-5 of Appendix F.
The contact time was varied from 1 to 5 h. At each hour, the removal efficiency was
measured. The average removal efficiency was found to be 89% at 5 h contact time. From
the pilot scale studies, similar removal efficiency was expected at 4 h. Pilot scale results
could be taken as a representative results as the standard error decreased with increasing
volume. When Yangin, et al. (2002) worked on ammonia stripping of domestic wastewater
mixed with leachate, it was found that 89% ammonia could be removed from the UASBR
effluent containing an ammonium concentration of 1,000-2,000 mg/L. So, with the pilot
scale study, we can be assured that the optimum condition persists at 5 h contact time. To
verify this result again, with varying leachate ammonia concentration, the experiment was
conducted and the average ammonia removal efficiency of 86% could be obtained with
standard deviation of 3 mg/L. The results of this experiment are given in Table F-6 of
Appendix F.
The mechanism in ammonia stripping could be due to the ammonia desorption from
the surface of the liquid leachate into the gaseous phase. It has also been said that the mass
transfer of ammonia from liquid to air is proportional to the concentration of ammoniacal
nitrogen in the solution and is a first order reaction (Srinath and Loehr, 1974). However,
this could not be proved significantly in the present study, as only a range of ammoniacal
nitrogen in the leachate was used in the experiment. Another aspect to be discussed in the
study would be biological removal of ammonia in the aeration process through agitation. It
was clear that the ammonia was removed through stripping rather than biological activity
as there wasn’t a significant increase in the concentration of the oxidized nitrogen

95
concentration after treatment. Other probable reasons could be absence of the nitrification
process at a pH as high as 11 which would rather inhibit the process regardless of the
composition of leachate used, absence of sufficient nitrifying bacterial population and
oxidation of ammonia would require long generation time (Cheung, et al., 1997).
4.4.2 Membrane Resistance and Membrane Cleaning
The experiment on ammonia coupled membrane bioreactor for leachate treatment
was continued with the membranes which were used for the previous set of experiments. A
new membrane was changed in both the bioreactors after few days of operation. The
membrane was changed after 45 days in the BMBR system and after 204 days in the
YMBR system. The data and figure for initial membrane resistance measurement are given
in Table D-5 and Figure D-3 of Appendix D. The membrane resistance of the new
membrane used in the BMBR system was found to be 7.07 x 10
11
m
-1
and that of YMBR
was found to be 9.75 x 10
11
m
-1
. The frequency of cleaning in the BMBR system was twice,
114 and 174 days after the experiment started. It was found that the yeast system operated
2.5 times more than that of the bacterial system.
Membrane fouling causing a decline of permeate flux can also be explained using the
resistance-in-series model, which provides a simplistic means to describe the relationship
between permeate flux and trans-membrane pressure. As described in this model, the
permeate flux is given by the Equation 4.2 and total resistance is given by Equation 4.3.
R
t
= R
m
+ R
n
+ R
c
Eq.
4.3
Where;
R
m
= intrinsic resistance (m
-1
)
R
n
= irreversible fouling (m
-1
)
R
c
= resistance due to cake layer (m
-1
)
This equation gives the various parameters that affect the filtration performance.
Irreversible fouling (R
n
) results in supplementary resistance to filtration and is often due to
adsorption of soluble organics. Resistance due to the cake that forms on the membrane
surface (R
c
) is a function of the concentration and composition of suspended matters as
well as the applied hydraulic conditions.
The total resistance (R
t
) was measured immediately after the clogging of the
membrane. R
m
and R
n
were obtained by measuring the resistance of the membrane after
being washed with tap water to remove the cake layer. The membrane resistance after
chemical cleaning before the operation was considered as R
m
. R
c
Value was derived from
R
t
, R
m
, and R
n
using Equation 4.3. To have a better understanding of the membrane
resistance and its role in biofouling, the membrane resistance caused by the varied factors
was measured while cleaning the membrane in the BMBR system. The varied resistance
measured during the first and the second cleaning is presented in Table 4.13.
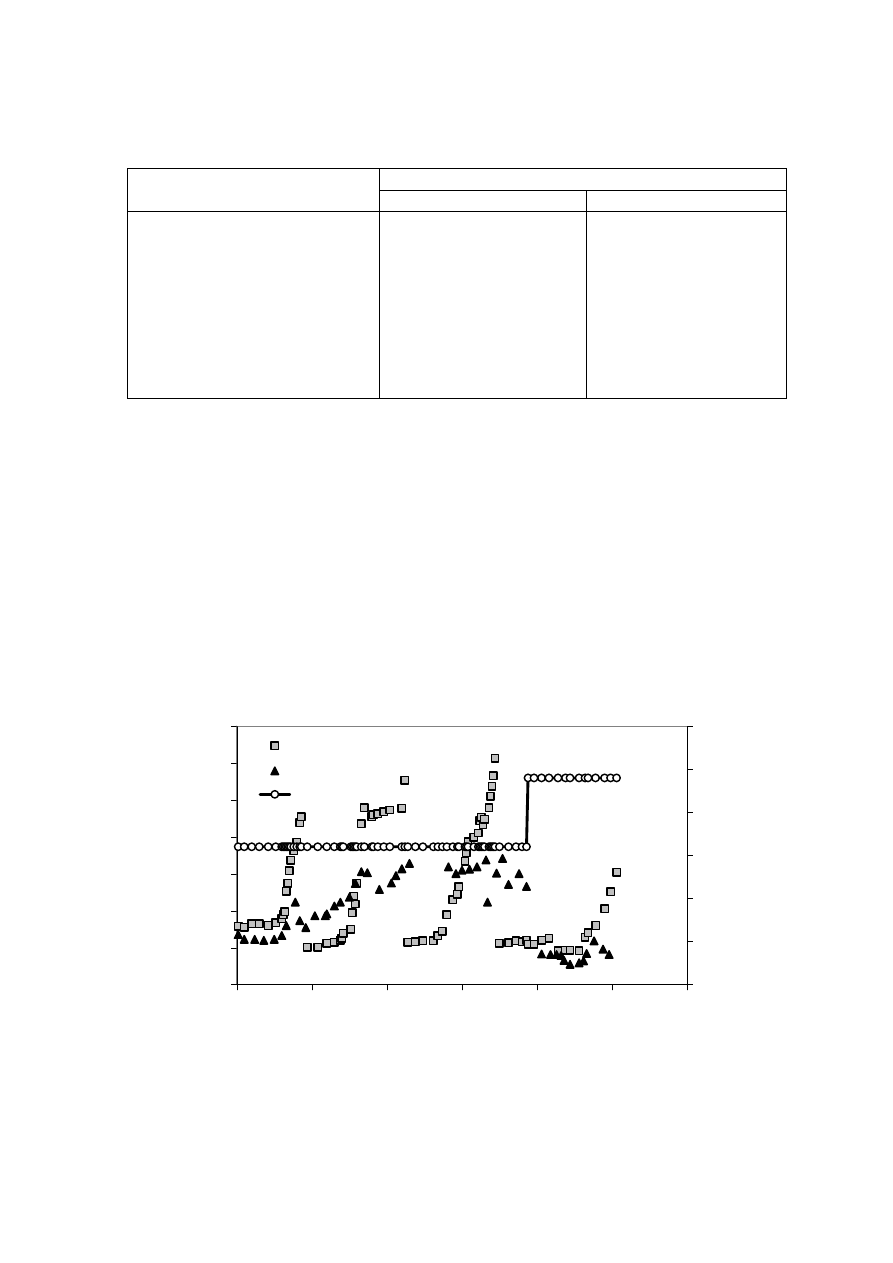
96
Table 4.13 Determination of Membrane Resistance of Membrane Module after Clogging in
BMBR system (A = 0.42 m
2
; Pore Size = 0.1 µm)
Membrane Resistance (m
-1
)
Item
1
st
Cleaning
2
nd
Cleaning
New membrane
7.07 x 10
11
7.07 x 10
11
After long run (BMBR)
9.19 x 10
13
1.41 x 10
14
After cleaning with tap water
1.97 x 10
13
2.43 x 10
13
After chemical cleaning
8.71 x 10
11
9.79 x 10
11
Total resistance (R
t
)
9.19 x 10
13
1.41 x 10
14
Initial membrane resistance for
next run (R
m
)
8.71 x 10
11
9.79 x 10
11
Fouling resistance (R
n
)
1.88 x 10
13
2.33 x 10
13
Cake layer resistance (R
c
)
7.22 x 10
13
1.17 x 10
14
The total membrane resistance is a sum of cake layer resistance, intrinsic resistance
and irreversible resistance due to fouling. The variation in transmembrane pressure with
time in the MBR systems used for ammonia stripped leachate treatment is given in Figure
4.23. The membrane resistance after the long run was found to be 9.19 x 10
13
m
-1
before
the first cleaning. Which further increased to 1.41 x 10
14
m
-1
before the second cleaning
was done. The cake layer contributed to 79% of the total resistance during the first
cleaning which further increased to 83% during the second cleaning. From the greatest
contribution of cake resistance to the total resistance, one could conclude that the
formation of cake layer played a major role in flux decline during filtration (Kim, et al.,
1998). This could be due to some loss due to the irreversible resistance in the membrane.
Figure 4.23 Trans-membrane Pressure Variation in MBR Process for Ammonia Stripped
Leachate Treatment
0
10
20
30
40
50
60
70
0
50
100
150
200
250
300
Time (day)
Trans-membrane P
ressure
(kPa)
0
5
10
15
20
25
30
HR
T (h)
BMBR
YMBR
HRT

97
After the chemical cleaning of the membrane during both the times, 99% of the
initial membrane resistance could be obtained. The fouling resistance in the membrane
bioreactor was 20% and 17% during the first and second cleaning, respectively of that of
the total resistance. This indicated that the cake layer resistance was much higher than the
fouling resistance in the membranes. The reduction in flux due to membrane biofouling is
largely affected by physico-chemical characteristics and physiology of activated sludge as
well as membrane materials (Kim, et al., 1998). The factors affecting the membrane
fouling will be discussed in later part of this chapter.
4.4.3 Performance of Ammonia Stripping Coupled Membrane Bioreactor Process
As the performance in terms of COD removal efficiency without ammonia stripping
was not significant with 16 and 24 h HRT, the performance of MBR was evaluated in
terms of both COD and BOD at HRT of 16 h followed by 24 h. Stable biomass retention in
the MBR is effective in BOD removal. The MBR system though effective in BOD removal,
is not easy to remove nitrogen (Ahn, et al., 2002). The optimum conditions derived from
ammonia stripping studies as described in section 4.4.1 were used for ammonia removal.
Ammonia removal was used for nitrogen removal instead of nitrification-denitrification
process because old leachate does not have sufficient degradable organics to supply the
bacteria with carbon needed for growth. The ammonia stripping was done once every three
days to feed the membrane bioreactors. The performance could be evaluated as described
below.
(1) COD Removal Efficiency
The COD of the influent leachate ranged from 7,600 to 8,200 mg/L with 16 and 24 h
HRT. After the ammonia stripping, the leachate was fed into the feed tanks to feed
membrane bioreactors. In both the operational conditions, with 16 and 24 h HRT, the
average MLSS concentration ranged from 11,000 to 12,000 mg/L. The MLSS
concentration was similar to the membrane bioreactors without ammonia stripping. The
variation in the MLSS concentration and the influent COD influent with 16 and 24 h HRT
is given in Figure 4.24 and 4.25, respectively. The advantages of biomass retention in
membrane bioreactor are that, even the slow growing organisms, normally washed off in
conventional process are retained in membrane bioreactor (Ben Aim and Semmens, 2002).
The entire range of data is given in Table G-1 to G-4 of Appendix G.
The fluctuations in the membrane bioreactor treatment in terms of COD removal
with ammonia stripping were found to be lower than that without ammonia stripping. Both
YMBR and BMBR reactor without ammonia stripping, did not show improvement in COD
removal when the HRT was increased, while in both the systems there was slight
improvement in COD removal when the HRT was increased. The nitrogen removal in the
membrane bioreactor was satisfactory. The probable reason for nitrogen removal would
have been denitrification rather than nitrification as there was not any sufficient increase in
oxidized nitrogen compounds (Muller, et al., 1995). The COD removal in the YMBR and
BMBR with the ammonia stripping was the same. Both the membrane reactors showed a
COD removal of 72% at 16 h HRT and 76% at 24 h HRT. When Ahn, et al. (2002) treated
leachate with 1,017 mg/L COD, they found that the MBR system could achieve a COD
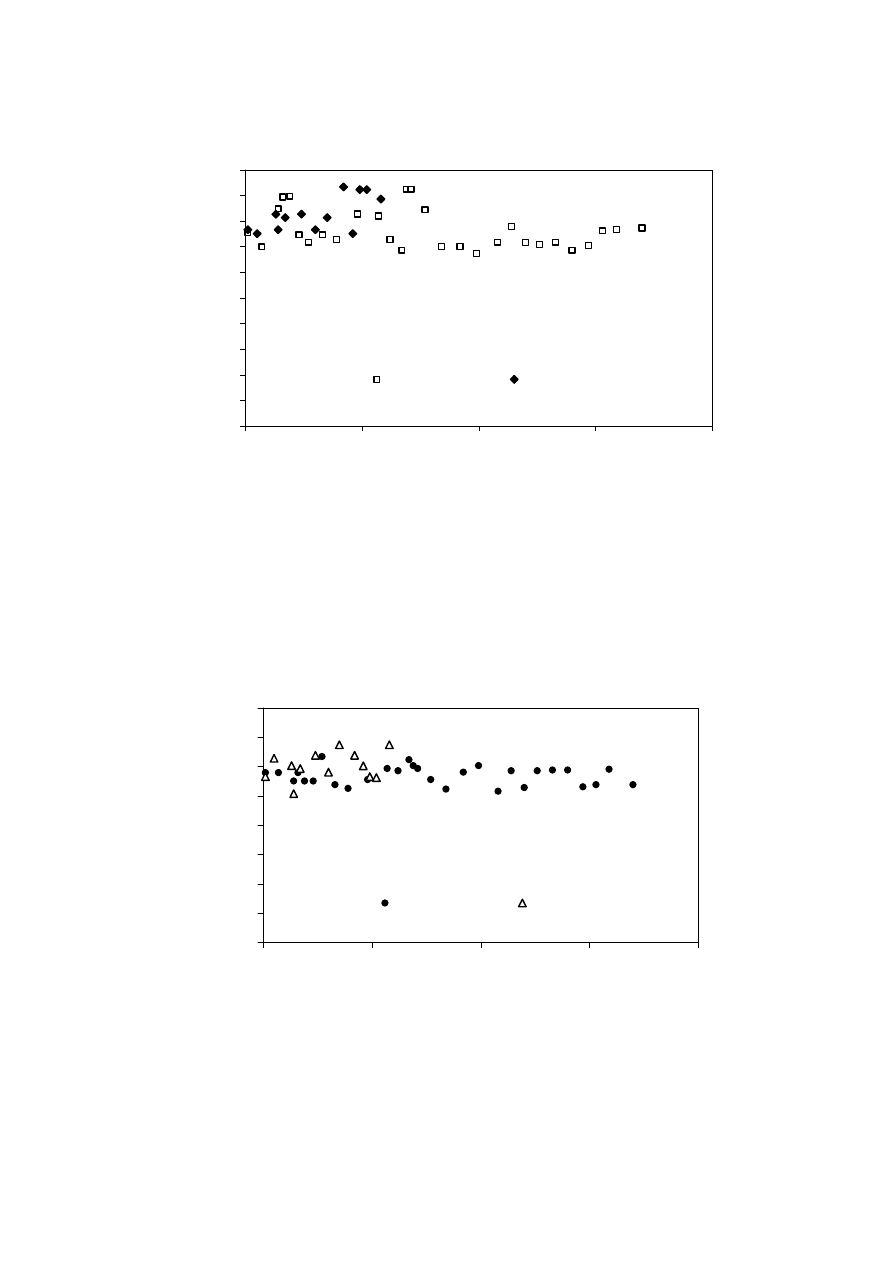
98
Figure 4.24 Variation in COD at 16 and 24 h HRT
Figure 4.25 Variation in MLSS at 16 and 24 h HRT
0
1000
2000
3000
4000
5000
6000
7000
8000
9000
10000
0
50
100
150
200
Time (Days)
COD (mg/L)
16 h HRT
24 h HRT
0
2000
4000
6000
8000
10000
12000
14000
16000
0
50
100
150
200
Time (Days)
MLSS (
m
g/L)
16 h HRT
24 h HRT
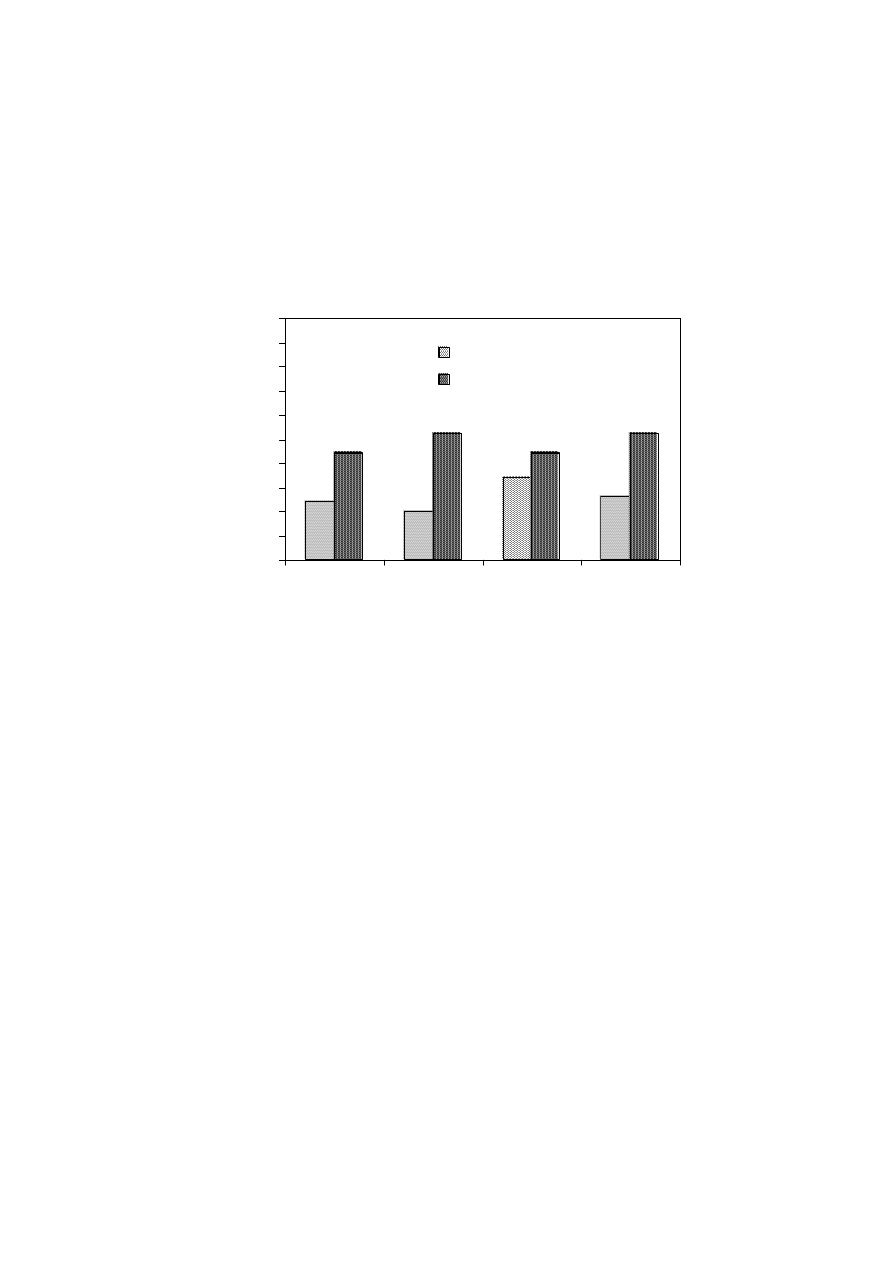
99
removal of 38%. A higher removal in the present study could be due to the high
concentration of biomass used. The COD removal at 16 and 24 h HRT with and without
ammonia stripping is presented in Figure 4.26.
From Figure 4.26, it is clear that the ammonia stripping improved the performance of
COD removal of the BMBR much more than that of the YMBR system as anticipated from
the toxicity studies.
Figure 4.26 COD Removal with and without Ammonia Stripping at 16 and 24 h HRT
Figure 4.27 shows the expected improvement by ammonia stripping through
biokinetic study and actual improvement for the influent ammonium concentration.
Though, the expected improvement in terms of COD removal in the yeast system was low,
the actual improvement was found to be much higher with 24 h HRT better than the 16 h
HRT. The probable reason for this could be that the biokinetic studies were done at a low
substrate concentration as compared to the actual simulated leachate. For the BMBR
system, the improvements in the COD removal for 24 h HRT was as anticipated though
lower for 16 h HRT. This is another indication to the fact that the system was more
stabilized at 24 h HRT than at 16 h HRT. The standard deviation in the COD removal at
24 h HRT was 2 mg/L in the BMBR system. Thus, suggesting that in terms of COD
removal was better at 24 h HRT.
(2) BOD Removal Efficiency
As the study without ammonia stripping did not show a significant difference in the
COD removal, BOD was monitored in both the effluents in addition to the COD while
working on ammonia stripped leachate. The BOD data for 16 and 24 h HRT is presented in
Figure 4.28 and 4.29. The BOD removal in both the BMBR and YMBR systems were
above 94%. Ahn, et al. (2002) found that a leachate with BOD around 250 to 300 mg/L,
BOD removal was 97%. Though the membrane bioreactor was moderately efficient in the
removal of COD, the BOD removal was high. This shows that the membrane bioreactors
are efficient in the removal of the degradable organics in the leachate and the probable
50
55
60
65
70
75
80
85
90
95
100
BMBR-16h BMBR-24h YMBR-16h YMBR-24h
C
OD R
em
ov
al
(%)
Without Ammonia Stripping
With Ammonia Stripping
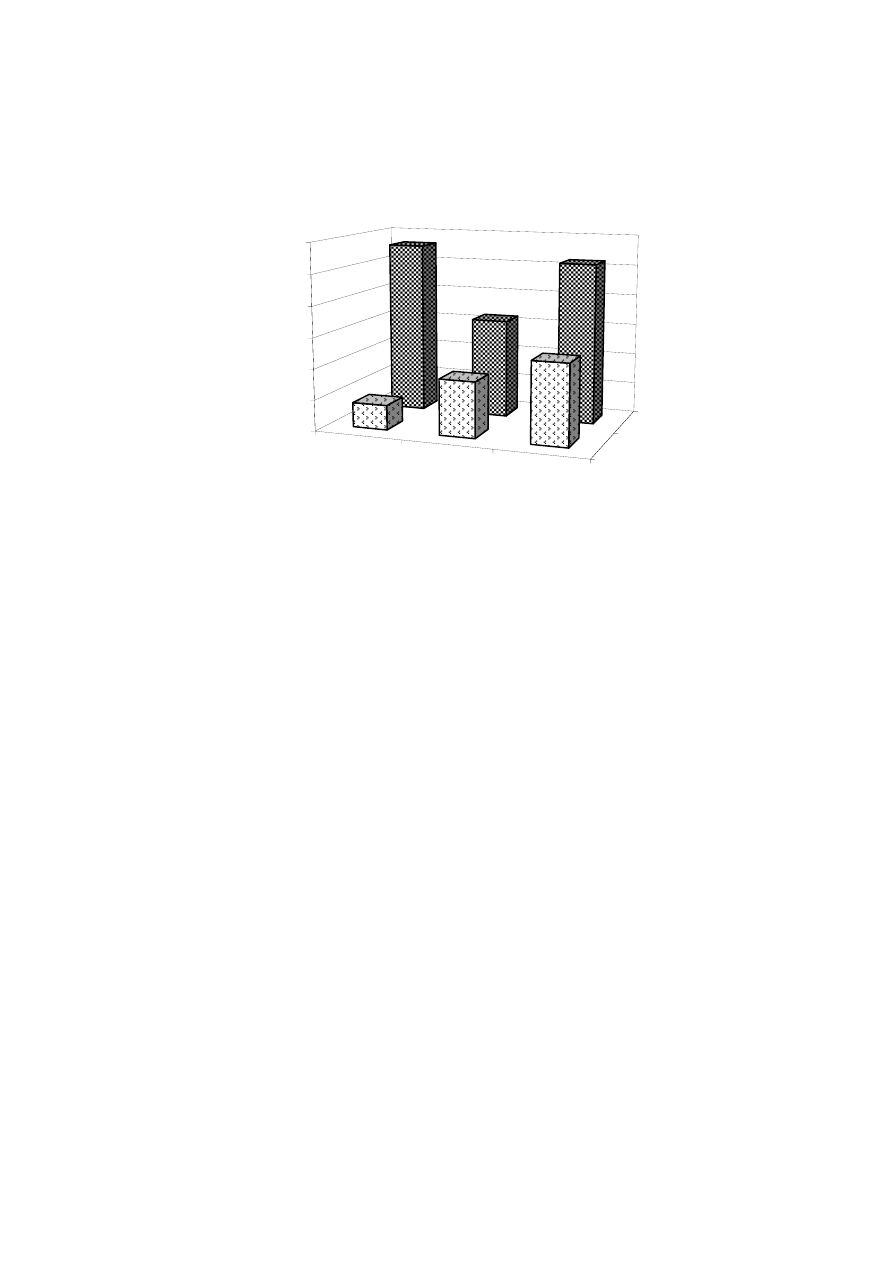
100
reason for moderate removal efficiency could be because of the refractory nature of the
leachate.
Figure 4.27 Expected and Actual Improvement in COD Removal with Ammonia Stripping
in the YMBR and BMBR Systems
The average BOD removal efficiency of the 16 and 24 h HRT in both the reactors is
given in Figure 4.30. At 16 h HRT, BOD in the bacterial reactor was about 202 mg/L and
that of yeast reactor was 84 mg/L. At 24 h HRT, BOD of yeast effluent was within the
wastewater discharge standards (30 mg/L) and bacterial effluent slightly exceeded the
discharge standards (55 mg/L).
As the BOD removal was high, the BOD/COD drastically reduced. The influent
BOD/COD concentration was 0.4. As shown in Figure 4.31, the BOD/COD ratio reduced
significantly from 0.4 to 0.1 in the BMBR and 0.01-0.03 in the YMBR.
The achieved low BOD/COD ratio indicated that both YMBR and BMBR effluents
contains a high refractory organic substances which might be due to the contribution of the
slowly biodegradable organics and non-biodegradable organics contained in the raw
leachate.
Biokinetic
Study
16h HRT
24h HRT
YMBR
BMBR
0%
5%
10%
15%
20%
25%
30%
Improvement in C
OD
Removal
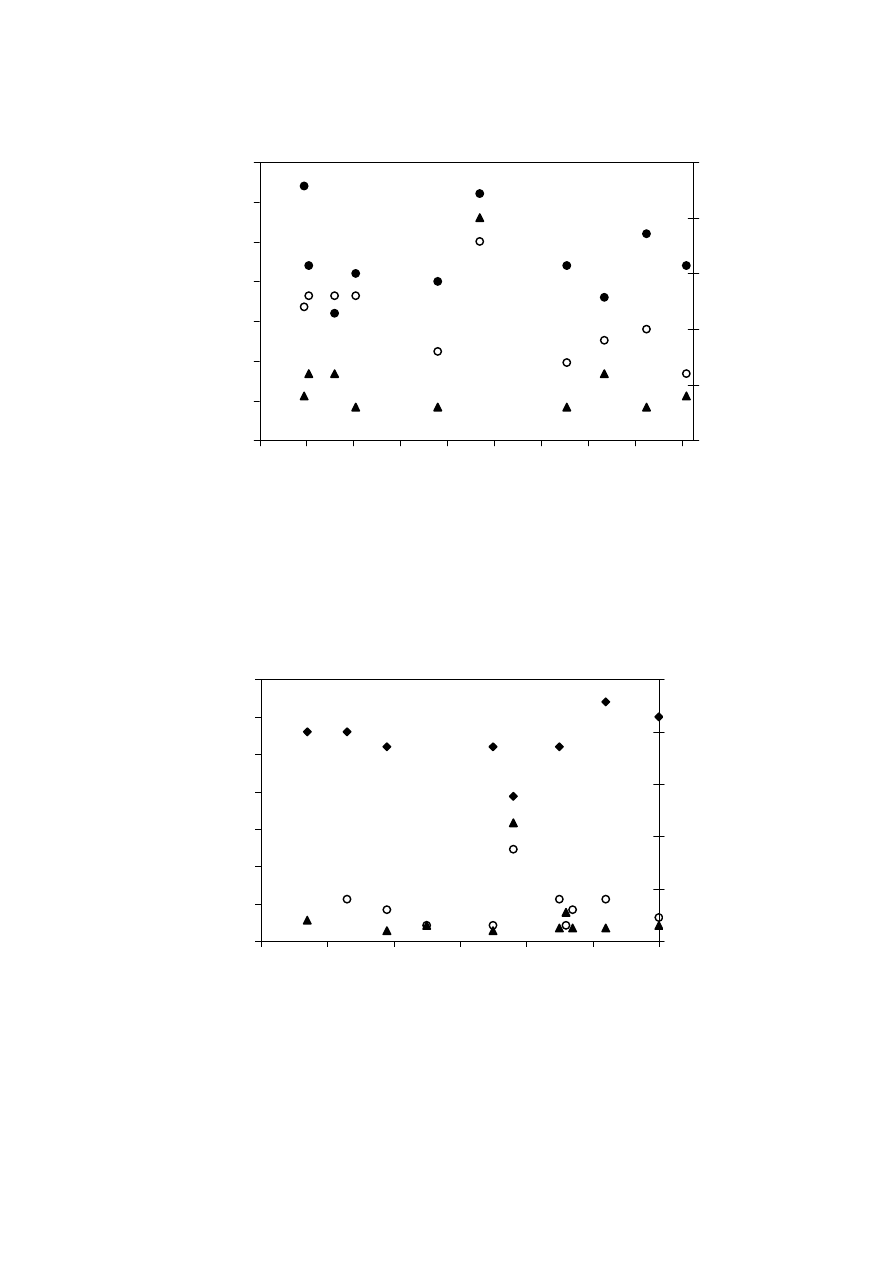
101
Figure 4.28 BOD in the BMBR and YMBR Effluent at 16 h HRT
Figure 4.29 BOD in the BMBR and YMBR Effluent at 24 h HRT
1000
1500
2000
2500
3000
3500
4000
4500
0
10
20
30
40
50
60
Time (Days)
Influen
t BOD
(mg/L)
0
100
200
300
400
500
E
ffluen
t BOD
(mg/L)
Influent
YMBR Effluent
BMBR Effleunt
1000
1500
2000
2500
3000
3500
4000
4500
0
20
40
60
80
100
120
140
160
180
Time (Days)
Influent BOD
(mg
/L)
0
100
200
300
400
500
E
ffluent BOD
(
m
g/L
)
Influent
YMBR Effluent
BMBR Effleunt
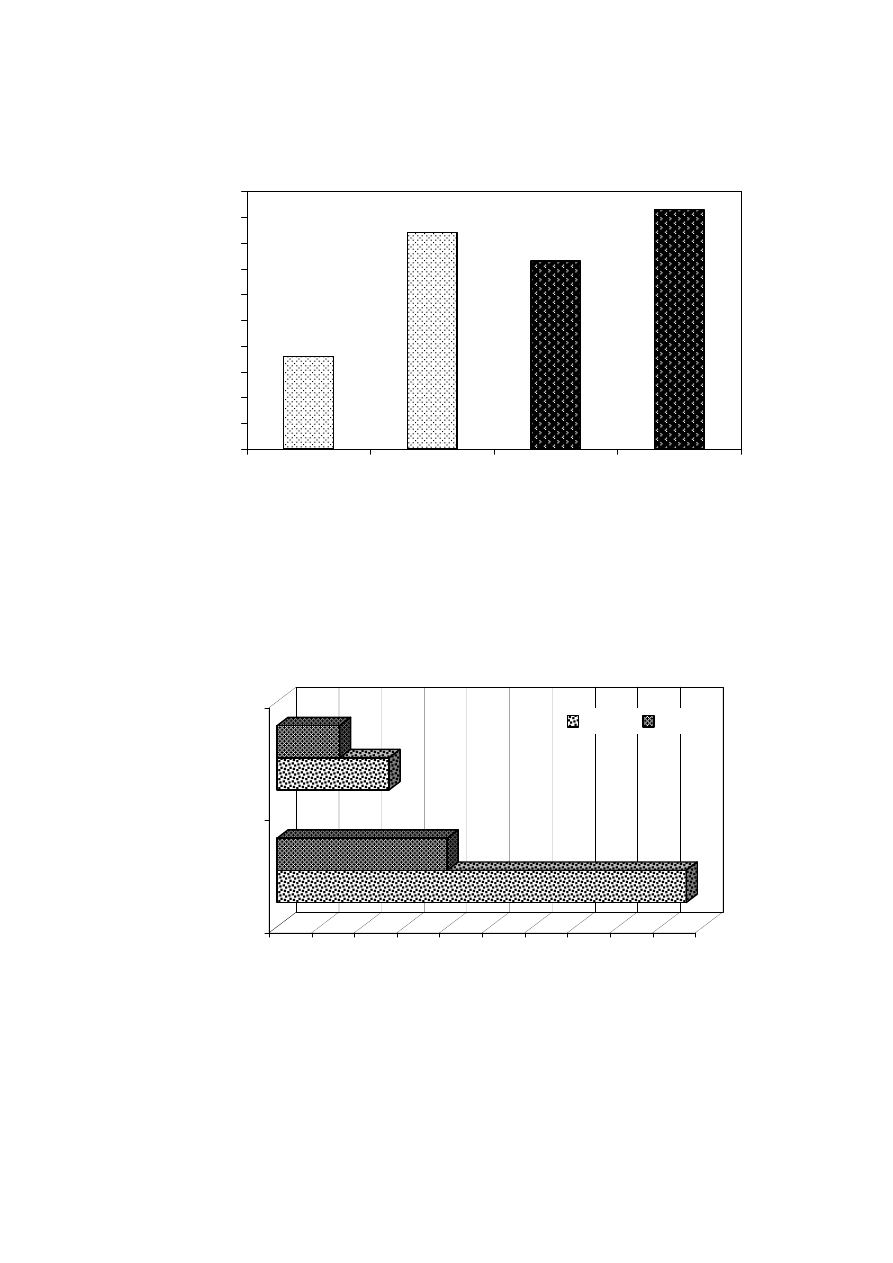
102
Figure 4.30 BOD Removal Efficiency in the BMBR and YMBR Systems
Figure 4.31 BOD/COD of the BMBR and YMBR Effluent
90
91
92
93
94
95
96
97
98
99
100
BMBR-16h
BMBR-24h
YMBR-16h
YMBR-24h
BOD
Remo
val Efficiency
(%)
0.00 0.01 0.02 0.03 0.04 0.05 0.06 0.07 0.08 0.09 0.10
BOD/COD
16 h
24 h
HRT
BMBR
YMBR
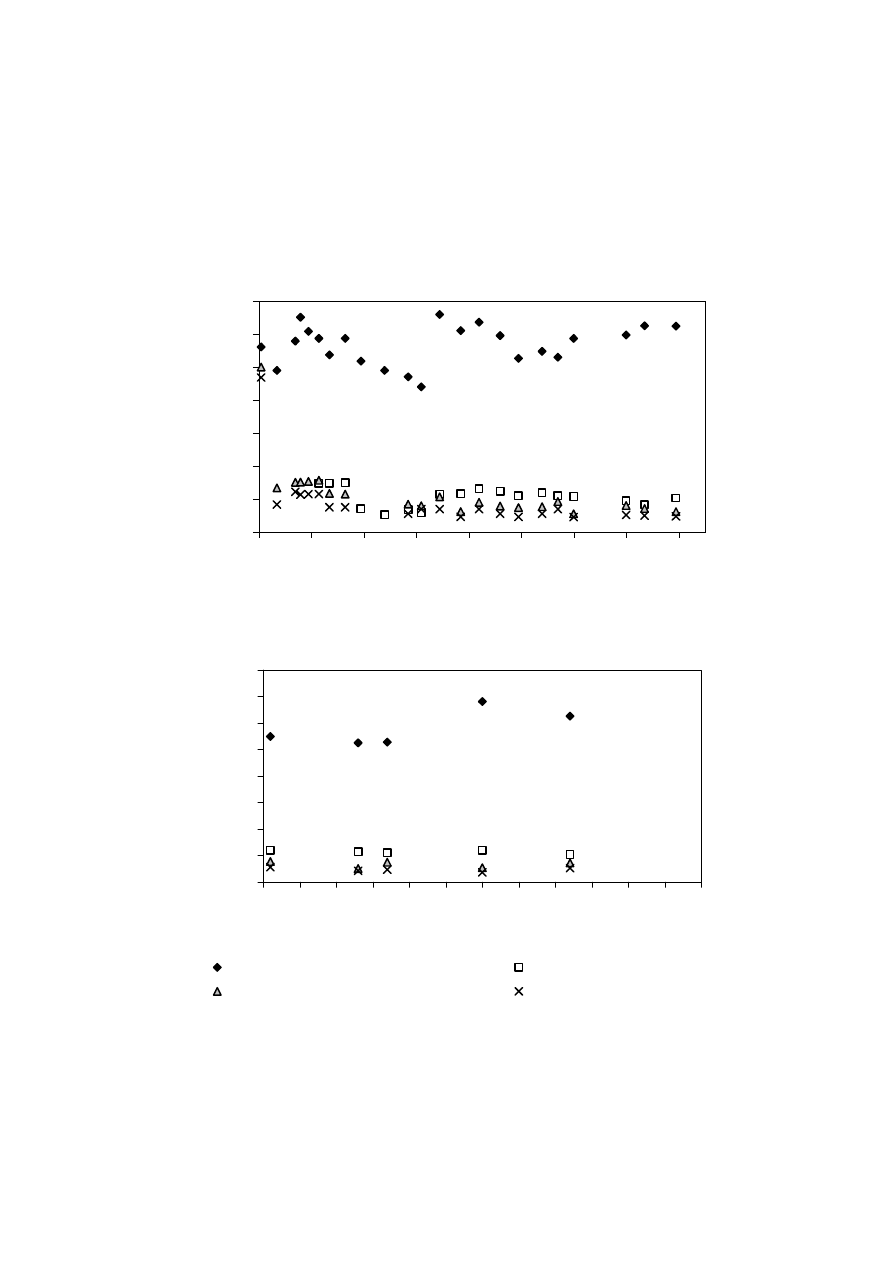
103
(3) TKN Removal Efficiency
The TKN Removal was high due to the presence of ammonia stripping process. The
TKN of the influent was around 1,700 mg/L. The TKN of the stripped leachate was found
to be around 320-340 mg/L for 16 and 24 h HRT. The TKN of the influent, stripped
leachate and effluent along with effluent ammonical concentration for 16 and 24 h HRT in
the BMBR and YMBR systems is given in Figure 4.32 and 4.33, respectively.
(a)
(b)
Figure 4.32 Influent and Effluent Nitrogen Content in BMBR at (a) 16 h HRT and
(b) 24 h HRT
0
300
600
900
1200
1500
1800
2100
0
20
40
60
80
100
120
140
160
Time (days)
Con
centra
tion
(mg/L
)
0
300
600
900
1200
1500
1800
2100
2400
0
5
10 15 20 25 30 35 40 45 50 55 60
Time (days)
Concen
tration
(mg/L)
TKN (Raw Leachate)
TKN (Stripped Leachate)
TKN (BMBR Effluent)
NH4+-N (BMBR Effluent)
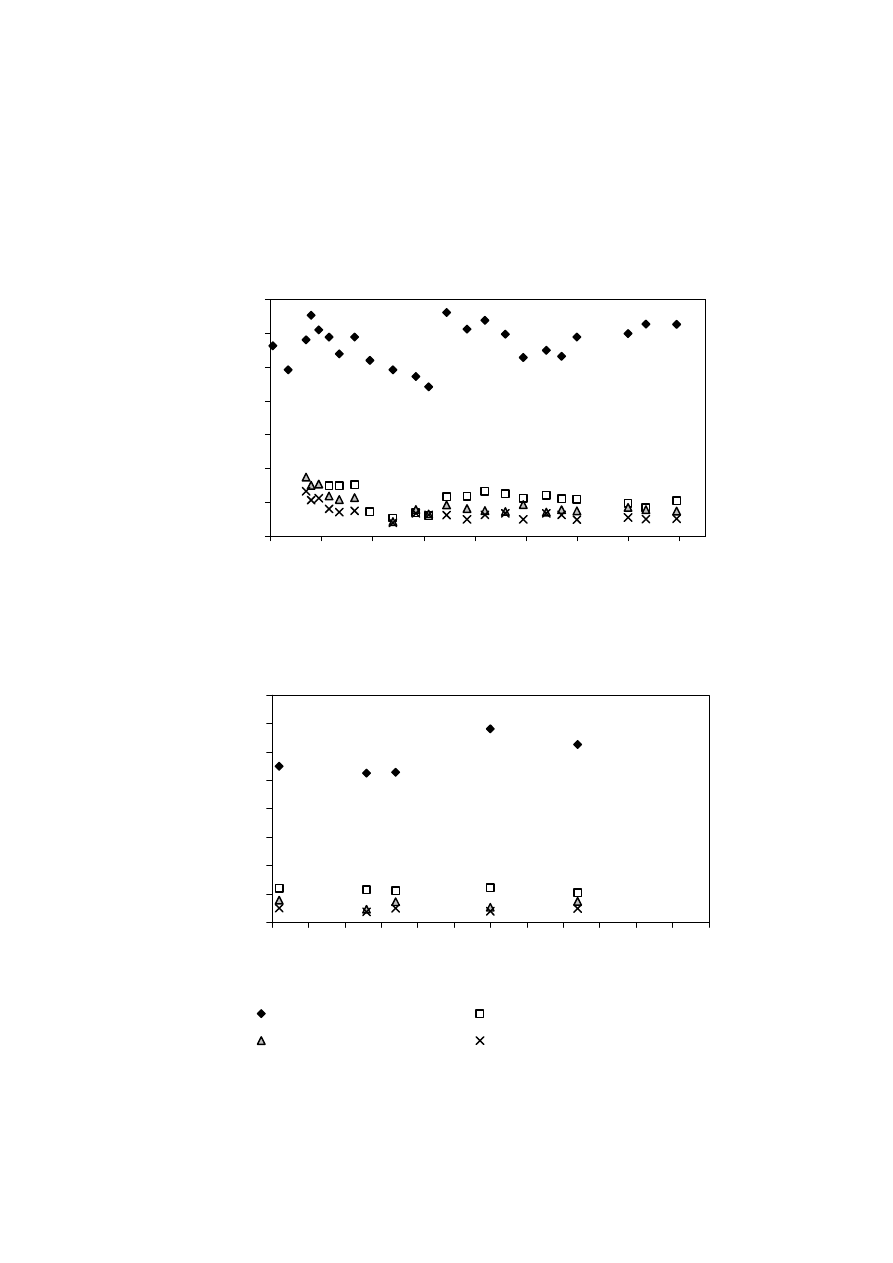
104
The TKN removal in the BMBR and the YMBR reactor showed some difference
with change in HRT. In the BMBR system, the effluent TKN and ammonical nitrogen
concentration at 16 h HRT was 300 and 216 mg/L, while at 24 h HRT was 200 and 140
mg/L, respectively. In the YMBR system, the effluent TKN and ammonical nitrogen
concentration at 16 h HRT was 280 and 200 mg/L, while at 24 h HRT was 193 and 130
mg/L, respectively. This showed that the 24 h HRT was more effective in TKN removal.
(a)
(b)
Figure 4.33 Influent and Effluent Nitrogen Content in YMBR at (a) 16 h HRT and
(b) 24 h HRT
0
300
600
900
1200
1500
1800
2100
0
20
40
60
80
100
120
140
160
Time (days)
Concentration
(mg/L)
0
300
600
900
1200
1500
1800
2100
2400
0
5
10 15 20 25 30 35 40 45 50 55 60
Time (days)
Conc
entratio
n
(m
g/
L)
TKN (Raw Leachate)
TKN (Stripped Leachate)
TKN (YMBR Effluent)
NH4+-N (YMBR Effluent)
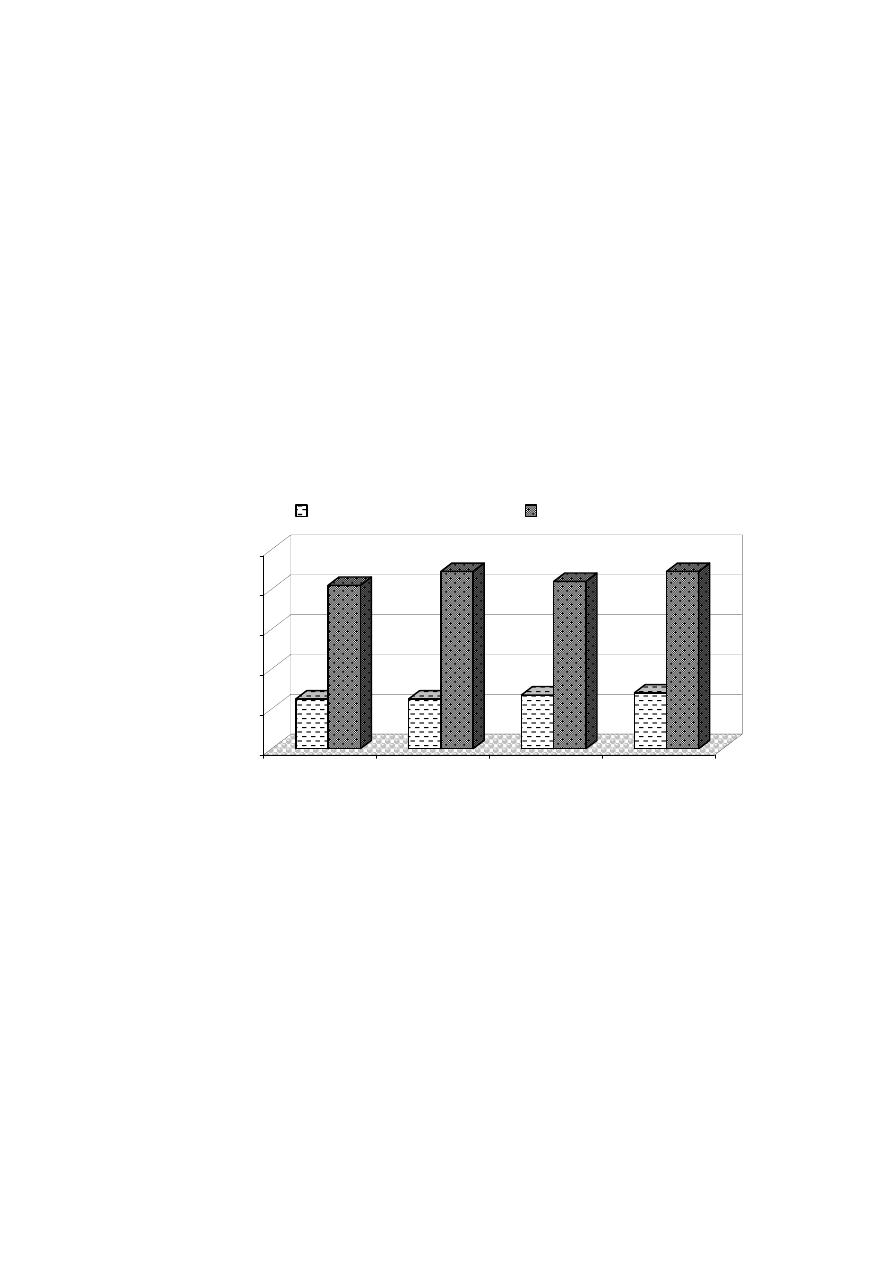
105
Figure 4.34 gives the overall TKN removal with and without ammonia stripping in
the BMBR and YMBR at 16 and 24 h HRT. The TKN removal was better in YMBR
compared to that of BMBR, though the difference was found to be very less. The TKN
removal in all conditions was found to be greater than 80%.
The TKN removal in the ammonia stripped membrane bioreactor took place at two
stages. Though the removal through ammonia stripping was predominantly by ammonia
stripping process, some amount of TKN was removed in the membrane bioreactor. Figure
4.35 gives the difference between TKN removal with and without ammonia stripping at 16
and 24 h HRT in BMBR and YMBR systems.
The 24 h HRT showed a better removal than at 16 h HRT. The difference in TKN
removal with and without ammonia stripping in both the MBR systems was found to be
much greater in 24 h HRT than in 16 h HRT.
Figure 4.34 Overall TKN Removal in BMBR and YMBR with and without
Ammonia Stripping
0
20
40
60
80
100
TKN
Removal
(%)
BMBR-16h
BMBR-24h
YMBR-16h
YMBR-24h
Without Ammonia Stripping
With Ammonia Stripping
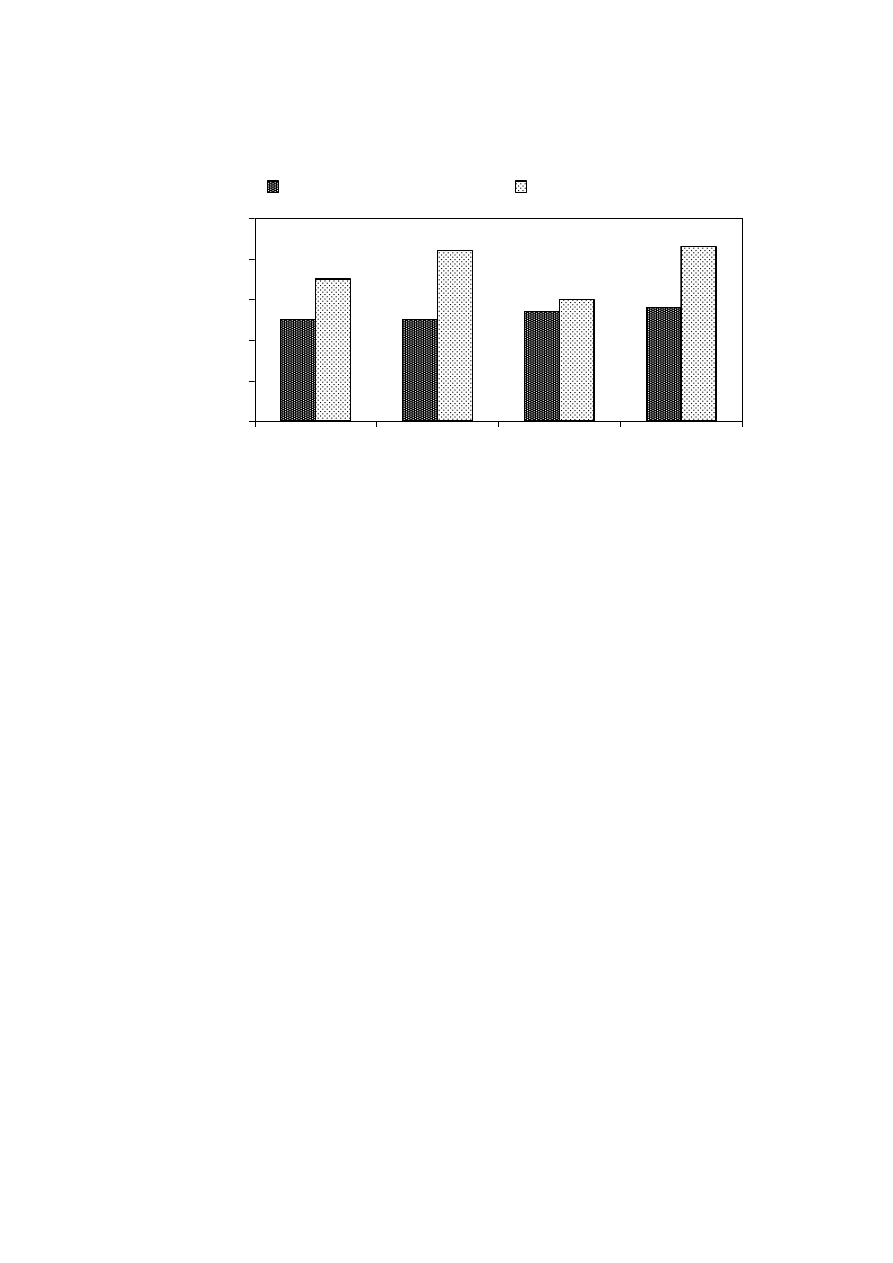
106
Figure 4.35 TKN Removal in MBR Process at 16 and 24 h HRT
4.5 Other Studies
4.5.1 Biodegradability of the Leachate
Landfill leachates are usually compared to complex industrial wastewater streams
which contain both toxic organic and inorganic contaminants (Krug and McDougall, 1988).
Toxic and hazardous compounds can originate from landfill leachate as a result of soluble
components of solid and liquid wastes being leachate into surface and groundwater.
The COD present in any wastewater can be categorized into two fractions:
biodegradable and non-biodegradable COD. The non-biodegradable COD has two sub-
fractions consisting of dissolved non-biodegradable organics and suspended non-
biodegradable organics. The same way, the biodegradable COD has two fractions
comprising dissolved readily biodegradable organics (S
s
) and suspended slowly
biodegradable organics (X
s
) (Ekama, et al., 1986; Vanrolleghem, et al., 1999).
Respirometric method could be effective in measuring the biodegradable component of the
landfill leachate. During the feed period the rate of supply of S
s
is due to that added via the
influent feed and that realized to the liquid via hydrolysis of X
s
. After the supply of S
s
from
the feed ceases; OUR immediately drops to the value, which is fixed by the rate of S
s
supply from the hydrolysis of slowly degradable particular COD, Xs. In a batch test, an
exponential decrease can be observed in respirogram after an initial peak formed due to the
presence of S
s
in the leachate. The concentration of X
s
can also be assessed in a similar
way (Kappeler and Gujer, 1992).
To find out the biodegradable component present in the leachate, a leachate substrate
concentration of 43.2 mg COD/L was injected into respirometer containing a sludge
concentration of 924 mg VSS/L. OUR was measured at a temperature of 30
o
C. The
variation in OUR with time is shown in Figure 4.36. The readily biodegradable COD
0
10
20
30
40
50
BMBR-16h
BMBR-24h
YMBR-16h
YMBR-24h
TKN Removal
(%
)
Without Ammonia Stripping
With Ammonia Stripping
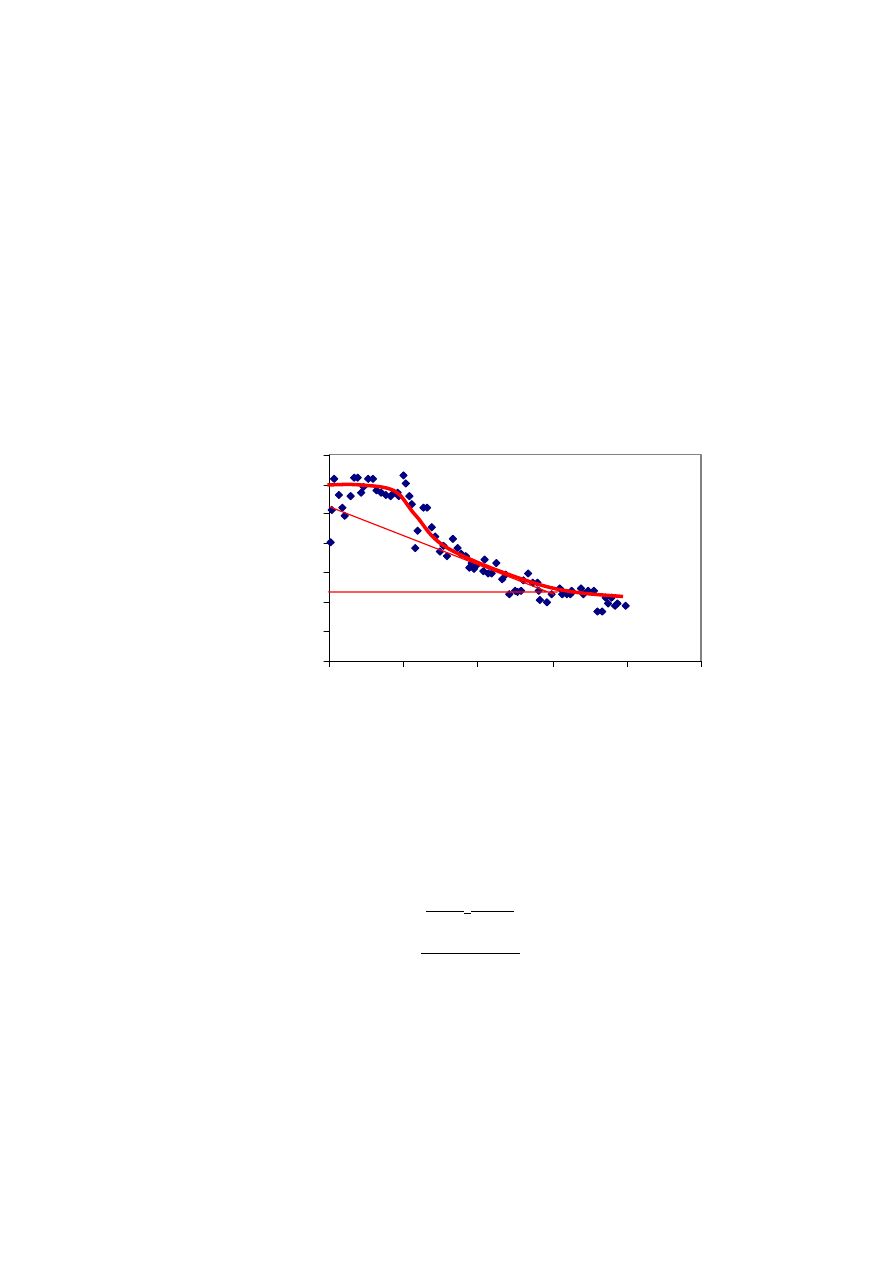
107
fraction and slowly biodegradable COD fraction in the influent are related to the oxygen
utilization. The former is proportional to the area between the initial high OUR plot and
horizontal line projected to the vertical axis at the level of the second OUR plateau (Area I).
The latter is proportional to the area II. Area II includes the utilization rate of endogenous
sludge. The oxygen utilization in the two phases is given as follows:
Area I = OUR * Time * MLVSS * Volume of respirometer
=
8.57
mg
O
2
Area II = OUR * Time * MLVSS * Volume of respirometer
=
12.89
mg
O
2
Figure 4.36 Change of OUR at Different Time Period for Leachate Sample
After obtaining the oxygen consumption, the yield coefficient was calculated by the
formulae,
Yield coefficient (Y) = COD
T
– OC
COD
T
= 38.88 – 21.46 = 0.45
38.88
Where,
COD
T
= Total COD
OC
=
Oxygen
Consumption
The readily biodegradable COD (S
s
) and slowly biodegradable COD (X
s
) can be
calculated as follows:
0.000
0.002
0.004
0.006
0.008
0.010
0.012
0.014
0
100
200
300
400
500
Time (min)
OU
R
(
m
g/
m
g.
h)
Area I
Area II

108
S
s
= Oxygen consumption for S
s
* 100
Eq. 4.4
(1-Y) * COD
T
X
s
= Oxygen consumption for X
s
* 100
Eq. 4.5
(1-Y) * COD
T
Where,
Oxygen consumption for S
s
= Area I
Oxygen consumption for X
s
= Area II
Based on the area covered by the curve (area I), readily biodegradable COD, is equal
to 40% of total area while area II, slowly biodegradable COD, is equal to 60% of total area.
Thus, it could be said that among the biodegradation COD, readily degradable components
are just 40% compared to that of the slowly degradable component. This shows the
recalcitrant nature of the leachate and the requirement of a long HRT for complete
degradation of the biodegradable components. Based on the result, the estimated readily
biodegradable COD can be degraded within 12 h.
Though OUR experiments suggest the readily biodegradable and slowly
biodegradable components of the biodegradable COD, it does not actually tell the total
biodegradable content present in the leachate. To further investigate on this aspect, a 20
days BOD was measured. It has suggested by Henze (1992) that the fractions of organic
matter in wastewater which are measured in terms of OUR and BOD
5
are similar. Thus,
the relation between the COD fraction and BOD concentration may suggest the
biodegradability of the leachate.
When the 20 days BOD of the raw leachate, stripped leachate, bacterial and the yeast
effluent were measured, the trend of increase in BOD was similar for raw and stripped
leachate. The trend of increase in BOD for the yeast and bacterial effluent for the first 10
days was similar. The trend of the 20 days BOD is given in Figure 4.37 and 4.38. The raw
data is given in Table H-1 of Appendix H.
After first 10 days, the BOD of the bacterial effluent did not vary significantly
compared to that of the yeast effluent. Table 4.14 gives contribution of percent BOD of the
total BOD for leachate influent and effluent ay different time periods.
Table 4.14 Contribution of BOD at 5, 10 and 15 Days to the Total 20 Days BOD
Percent BOD of 20 days BOD
Day
Raw
Leachate
Stripped
Leachate
YMBR
Effluent
BMBR
Effluent
BOD
5
(mg/L)
67 47 25 38
BOD
10
(mg/L)
86 85 44 63
BOD
15
(mg/L)
94
100
81
75
BOD
20
(mg/L)
100 100 100 100
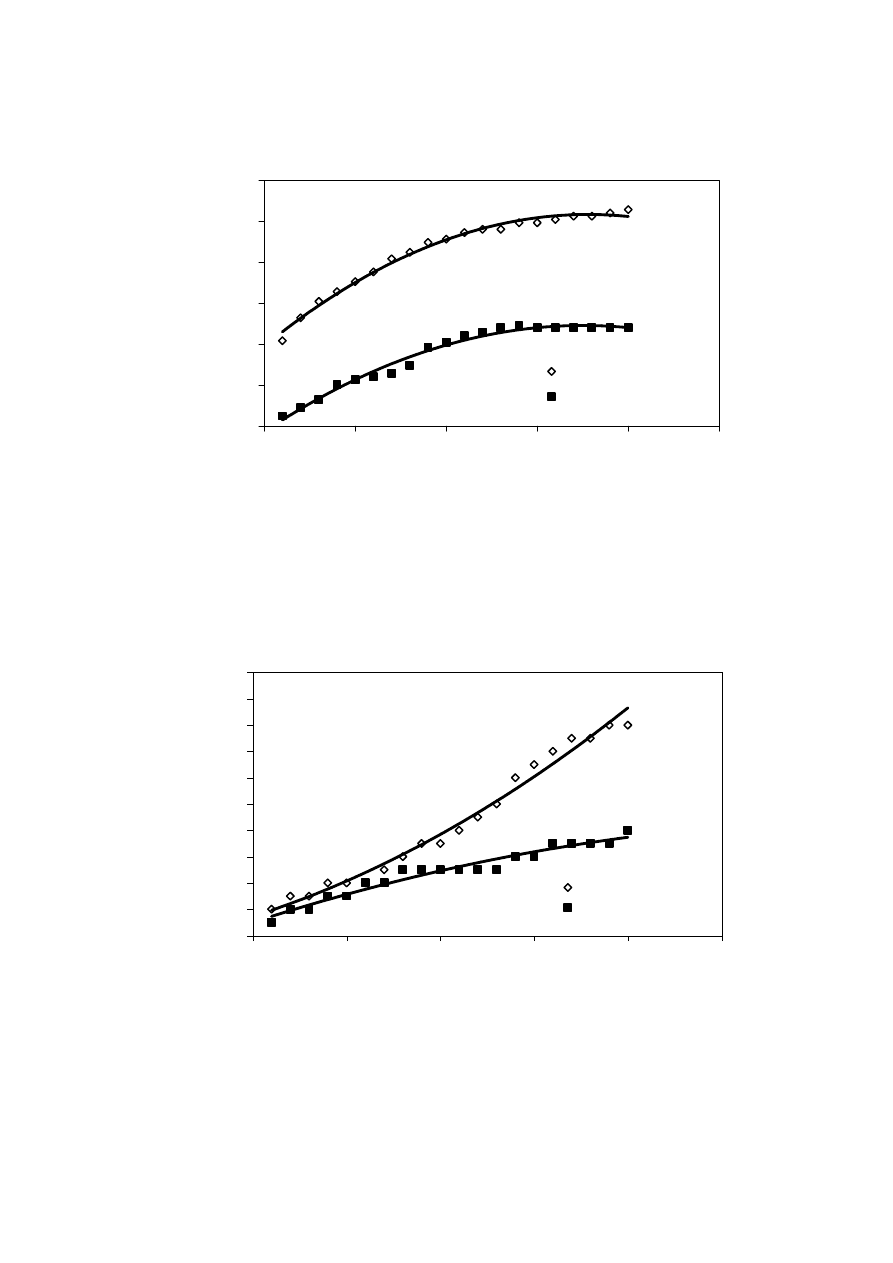
109
Figure 4.37 20 Days BOD of the Raw Leachate and Stripped Leachate
Figure 4.38 20 Days BOD of the YMBR and BMBR Effluents
R
2
= 0.98
R
2
= 0.96
0
10
20
30
40
50
60
70
80
90
100
0
5
10
15
20
25
Time (Days)
BOD (mg/L)
YMBR Effluent
BMBR Effluent
R
2
= 0.99
R
2
= 0.98
0
1000
2000
3000
4000
5000
6000
0
5
10
15
20
25
Time (Days)
BOD (mg/L)
Raw Leachate
Stripped Leachate

110
From the data obtained above, it can be seen that 5 days BOD contributes to about
67% of the 20 days COD present in the raw leachate, while in the BMBR and YMBR
effluent; the 5 days BOD contributed only 38 and 25% of the 20 days BOD. This shows
that compared to that of the raw leachate, the effluents of the membrane bioreactors take a
longer time to degrade the organics suggesting the presence of greater amount of slowly
biodegradable organics. In comparison between YMBR and BMBR effluents, slowly
biodegradable organics in YMBR effluent was higher than that in BMBR effluent.
When the BOD/COD ratio for raw leachate was considered, it was found that
BOD
5
/COD was 0.45 which increased to a BOD
20
/COD of 0.68 after 20 days. This
suggests that the degradable component in the raw leachate is almost 68%. The
BOD
5
/COD of both the bacterial and yeast effluent was found to be 0.01. Though, the
bacterial and yeast effluent had a similar BOD
5
/COD ratio, the BOD
20
/COD ratio of the
bacterial and yeast effluent varied with a ratio of 0.02 and 0.04, respectively. This also
suggests that the slowly degradable components are more in the yeast effluent in
comparison with bacterial effluent.
4.5.2 Molecular Weight Cut-off
The organic matter present in the leachate varies and is dependent on the waste
composition and degree of degradation. The medium molecular weight compounds with
molecular weight (MW) between 500 and 10,000 Da are dominated by carboxylic and
hydroxylic groups with fulvic acid and humic fraction also contributing to this fraction in
the leachate (Chian and DeWalle, 1976; Harmsen, 1983). They are difficult to degrade and
are termed refractory. The fulvic and humic-like compounds present in leachate are formed
from micobiological processes from the intermediate products of degradation of polymeric
organic compounds such as lignine (Andreux, 1979).
The high molecular weight organics are usually stable to degradation. The
effectiveness of a treatment process can be related to the removal of specific organic
fraction in leachate. Both fulvic and humic substances are inert to biological treatment.
Therefore, fractionating the COD based on molecular weight can act as an indicator to the
removal efficiency and degradation potential of the biological system.
According to the results, the molecular weight distribution or molecular weight cut-
off (MWCO) was computed by measuring the COD concentration of each fraction and the
volume filtered. The transformation of organic substances corresponding to the change of
COD mass is shown in Figure 4.39. Detailed calculation is given in Table H-3 of Appendix
H.
As shown in the figure, the raw leachate contained a higher fraction of high
molecular weight compounds (> 50 k). The low-molecular weight fractions, which include
lower molecular weight compounds, were present at low fraction. Figure 4.40 shows
percent COD contribution of various molecular weight components to the total COD in
raw leachate, stripped leachate, bacterial and yeast effluents.
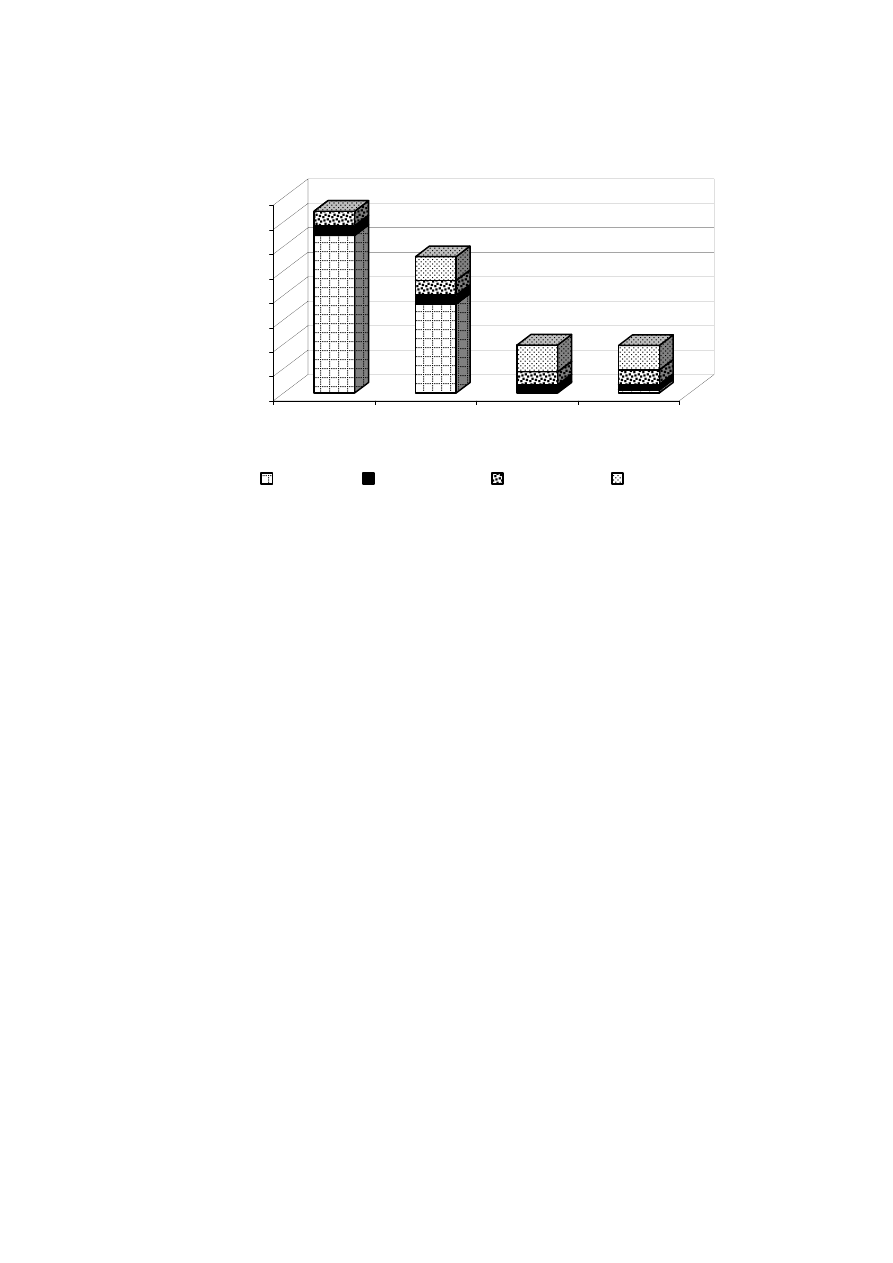
111
Figure 4.39 Molecular Weight Cut-off of Raw Leachate, Stripped Leachate, Bacterial
and Yeast Effluents
Figure 4.40 Percent Contribution of Various Molecular Weight Compounds to the
Total
COD
The compounds greater than 50 k molecular weight contributed almost 80% of the
raw leachate COD. It could be found that some portion of the > 50 k compounds is broken
down into < 5 k after ammonia stripping. This is indicated by the increase of < 5 k
compounds. The > 5 k fraction in the raw leachate after stripping increased from 0 to 17%,
while the > 50 k fraction reduced from 87 to 65%. The 10-50 k and 5-10 k fraction did not
increase significantly. The increase in 10-50 k and 5-10 k fractions was from 5 to 6% and 8
to 11%, respectively. Yoon, et al. (1998) showed that about 72-89% of the organics greater
than MW 500 could be removed and 42% of the organics with less than MW 500 could be
removed from the leachate using Fenton’s process. However, it was noticed that Fenton’s
process was not effective in removing organics less than MW of 500.
The MWCO after MBR treatment indicated notable reduction in > 50 k fraction. The
> 50 k fraction reduced to 3% in the yeast effluent and 7% in the bacterial system. The
lower molecular weight compounds with MW 10-50 k, 5-10 k and >5 k in the yeast
effluent increased by 3 to 9%, 7 to 19% and 18 to 65%, respectively. These fractions
increased from 6 to 12%, 11 to 31% and 18 to 69%, respectively in the bacterial system.
Using the aerated lagoon for the treatment of leachate, it was found that only 19-28% of
the total leachate organics was composed of organics less than MW 500 in the effluent
0
1000
2000
3000
4000
5000
6000
7000
8000
COD (
m
g/L)
Raw
Leachate
Stripped
Leachate
Yeast
Effleunt
Bacterial
Effluent
MW>50k
MW 10k-50k
MW 5k-10k
MW<5k

112
(Yoon, et al., 1998). This shows that the complex higher molecular weight compounds
could be degraded effectively using membrane bioreactor systems. For the yeast and
bacteria effluent, the increase of the COD of below 5 k MW fraction could be explained by
the biodegradation of high molecular weight organic substances to compounds below 5 k
MW, as confirmed by the decrease of the COD of the 5 k MW UF retentate. Similar
results were obtained while treating leachate in aerobic and anaerobic system by Gourdon,
et al. (1989). The studies also revealed that recalcitrant organics were non-degradable in
anaerobiosis, while it could be degraded to 50% in aerobic conditions.
The COD removal after the membrane bioreactor treatment was from 7,500 mg/L to
about 1,950 mg/L in both the reactors. Among the COD of 7,500 mg/L, about 5,500 mg/L
was removed by the membrane bioreactor system, either through degradation for energy
consumption or through assimilation.
To further understand the degradable components present in the leachate and their
molecular weight distribution, another sample was analyzed with BOD along with COD
after fractionation. Figure 4.41 and 4.42 gives the COD and BOD contribution of
compounds at different molecular weight. Table H-4 of Appendix H gives the detailed
calculation of the results. In the second sample showed a slight difference from the first
sample. The > 50 k fraction decreased from 91% to 72% and corresponding increase of the
< 5 k from 0 to 18%.
When the analysis of the molecular weight fractions having organic matter below
MW 500 of the leachate was done, it has been shown that they contain synthetic organics
and solvents such as aromatic and alcoholic groups. Phenols, amines and chlorinated
organics were also found in this fraction. As suggested earlier, the fractions in 5 k to 10 k
and higher molecular weight contained humic and fulvic substances, along with products
of municipal dumping and natural fermentation (Slater, et al., 1985). In another study on
leachate sample suggested that relatively high concentrations of carbohydrates could be
observed in a high molecular weight fractions and substantial quantities of aromatic
hydroxyl and carboxylic compounds present in the lower molecular weight fraction (Chian,
1977).
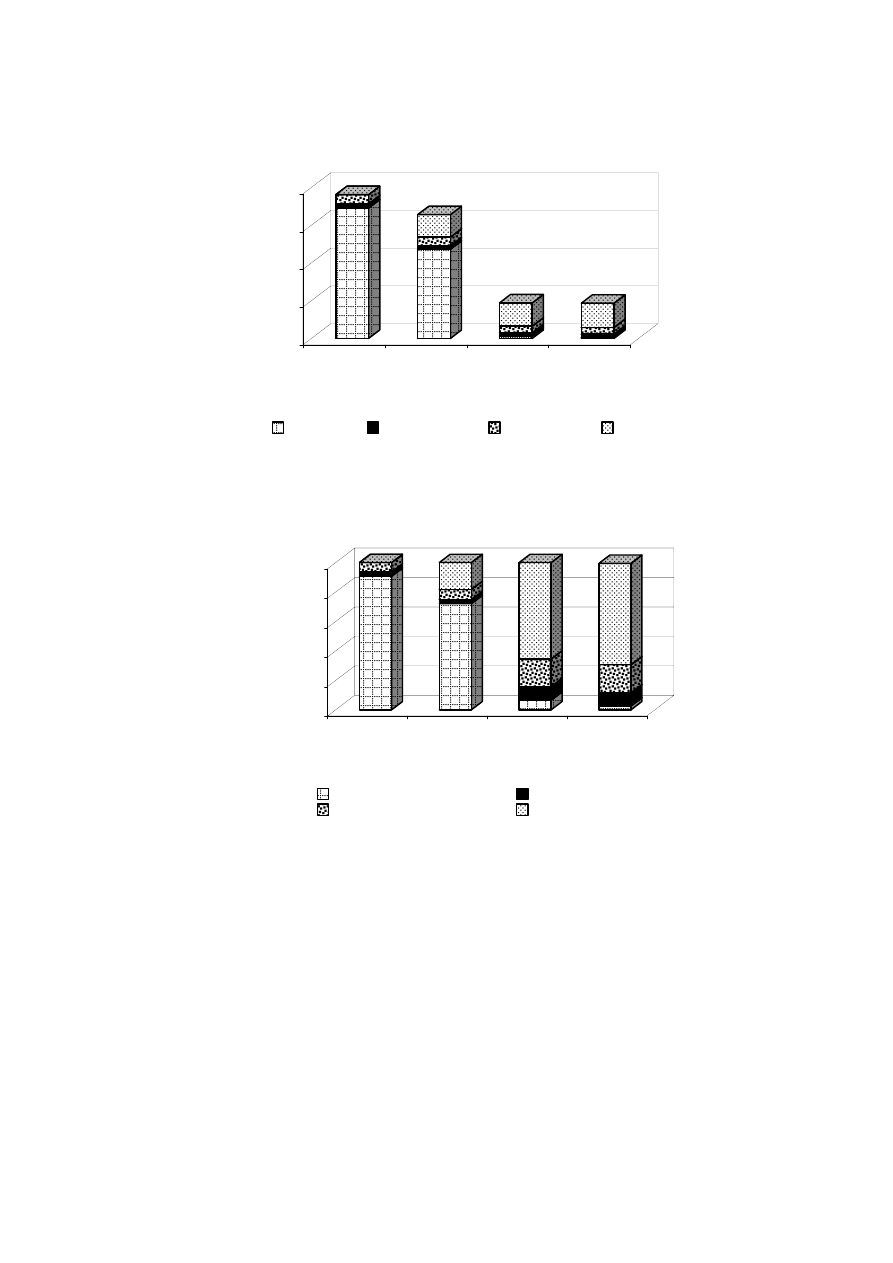
113
Figure 4.41 Molecular Weight Cut-off of Leachate (a) COD (mg/L) (b) COD (%)
0
2000
4000
6000
8000
COD (mg/L
)
Raw
Leachate
Stripped
Leachate
Yeast
Effleunt
Bacterial
Effluent
MW>50k
MW 10k-50k
MW 5k-10k
MW<5k
(a)
0
20
40
60
80
100
CO
D (%)
Raw
Leachate
Stripped
Leachate
Yeast
Effleunt
Bacterial
Effluent
MW>50k
MW 10k-50k
MW 5k-10k
MW<5k
(b)
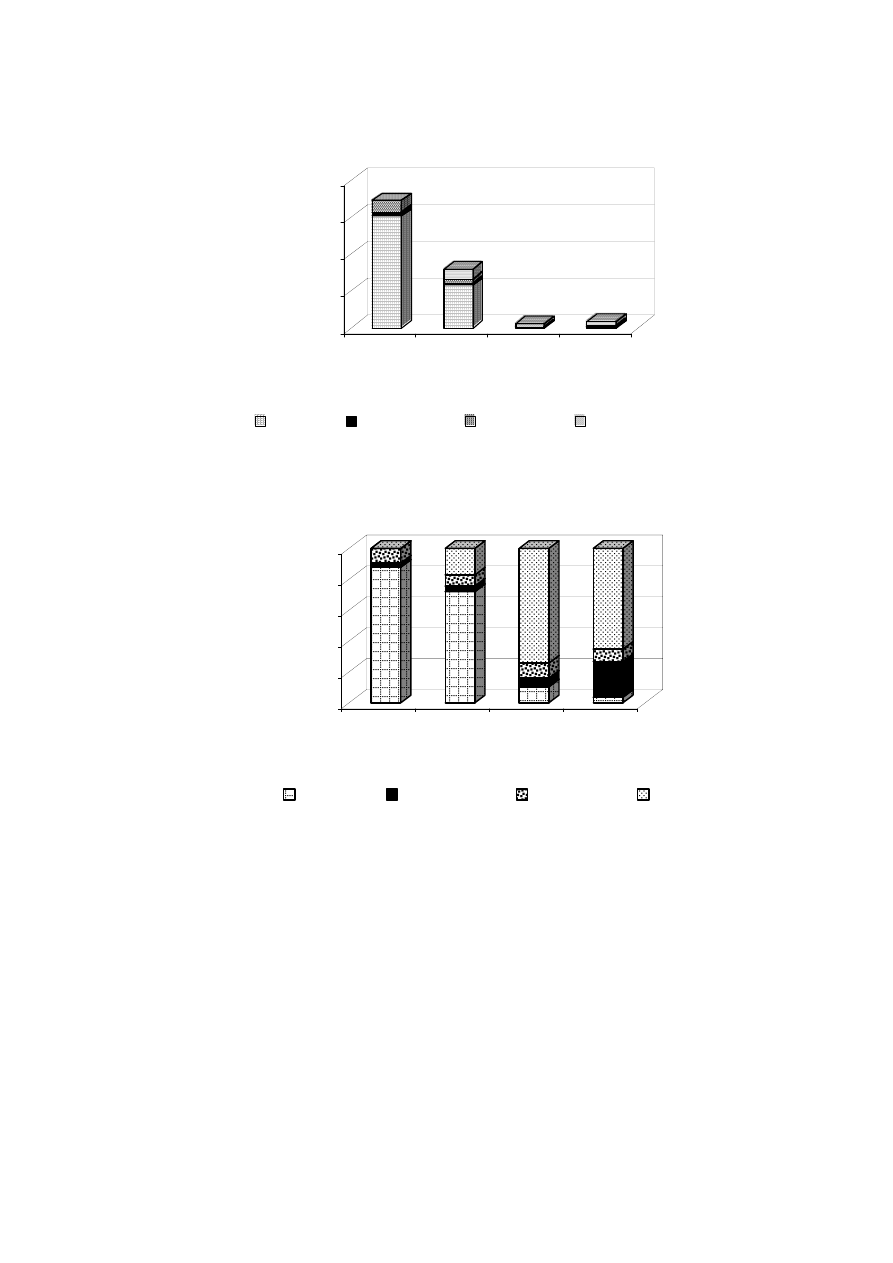
114
Figure 4.42 Molecular Weight Cut-off of Leachate (a) BOD (mg/L) (b) BOD (%)
While analyzing the BOD content of the fractions, it was found that 88% (BOD) of
91% (COD) of the > 50 k fraction was biodegradable. As this could be confirmed by the
3% remaining > 50 k COD content in the bacterial effluent after membrane bioreactor
treatment. Looking at the BOD content in the effluent, it was found that in the yeast as well
as the bacterial effluent < 5 k molecular weight components contributed to the maximum
BOD when compared to the other fractions. The COD content also showed a similar trend.
0
1000
2000
3000
4000
B
OD (
m
g/
L
)
Raw
Leachate
Stripped
Leachate
Yeast
Effleunt
Bacterial
Effluent
MW>50k
MW 10k-50k
MW 5k-10k
MW<5k
0
20
40
60
80
100
BO
D (%)
Raw
Leachate
Stripped
Leachate
Yeast
Effleunt
Bacterial
Effluent
MW>50k
MW 10k-50k
MW 5k-10k
MW<5k
(b)
(a)

115
Though, the obtained COD removal efficiency of both systems was slightly different,
the majority of organic concentrations in both effluents were in the lower molecular weight
range indicating that yeast and bacteria were effective in degrading high molecular weight
organics. The high molecular weight organics may be highly refractory organics (Hosomi,
et al., 1989). However, the effluent from both systems still consists of the medium
molecular weight organics such as fulvic acid which are unaffected by biological
treatment. It could be further treated with post treatment such as ozonation, increasing the
biodegradable organics or even elevating the water quality of the final effluent.
4.5.3 Sludge Properties
In the membrane coupled biological treatment systems, complete separation of
microorganisms is possible; thus, high microbial concentration as well as excellent effluent
quality (Kim, et al., 1998) can be achieved. The membrane biofouling could be largely
affected by physico-chemical characteristics and the physiology of the activated sludge as
well as the membrane materials (Sato and Ishii, 1991; Pouet and Grasmick, 1995; Chang,
et al., 1996) Therefore, the sludge properties of the membrane bioreactors are important in
terms of membrane fouling and sludge dewaterability. Dewaterability is usually measured
in terms of Capillary Suction Time (CST) for evaluating the performance of sludge
dewatering. Sludge Volume Index (SVI) is another indicator used to measure the
settleability of the sludge. The bacterial sludge showed a better dewatering quality
compared to that of the yeast system as shown in Table 4.15. As suspended solids also
affect the sludge properties, the MLSS was also measured. Higher viscosity and
dewaterability could be attributed to the difference between MLSS of mixed bacteria
sludge and mixed yeast sludge. But, the difference in the MLSS was not found to be large.
Table 4.15 Sludge Properties in the YMBR and BMBR Systems
Sample Reactor DSVI
(ml/gSS) Viscosity (cP) CST (s/g SS)
SS (mg/L)
YMBR not
settle
6.24
-
-
1
BMBR not
settle
13.00
-
-
YMBR not
settle
6.30
128 13,267
2
BMBR 79
9.78 12 14,133
YMBR not
settle
-
126 13,367
3
BMBR 60
-
10 13,233
Though the bacterial sludge showed a better dewaterability, the viscosity of the
bacterial system was found to be more than that of the yeast system. The content of micro-
floc components, such as EPS might have an influence on the permeability (Kim, et al.,
1998). This could be one of the reasons for a frequent membrane fouling in the bacterial
system compared to that of the yeast system. Along with the MLSS, MLVSS of the sludge
was also measured as given in Table 4.16.
When MLVSS/MLSS was measured, it was found that the bacterial sludge had a
lower degradability (0.6) compared to that of the yeast sludge (0.7). However, the
difference between the degradability of the bacterial sludge and yeast sludge was not much.

116
Table 4.16 MLSS and MLVSS Concentrations in Yeast and Bacteria Reactors
Sample Reactor MLSS
(mg/L) MLVSS (mg/L)
MLVSS/MLSS
YMBR 12,750
9,866
0.77
1
BMBR 12,867
8,467
0.66
YMBR 13,267
9,834
0.74
2
BMBR 14,133
9,066
0.64
YMBR 12,433
9,667
0.78
3
BMBR 12,167
8,167
0.67
YMBR 13,367
9,833
0.74
4
BMBR 13,233
8,333
0.63
4.5.4 EPS Formation
The sludge surface is polymeric in nature comprising of protein, polysaccharides,
nucleic acid and lipid (Goodwin and Foster, 1985). These extracellular polymeric
substances excreted by the microorganisms in the microbial floc are a major foulant in the
membrane coupled activated sludge process (Chang, et al., 1996; Nagaoka, et al., 1996).
So, in addition to the sludge properties, EPS of the mixed liquor of the bacterial and yeast
system was measured. Table 4.17 and 4.18 summarizes the variation in bound and soluble
EPS of YMBR and BMBR. The EPS components could be sub-divided into two parts;
namely the bound and soluble EPS. The bound EPS corresponds to the polymeric
substances adhered together with each other and to the microorganisms. The soluble EPS
indicates the microbial products which have been produced by the microorganisms and
suspended in the mixed liquor in a soluble form. Both the bound and soluble EPS were
measured as TOC.
Table 4.17 Bound EPS Concentration in the YMBR and BMBR Systems
Sample Reactor
MLSS
(mg/L)
TOC
(mg/g SS)
Protein
(mg/g SS)
Carbohydrate
(mg/g SS)
Protein/Carbohydrate
1 YMBR
12,750 46.7 35.4
24.1
1.47
BMBR
12,867
47.3
35.5 26.2
1.35
2 YMBR
13,267 43.5 34.5
21.0
1.64
BMBR
14,133
42.3
30.6 25.0
1.23
Table 4.18 Soluble EPS Concentration in the YMBR and BMBR Systems
Sample Reactor
MLSS
(mg/L)
TOC
(mg/g SS)
Protein
(mg/g SS)
Carbohydrate
(mg/g SS)
Protein/Carbohydrate
1 YMBR
12,750 133.1 53.4
41.2
1.29
BMBR
12,867
138.3
74.8 44.9
1.66
2 YMBR
13,267 123.2 50.3
46.9
1.07
BMBR
14,133
147.9
72.1 46.4
1.55
While measuring the bound and soluble EPS of the bacterial and yeast system, it was
found that in comparison between YMBR and BMBR, bound EPS concentration in terms
of TOC was not different while, soluble EPS of mixed bacterial sludge was higher than
that of mixed yeast sludge. Thus, this indicates soluble EPS could be the factor affecting
the membrane biofouling. In the soluble EPS, the protein content was also less. A yeast

117
cake used on the top of the membrane usually acts as a secondary membrane which retains
protein aggregates, reducing protein fouling of the primary membrane (Guell, et al., 1999).
These could be the reasons for lower membrane fouling in the yeast membrane.
The protein and carbohydrates form the main component of the EPS; because of
these the EPS components were also measured. It is also interesting to note that the protein
to carbohydrate ratio in the bound EPS was higher in yeast reactor than the bacterial
reactor and the protein to carbohydrate ratio in the soluble EPS was higher in the bacterial
reactor than the yeast reactor. This may suggest that higher protein to carbohydrate ratio
plays a more important role in membrane fouling, if present in the soluble EPS rather than
that of the bound EPS.
4.5.5 Conductivity and TDS
As the TDS and conductivity are also important parameters for determining leachate
quality, the TDS and conductivity was monitored for a short period. The average
conductivity and TDS of raw leachate were found to be 29,213 µS/cm and 14,603 mg/L,
respectively. After stripping, the leachate contained an average conductivity of 42,255
µS/cm and average TDS of 21,128 mg/L. For YMBR and BMBR systems, the
conductivity and TDS concentration were not different (Table 4.19). The TDS and the
conductivity exceeded the effluent discharge standards.
Table 4.19 Conductivity and TDS Concentrations in Leachate and Effluents
Conductivity (µS/cm)
Sample
Raw
Leachate
Stripped
Leachate
YMBR
Effluent
BMBR
Effluent
YMBR
Reactor
BMBR
Reactor
1 30,060 43,140 40,980 40,830 36,690 37,530
2 29,640 42,360 36,090 35,760 36,990 38,130
3 29,040 41,310 38,940 41,400 37,650 39,180
4 28,110 42,210 36,930 36,600 35,940 35,010
Average
29,213 42,255 38,235 38,648 36,818 37,463
TDS (mg/L)
Sample
Raw
Leachate
Stripped
Leachate
YMBR
Effluent
BMBR
Effluent
YMBR
Reactor
BMBR
Reactor
1 15,030 21,570 20,490 20,400 18,360 18,750
2 14,820 21,180 18,060 17,880 18,480 19,050
3 14,520 20,640 19,470 20,670 18,840 19,590
4 14,040 21,120 18,450 18,300 17,970 17,520
Average
14,603 21,128 19,118 19,313 18,413 18,728
4.5.6 Cost Analysis for Operation
To further compare the overall performance of the bacterial and yeast membrane
bioreactor, the cost analysis of the two systems was done. Table 4.20 gives the cost of
chemicals used for pH adjustment. Table 4.21 gives the overall treatment cost for each

118
treatment cost. Chemical cost required for MBR operation with and without ammonia
stripping is given in Table H-5 and H-6 of Appendix H.
Table 4.20 Cost of Chemical Used for pH Adjustment
Item
Equipments and Chemicals
Quantity
(unit)
Cost
(Baht)
1
NaOH (commercial grade)
25 kg/pk
750
2 H
2
SO
4
(commercial grade)
30 L/container
420
While comparing the chemical cost required for the bacterial and yeast membrane
bioreactor, it was found that the cost required for leachate treatment using the bacterial
system is lower than that of the yeast system, though the difference between the two
systems was not much.
Table 4.21 Total Chemical Cost Requirement for Each Treatment System
Treatment System
Chemical Cost (Baht/m
3
)
YMBR
93
BMBR 5
Coupling ammonia stripping with YMBR
662
Coupling ammonia stripping with BMBR
565
Ozonation (YMBR)
Oxygen cost for ozonation
665
4,800
Ozonation (BMBR)
Oxygen cost for ozonation
565
2,400

119
Chapter 5
Conclusions and Recommendations
This study investigated biological processes by using mixed yeast cultures and mixed
bacteria cultures for treating landfill leachate containing high organic and ammonium
nitrogen concentrations. Basic studies on biokinetic coefficient of yeast and bacteria sludge
were carried out. The effects of high ammonium nitrogen on the yeast and bacteria sludge
were evaluated using a respirometric method.
The main part of this study was focused on the membrane bioreactor. The potential
for developing a membrane bioreactor using mixed yeast sludge (YMBR) and mixed
bacteria sludge (BMBR) for treating raw leachate and stripped leachate was examined. The
last section of this study was focused on the sludge properties, and membrane performance
was investigated. The summary and conclusions drawn from the experimental results are
presented below.
5.1 Conclusions
1.
In a membrane bioreactor which was used to treat raw leachate, it was found that the
average COD removal efficiency of the YMBR was slightly higher than that of the
BMBR for varied HRT. The average COD removal efficiency in YMBR system was
65±2% when HRT was in the range of 16 to 24 h, whereas in BMBR system, the
average COD removal efficiency was 62±2% at the same range of HRT. At HRT of
12 h, the average COD removal efficiency in YMBR and BMBR were 60% and 51%,
respectively. The decrease in removal efficiency in the bacterial system at a lower
HRT was obviously seen. This can be due to the presence of ammonia in the leachate
which posed toxicity to the bacterial culture. In addition to a better COD removal
efficiency, YMBR was more stable than BMBR. This could be considered as a
specific advantage with the yeast sludge over the bacteria sludge.
2.
The average TKN removal efficiency for both YMBR and BMBR systems, treating
raw leachate at different HRT, was from 19-29% and 14-25%, respectively. The
concentration of nitrite and nitrate (NO
2
-
and NO
3
-
) in YMBR and BMBR effluents
were in the range of 0.8 to 6.4 mg/L and less than 1.0 mg/L, respectively. This can be
due to high organic and ammonium nitrogen concentrations and pH ranges.
3.
For the ammonia striping process, the average ammonia removal efficiency of 86%
could be achieved through a stripping process carried out with a high speed velocity
gradient (G) of 2,850 s
-1
at pH from 11 to 12 for 5 h.
4.
In MBR which was used to treat stripped leachate, it was found that the fluctuations
in terms of COD removal with ammonia stripping were lower than that without
ammonia stripping. The COD removal in both YMBR and BMBR with the ammonia
stripping was the same. Both the membrane reactors showed a COD removal of 72%
at 16 h HRT and 76% at 24 h HRT. It was clear that the ammonia stripping improved
the performance of COD removal of the BMBR much more than that of the YMBR
system as anticipated from the toxicity studies. The BOD removal in both YMBR
and BMBR systems was above 94%. This means that the membrane bioreactors were

120
efficient in the removal of the biodegradable organics in the leachate. At 24 h HRT,
the range of BOD concentration was from 30 to 55 mg/L which followed the present
effluent standard. Both YMBR and BMBR effluents, contained low BOD/COD ratio
indicated that there were high refractory organic substances, which may be due to the
contribution of the slowly biodegradable organics and non-biodegradable organics,
containing in the raw leachate. Whereas, the average TKN removal efficiency in all
conditions was greater than 80%.
5.
YMBR system gave significantly better reduction in the membrane fouling rate than
BMBR system. The trend of membrane clogging in BMBR was higher than in
YMBR with correspondingly higher transmembrane pressure. However, YMBR
might be operated with a relatively low pressure for a prolonged filtration cycle.
Therefore, the bacteria membrane frequently requires cleaning. The average filtration
time for the yeast system was 1.3-2.5 times of the bacteria system. As a result, yeast
in a MBR reactor can enhance membrane performance and has the potential to
improve the economics of treatment system because of the reduction of operational
problems and maintenance cost.
6.
For the biokinetic study, a comparative evaluation of the biokinetic parameters for
both yeast and bacteria sludge, which were used to treat leachate, illustrated that the
maximum specific growth rate (µ
max
) was less than the typical values for domestic
wastewater whereas yield coefficient (Y) was still in the range of domestic
wastewater. Additionally, the parametric group (µ
max
/Y.K
s
) for yeast and bacteria
treating leachate were 1.77 x 10
-3
and 3.06 x 10
-3
L/mg.h, respectively. This
indicated that the biodegradation of organics by yeast was less than that of bacteria.
It was confirmed that the biodegradation rates for both yeast and bacteria in treating
leachate were lower than that of domestic wastewater.
7.
The influence of ammonium nitrogen on a bacteria culture was very sensitive,
compared to a yeast culture. Also the values of biokinetic coefficients show that the
specific growth rate in a bacteria system was influenced by ammonium nitrogen. At
ammonium nitrogen concentration of 2,000 mg/L, the response of OUR inhibition in
a bacteria system was approximately 37%, whereas that in a yeast system was around
6%. Thus, the ammonia concentration slightly affected the yeast system but it
inhibited the microbial growth in the bacterial system. Moreover, ammonia stripping
was used to prevent the inhibition of the toxic compounds to the organisms and to
provide the better efficiency of the biological system.
8.
For the effect of lead on OUR inhibition of bacteria and yeast cultures, we found that
the soluble lead concentration of 2.38 mg/L in bacterial system showed 55%
inhibition with non-linear correlation while the soluble lead concentration of 1.50
mg/L gave 50% inhibition with linear correlation in yeast system.
9.
The total membrane resistance (R
t
) in this study was depended mainly on a cake
resistance (R
c
). This might be due to the cake layer deposited over the membrane
surface. The formation of cake layer plays a major role in flux decline during
filtration.
10. The BOD
5
/COD of both YMBR and BMBR effluents was 0.01. Whereas, the
BOD
20
/COD ratio of the YMBR and BMBR effluents varied with a ratio of 0.04 and

121
0.02, respectively. This can be considered that the slowly degradable components in
the yeast effluent are higher than that in the bacterial effluent.
11. The contribution of molecular weight compounds > 50 kDa in the raw leachate was
greater than 80% in terms of BOD and COD concentrations. This found that some
portion of the > 50 kDa compounds was broken down into < 5 kDa after ammonia
stripping. The reduction of molecular weight compounds > 50 kDa significantly
presented after MBR treatment. This showed that the complex higher molecular
weight compounds could be degraded effectively using membrane bioreactor
systems. Considering the BOD content in the effluent, it was found that in both yeast
and bacterial effluents, the molecular weight compounds < 5 kDa contributed to the
maximum BOD when compared with the other fractions. The COD content also
showed a similar trend.
12. For the sludge properties, the bound and soluble EPS of the yeast and bacteria
systems are measured. In comparison between yeast and bacteria systems, bound
EPS concentration in terms of TOC was not different while soluble EPS of mixed
bacterial sludge was higher than that of mixed yeast sludge. Also, the protein to
carbohydrate ratio in the soluble EPS was higher. This indicated that soluble EPS
could be the factor which affected the membrane fouling.
13. The bacterial sludge showed a better dewatering quality than that of the yeast sludge.
The viscosity of the bacterial system was higher than the yeast system.
14. Ammonia stripping pretreatment with MBR was effective in treating leachate with
high ammonium nitrogen concentration but the effluent still contained a large
quantity of refractory organic compounds. This might be due to the contribution of
the slowly biodegradable organics and non-biodegradable organics containing in the
leachate. Therefore, it should be further treated in a post treatment, elevating the
water quality of the final effluent or even increasing the biodegradable organics
5.2 Recommendations for Future Work
Based on the extensive experimental results of this study, the following
recommendations are proposed.
1.
For MBR system, membrane fouling is a common problem but it is made more
difficult to predict and control in the MBR. This might be due to the effects of active
microorganisms generating EPS. The EPS is of key significance with respect to
fouling that is dependent on the EPS concentrations and chemical components of
EPS. Fouling is also affected by the floc size and particle size distribution correlated
with membrane permeability. It is recommended that future work should be focused
on the contributions of the various particle fractions (suspended particles, colloidal,
soluble solids), presenting in the sludge on the mechanisms of membrane fouling.
More laboratory and pilot scale experiments are needed to estimate membrane
fouling and the influences of operating parameters.
2.
In MBR system, the various soluble organic substances could be retained within the
bioreactor. The components of soluble organic compounds are complex and may
include humic substances, fluvic acids, polysaccharides, proteins, etc. Therefore, the

122
MBR system should be explained the behavior of the accumulated soluble organic
compounds. In addition, for better understanding of the characteristics of organic
substances in MBR, the molecular weight distribution (MWD) and its compositions
should be analyzed to investigate the transformation of organic substances.
3.
It is well known that landfill leachate, containing non-biodegradable and toxic
organic compounds caused important environmental problems. Thus, the degradation
of refractory organic compounds before and after treatments should be further
studied in terms of the degradation of some substances such as the degradation of
polycyclic aromatic hydrocarbons (PAHs), BTEX, aromatic hydrocarbon, aromatic
ketone.
4.
Landfill leachate is a complex wastewater with considerable variation in both quality
and quantity. The characteristics of leachate, particularly in terms of biodegradability,
change as a landfill ages; it is difficult to treat leachate from a medium site and an
old site using a one-stage membrane bioreactor (MBR). Based on our encouraging
results, the treated leachate nevertheless still contains the refractory organic
compounds, which are difficult to degrade. Therefore, further research should be
performed on an advanced treatment such as nanofiltration, electrochemical
oxidation, or photoassisted fenton methods to treat the recalcitrant organic substances.
These methods might elevate the water quality of the final effluent to meet the
present effluent standard. In addition, for better understanding of the characteristics
of organic substances in treated leachate, the MWD and its compositions should be
analyzed to indicate the extent of organic removal in each fraction with HPLC, LC-
MS for all treatments.
5.
There is a problem regarding foaming in the MBR system due to inadequate dosage
of antifoam chemicals. This should be controlled by using a peristaltic pump.

123
References
Abeling, U., and Seyfried, C.F., 1992. Anaerobic-Aerobic Treatment of High Strength
Ammonium Wastewater- Nitrogen Removal via Nitrite. Water Science and Technology, 26
(5-6): 1007-1015.
Abeliovich, A., and Azov, Y., 1976. Toxicity of Ammonia to Algae in Sewage Oxidation
Ponds. Apply Environmental Microbiology, 31: 801-806.
Agamuthu, P., 1999. Characterization of Municipal Solid Waste and Leachate from
Selected Landfills in Malaysia. Malaysian Journal of Science, 18: 99-103.
Ahn, W.Y., Kang, M.S., Yim, S.K., and Choi, K.H., 1999. Nitrification of Leachate with
Submerged Membrane Bioreactor: Pilot Scale. Proceedings IWA Conference Membrane
Technology in environmental Management, Tokyo, Japan: 432-435.
Ahn, W.Y., Kang, M.S., Yim, S.K., and Choi, K.H., 2002. Advanced Landfill Leachate
Treatment Using an Integrated Membrane Process. Desalination, 149: 109-114.
Albers, H., and Kruckeberg, G., 1992. Combination of Aerobic Pre-treatment, Carbon
Adsorption and Coagulation. In: Landfill of Waste: Leachate. Edited by Christensen, T.H.,
Cossu, R., and Stegmann, R. Elsevier Science Publishers Ltd., England: ISBN: 1-85-
166733-4: 305-312.
Amokrane, A., Comel, C., and Vernon, J., 1997. Landfill Leachates Pre-treatment by
Coagulation-Flocculation. Water Research, 31(11): 2775-2782.
Andreux, F., 1979. Genese et Proprietes des Molecules Humiques. In Pedologie,
Constituants et Proprietes du Sol, Paris, France: 97-122.
Arnold, J.D., Knapp, J.S., and Johnson, C.L., 2000. The Use of Yeasts to Reduce the
Polluting Potential of Silage Effluent. Water Research, 34(15): 3699-3708.
Andreottola, G., and Cannas, P., 1992. Chemical and Biological Characteristics of Landfill
Leachate. In: Landfill of Waste: Leachate. Edited by Christensen, T.H., Cossu, R., and
Stegmann, R. Elsevier Science Publishers Ltd., England: ISBN: 1-85-166733-4: 65-88.
APHA, AWWA, WPCF, 1998. Standard Methods for the Examination of Water and
Wastewater. 20
th
Edition, Washington DC, USA. ISBN 0-87553-235-7.
Avezzu, F., Bissolotti, G., and Collivignarelli, C., 1992. Combination of Wet Oxidation
and Activated Sludge Treatment. In: Landfill of Waste: Leachate. Edited by Christensen,
T.H., Cossu, R., and Stegmann, R. Elsevier Science Publishers Ltd., England: ISBN: 1-85-
166733-4: 333-352.
Bae, J.H., Kim, S.K., and Chang, H.S., 1997. Treatment of Landfill Leachates: Ammonia
Removal via Nitrification and Denitrification and further COD reduction via Fenton’s
Treatment followed by Activated Sludge. Water Science and Technology, 36 (12): 341-
348.

124
Bae, B.U., Jung, E.S., Kim, Y.R., and Shin, H.S., 1999. Treatment of Landfill Leachate
Using Activated Sludge Process and Electron-Beam Radiation. Water Research, 33(11):
2669-2673.
Barlaz, M.A., Ham, R.K., and Schaefer, D.M., 1989. Mass Balance Analysis of
Decomposed Refuse in Laboratory Scale Lysimeter. Journal of Environmental
Engineering, ASCE 115: 1088-1102
Barnes, D. and Bliss, P.J., 1983. Biological Control of Nitrogen in Wastewater Treatment.
1
st
Edition, E. & F. N. Spon, Ltd.: ISBN: 0-41-912350-4.
Baumgarten, G., and Seyfried, C.F., 1996. Experiences and New Developments in
Biological Pretreatment and Physical Post Treatment of Landfill Leachate. Water Science
and Technology, 34(7-8): 445-453.
Baun, A., Kloft, L., Bjerg, P.L., and Nyholm, N., 1999. Toxicity Testing of Organic
Chemicals in Groundwater Polluted with Landfill Leachate. Environmental Toxicology and
Chemistry, 18(9): 2046-2053.
Belfort, G., 1989. Membranes and Bioreactors: A Technical Challenge in Biotechnology.
Biotechnology and Bioengineering, 33: 1047-1066.
Ben Aim, R.M., and Semmens, M.J., 2002. Membrane Bioreactors for Wastewater
Treatment and Reuse: A Success Story. Water Science and Technology, 47(1): 1-5.
Bjorkman, V.B., and Mavinic, D.S., 1977. Physico-Chemical Treatment of a High Strength
Leachate. Proceedings 32
nd
Annual Industrial Waste Conference, Purdue University,
Lafayeete, Indiana, USA: 189-195.
Blakey, N.C., Cossu, R., Maris, P.J., and Mosey, F.E., 1992. Anaerobic Lagoons and
UASB Reactors: Laboratory Experiments. In: Landfill of Waste: Leachate. Edited by
Christensen, T.H., Cossu, R., and Stegmann, R. Elsevier Science Publishers Ltd., England:
ISBN: 1-85-166733-4: 245-263.
Blum, D.J.W., and Speece, R.E., 1992. The Toxicity of Organic Chemicals to Treatment
Processes. Water Science and Technology, 25(3): 23-31.
Boyle, W.C., and Ham, R.K., 1974. Biological Treatability of Landfill Leachate. Journal
of Water Pollution Control Federation, 46(5): 860.
Bressi, G., and Favali, G., 1997. Uses of MBR (Membrane Bioreactor) in Leachate
Treatment. Proceedings Sardinia'97, 6
th
International Waste Management and Landfill
Symposium, Cagliari, Italy.
Brockmann, M., and Seyfried, C.F., 1996. Sludge Activity and Cross-flow Microfiltration-
A Non Beneficial Relationship. Water Science and Technology, 34: 205-213.
Brown, K., and Donnelly, K.C., 1988. An Estimation of the Risk Associated with the
Organic Constituents of Hazardous and Municipal Waste Landfill Leachates. Hazardous
Waste and Hazardous Materials, 5: 1-30.

125
Brown, M.J., and Lester, J.N., 1980. Metal Removal in Activated Sludge: The Role of
Bacteria Extracellular Polymers. Water Research, 13: 817-837.
Bull, P.S., Evans, J.V., Wechsler, R.M., and Cleland, K.J., 1983. Biological Technology of
the Treatment of Leachate from Sanitary Landfills. Water Research, 17(11): 1473-1481.
Bura, R, Cheung, M., Liao, B., Finlayson, J., Lee, B.C., Droppo, I.G., Leppard, G.G., and
Liss, S.N., 1998. Composition of Extracellular Polymeric Substances in the Activated
Sludge Matrix. Water Science and Technology, 37: 325-333.
Cairns, J., and Van Der Schalie, W.H., 1980. Biological Monitoring Part I- Early Warning
Systems. Water Research, 14: 1179-1196.
Cameron, R.D., and Koch, F.A., 1980. Trace Metals and Anaerobic Digestion of Leachate.
Journal of Water Pollution Control Federation, 52(2): 282.
Chae, K.J., Oh, S.E., Lee, S.T., and Kim, I.S., 1999. Biological Leachate Treatment by
Pure-Oxygen Aeration and Modeling the Removal of Organics. Journal of Korean Society
of Environmental Engineering, 21(10): 1891-1900.
Chaing, L.C., Chang, J.E., and Wen, T.C., 1995. Indirect Oxidation Effect in
Electrochemical Oxidation Treatment of Landfill Leachate. Water Research, 29(2): 671-
678.
Chang, I. S., Kim, J.S., and Lee, C.H., 1996. Membrane Biofouling Characteristics in
Membrane Coupled Activates Sludge System. Proceeding of ICOM, Yokohama, Japan:
926-927.
Chang, I.S., and Lee, C.H., 1998. Membrane Filtration Characteristics in Membrane
Coupled Activated Sludge System-The Effect of Physiological States of Activated Sludge
on Membrane Fouling. Desalination, 120: 221-233.
Chang, I.S., and Lee, C.H., 2001. The effects of EPS on Membrane Fouling in the MBR
Process. Proceedings MBR3 Conference, England: 19-28.
Chen, C.Y., Huang, J.B., and Chen, S.D., 1997. Assessment of the Microbial Toxicity Test
and Its Application for Industrial Wastewater. Water Science and Technology, 36(12): 375-
382.
Cheung, K.C., Chu, L.M., and Wong, H.M., 1993. Toxic Effect of Landfill Leachate on
Microalgae. Water Air and Soil Pollution, 69: 337-349.
Cheung, K.C., Chu, L.M., and Wong, M.H., 1997. Ammonia Stripping as a Pre-treatment
for Landfill Leachate. Water, Air and Soil Pollution, 94: 209-221.
Chian, E.S.K. and DeWalle, F.B., 1976. Sanitary Landfill Leachjate and Their Treatment.
Journal of the Environmental Engineering Division, ASCE, 102: 411-431.
Chian, E.S.K., 1977. Stability of Organic Matter in Landfill Leacahtes. Water Research,
11(2): 225-232.

126
Chian, E.S.K., and DeWalle, F.B., 1977. Treatment of High Strength Acidic Wastewater
with a Completely Mixed Anaerobic Filter. Water Research, 11: 295-304.
Chiang, L.C., Chang, J.E., and Wen, T.C., 1995. Indirect Oxidation Effect in
Electrochemical Oxidation Treatment of Landfill Leachate. Water Research, 29(2): 671-
678.
Chigusa, K., Hasegawa, T., Yamamoto, N., and Watanabe, Y., 1996. Treatment of
Wastewater from Oil Manufacturing Plant by Yeasts. Water Science and Technology,
34(11): 51-58.
Cicek, N., Franco, P., Suidan, M., Urbain, V., and Manem, J., 1999. Characterization and
Comparison of a Membrane Bioreactor and a Conventional Activated Sludge System in the
Treatment of Wastewater Containing High Molecular Weight Compounds. Water
Environmental Research, 71: 64-70.
Clement, B., Persoone, G., Janssen, C., and Le Du-Delepierre, A., 1996. Estimation of the
Hazard of Landfills Through Toxicity Testing of Leachates: 1. Determination of Leachate
Toxicity with a Battery of Acute Tests. Chemosphere, 33: 2303-2320.
Cook, E.N., and Foree, E.G., 1974. Aerobic Bio-stabilization of Sanitary Landfill
Leachate. Journal of Water Pollution Control Federation, 46(2): 380-392.
Cossu, R., Polcaro, A.M., Lavagnolo, M.C., Mascia, M., Palmas, S., and Renold, F., 1998.
Electrochemical Treatment of Landfill Leachate: Oxidation at Ti/PbO
2
and Ti/SnO
2
Anodes. Environmental Science and Technology, 32: 3570-3573.
Cossu, R., Serra, R., and Muntoni, A., 1992. Physico-Chemical Treatment of Leachate. In:
Landfill of Waste: Leachate. Edited by Christensen, T.H., Cossu, R., and Stegmann, R.
Elsevier Science Publishers Ltd., England: ISBN: 1-85-166733-4: 265-304.
Cui, Q., and Tang, C., 2000. Effects of Lead and Selenium on Yeast (Saccharomyces
Cerevisiae) Telomere. Journal of Environmental Science and Health, Part A:
Toxic/Hazardous Substances and Environmental Engineering, 35(9): 1663-1671.
Dan, N.P., 2002. Biological Treatment of High Salinity Wastewater Using Yeast and
Bacteria Systems. Dissertation, Asian Institute of Technology, Thailand.
Dan, N.P., Visvanathan, C., Polprasert, C., and Aim, R.B., 2002. High Salinity
Wasterwater Treatment Using Yeast and Bacteria Membrane Bioreactors. Water Science
and Technology, 46(9): 201-209.
Defrance, L., Jaffrin, M.Y., Gupta, B., Paullier, P., and Geaugey, V., 2000. Contribution of
Various Constituents of Activated Sludge to Membrane Bioreactor Fouling. Bioresource
Technology, 73: 105-112
Defrance, M.B., 1993. Etude d’un Reactor Levurien Pour le Traitement des Effluents
d’Industries Alimentairs. Doctoral Thesis, University of Montpellier II-Sciences et
Techniques du Languedoc, France.

127
Diamadopoulos, E., 1994. Characterization and Treatment of Recirculation-Stabilized
Leachate. Water Research, 28(12): 2439-2445.
Dichtl, N., Dockhorn, T., and Wittenberg, M., 2001. Investigations Comparing SBR
Reactors and Continuous Flow Plants for the Nitrification of Landfill Leachate.
Proceedings Sardinia’ 01, 8
th
International Waste Management and Landfill Symposium,
Cagliari, Italy.
Dignac, M.F., Urbain, V., Rybacki, D., Bruchet, A., Snidaro, D., and Scribe, P., 1998.
Chemical Description of Extracellular Polymers: Implication on Activated Sludge Floc
Structure. Water Science and Technology, 38: 45-53
Dijk, L., and Roncken, G.C.G., 1997. Membrane Bioreactor for Wastewater Treatment:
The State of the Art and New Developments. Water Science and Technology, 35(10): 35-
41.
Dollerer, J., and Wilderer, P.A., 1996. Biological Treatment of Leachates from Hazardous
Waste Landfills Using SBBR Technology. Water Science and Technology, 34(7-8): 437-
444.
Doyle, J., Watts, S., Solley, D., and Keller, J., 2001. Exceptionally High-rate Nitrification
in Sequencing Batch Reactors Treating High Ammonia Landfill Leachate. Water Science
and Technology, 43 (3): 315-322.
Dubois, M.J., Gilles, K.A., Hamilton, J.K., Reber, P.A., and Smith, F., 1956. Colorimetric
Method for Determination of Sugars and Related Substances. Analytical Chemistry, 28(3):
350-356.
Dzombak, D.A., Langnese, K.M., Spengel, D.B., and Luthy, R.G., 1990. Comparison of
Activated Sludge and RBC Treatment of Leachate from a Solid Waste Landfill.
Proceeding of 1990 WPCF National Specialty Conference on water quality Management
of Landfills, July 15-18, Chicago, USA: 4-39-4-58.
Ehrig, H.J., 1983. Quality and Quantity of Sanitary Landfill Leachate. Waste Management
and Research, 1: 53-68.
Ehrig, H.J., 1998. Water and Element Balances of Landfills, Lecture Notes in Earth
Sciences, Edited by Baccini, P., Springer-Verlag, Berlin, Germany.
Ekama, G.A., Dold, P.L., and Marais, G.V.R., 1986. Procedures for Determining Influent
COD Fractions and the Maximum Specific Growth Rate of Heterotrophs in Activated
Sludge System. Water Science and Technology, 18(6): 91-114.
Elmaleh, S., Defrance, M.B., Ghommidh, C., and Navarro, J.M., 1996. Technical Note:
Acidogenic Effluents Treatment in a Yeast Reactor. Water Research, 30(10): 2526-2529.
Fairweather, R.J., and Barlaz, M.A., 1988. Hydrogen Sulphide Production During
Decomposition of Landfill Inputs. Journal of Environmental Engineering, ASCE, 124:
353-361.

128
Fan, X., Urbain, V., Qian, Y., and Manem, J., 1996. Nitrification and Mass Balance with
MBR for Municipal Wastewater Treatment. Submitted for the 1996 IAWQ Biennial
Conference, Singapore.
Fane, A.G., Fell, C.J.D., and Nor, M.T., 1981. Ultrafiltration Activated Sludge System-
Development of a Predictive Model. Polymer Science Technology, 13: 631-658.
Farquhar, G.J., 1989. Leachate: Production and Characteristics. Canadian Journal of Civil
Engineering, 16: 317-325.
Fettig, J., Stapel, H., Steinert , C., and Geiger, M., 1996. Treatment of landfill leachate by
preozonation and adsorption in activated carbon columns. Water Science and Technology,
34 (9):33–40.
Fisher, M., and Fell, C., 1999. Ammonia Removal from High Strength Leachate Using a
Sequencing Batch Reactor. Waste Management, 25-26.
Flemming, H.C., and Wingender, J., 2001. Relevant of Microbial Extracellular Polymeric
Substances-Part II: Technical aspects. Water Science and Technology, 43(6): 9-16.
Garcia, H., Rico, J.L., and Garcia, P.A., 1996. Comparison of Anaerobic Treatment of
Leachates from an Urban-Solid-Waste Landfill at Ambient Temperature and at 35
o
C.
Bioresource Technology, 58: 273-277.
Gau, S.H. and Chang, F.S., 1996. Improved Fenton Method to Remove Recalcitrant
Organics in Landfill Leachate. Water Science and Technology, 34(7-8); 455-462.
Gaudy, A.F., Rozich, A., and Garniewski, S., 1986. Treatability Study of High Strength
Landfill Leachate. Proceedings of the 41
st
Industrial Waste Conference, Purdue University,
Indiana, USA: 627-638.
Geenens, D., Bixio, D., and Thoeye, C., 1999. Advanced Oxidation Treatment of Landfill
Leachate. Proceedings Sardinia’99, 7
th
International Waste Management and Landfill
Symposium, Cagliari, Italy.
Ghyoot, W., Vandaele, S., and Verstraete, W., 1999. Nitrogen Removal from Sludge
Reject Water with a Membrane Assisted Bioreactor. Water Research, 33: 23-32.
Gierlich, H., and Kollbach, J., 1998. Treating Landfill Leachate in European Countries.
Pollution Engineering International: 10-14.
Goodwin, J.A.S., and Foster, C.F., 1985. A Future Examination into the Composition of
Activated Sludge Surfaces in Relation to Their Settlement Characteristics. Water Research,
19: 527-533.
Gourdon, R., Comel, P., Vermande, P., and Veron, J., 1989. Fractionate of the Organic
Matter of a Landfill Leachate before and after Aerobic or Anaerobic Biological Treatment.
Water Research, 23(2): 167-173.

129
Grady, C.P.L., Daigger, G.T., and Lim, H.C., 1999. Biological Wastewater Treatment. 2
nd
Edition, Marcel Dekker, Inc.: ISBN: 0-82-478919-9.
Graham, D.W., 1981. Biological-Chemical Treatment of Landfill Leachate. Department of
Civil Engineering, University of British Columbia, Canada.
Graham, D.W., and Mavinic, D.S., 1979. Biological-Chemical Treatment of Leachate.
Proceedings of the American Society of Civil Engineers National Conference on
Environmental Engineering, San Francisco, USA: 291-298.
Guell, C., Czekaj, P., and Davis, R.H., 1999. Microfiltration of Protein Mixtures and the
Effects of Yeast on Membrane Fouling. Journal of Membrane Science, 155(1): 113-122.
Gunder, B., 2001. The Membrane Coupled Activated Sludge Process in Municipal
Wastewater Treatment. Technomic Publishing Co., Inc., USA: ISBN: 1-56-676959-0.
Gurijala, K.R., and Suflita, J.A., 1993. Environmental factors influencing methanogenesis
from refuse in landfill samples. Environmental Science and technology, 27:1176-1181.
Hall, E.R., Onysko, K.A., and Parker, W.J., 1995. Enhancement of Bleached Kraft
Organo-chlorine Removal by Coupling Membrane Filtration and Anaerobic Treatment.
Environmental Technology, 16: 115-126.
Hanaki, K., Wantawin, C., and Ohgaki, S., 1990. Effects of the Activity of Heterotrophs on
Nitrification in a Suspended Growth Reactor. Water Research, 24(3): 289-296.
Harmsen, J., 1983. Identification of Organic Compounds in Leachate from a Waste Tip.
Water Research, 17(6): 699-705.
Henderson, J.P., Besler, D.A., Atwater, J.A., and Mavinic, D., 1997. Treatment of
Methanogenic Landfill Leachate to Remove Ammonia Using a Rotating Biological
Contactor (RBC) and a Sequencing Batch Reactor (SBR). Environmental Technology,
18(7): 687-698.
Henry J. G., Prasad, D., Sidhwa, R., and Hilgerdenaar, M., 1982. Treatment of Landfill
Leachate by Anaerobic Filter. Water Pollution Research Journal of Canada, 17: 45-56.
Henry, J.G., 1985. New Developments in Landfill Leachate Treatment. Proceedings of
International Conference on New Directions and Research in Waste Treatment and
Residuals Management, University of British Columbia, USA: 1-139.
Henry, J.G., Prasad, D., and Young, H., 1987. Removal of Organics from Leachates by
Anaerobic Filter. Water Research, 21(11): 1395-1399.
Henze, M., 1992. Characterization of Wastewater for Modelling Activated Sludge
Processes. Water Science and Technology, 25(6): 1-15.
Ho, S., Boyle, W.C., and Ham, R.K., 1974. Chemical treatment of Leachates from
Sanitary Landfills, Journal of Water Pollution Control Federation, 46(7), 1776-1791.

130
Hosomi, M., Matsusige, K., Inamori, Y., Sudo, R., Yamada, K., and Yoshino, Z., 1989.
Sequencing Batch Reactor Activated Sludge Processes for the Treatment of Municipal
Landfill Leachate: Removal of Nitrogen and Refractory Organic Compounds. Water
Science and Technology, 21: 1651-1654.
Hu, T., 1989. Treatment of Vermicelli Wastewater by an Acid-tolerant, Starch Degrading
Yeast. Biological Waste, 28(3): 163-174.
Huang, X., Liu, R., and Qian, Y., 2000. Behaviour of Soluble Microbial Products in a
Membrane Bioreactor. Process Biochemistry, 36: 401-406.
Illies, P., 1999. Biological Nitrification and Denitrification of High Ammonia Landfill
Leachate Using Pre and Post Treatment Denitrification Systems and Methanol as
Supplementary Source of Organic Carbon. Master Thesis, University of British Columbia,
Canada.
Imai, A., Iwami, N., Matsushige, K., Inamori, Y., and Sudo, R., 1993. Removal of
Refractory Organics and Nitrogen from Landfill Leachate by the Microorganism-Attached
Activated Carbon Fluidised Bed Process. Water Research, 27(1): 143-145.
Imai, A., Onuma, K., Inamori, Y., and Sudo, R., 1995. Biodegradation and Adsorption in
Refractory Leachate Treatment by the Biological Activated Carbon Fluidized Bed Process.
Water Research, 29(2): 687-694.
Jans, J.M., Schroeff, A.V.D and Jaap, A., 1992. Combination of UASB Pre-treatment and
Reverse Osmosis. In: Landfill of Waste: Leachate. Edited by Christensen, T.H., Cossu, R.,
and Stegmann, R. Elsevier Science Publishers Ltd., England: ISBN: 1-85-166733-4: 313-
321.
Jensen, J.C., Cameron, D.H., and Penny, J.P., 2001. Operating Experience with Innovative
High Efficiency Membrane Treatment of Landfill Leacahte. The 6
th
Annual symposium by
Waste Association of North America
(
SWANA).
Jonard, Z., Zartarian, F., Thomas, F., Block, J.C., Bottero, J.Y., Villemin, G., Urbain, V.,
and Manem, J., 1995. Chemical and Structural (2D) Linkage between Bacteria within
Activated Sludge Flocs. Water Research, 29: 1639-1647.
Kabdasli, I., Tunay, O., Ozturk, I., Yilmaz, S., and Arikan, O., 2000. Ammonia Removal
from Young Landfill Leachate by Magnesium Ammonium Phosphate Precipitation and Air
Stripping. Water Science and Technology, 41(10): 237-240.
Kang, K.H., Shin, H.S., and Park, H., 2002. Characterization of Humic Substances Present
in Landfill Leachates with Different Landfill Ages and Its Implications. Water Research,
36: 4023-4032.
Kappeler, J., and Gujer, W., 1992. Estimation of Kinetic Parameters of Heterotrophic
Biomass under Aerobic Conditions and Characterization of Wastewater for Activated
Sludge Modelling. Water science and technology, 25(6): 125-139.

131
Keenan, J.D., Steiner, R.L., and Fungaroli, A.A., 1984. Landfill Leachate Treatment.
Journal of Water Pollution Control Federation, 56(1): 27-33.
Kennedy K. J., Hamoda M. F., and Guiot S. G., 1988. Anaerobic Treatment of Leachate
using Fixed Film and Sludge Bed Systems. Journal of Water Pollution Control Federation,
60:1675-1683.
Kennedy, K., and Lentz, E., 2000. Treatment of Landfill Leachate Using Sequencing Batch
and Continuous Flow Upflow Anaerobic Sludge Blanket (UASB) Reactors. Water
Research, 34(14): 3640-3656.
Kettunen, R.H., Hoilijoki, T.H., and Rintala, J.A., 1996. Anaerobic and Sequential
Anaerobic-Aerobic Treatment of Municipal Landfill Leachate at Low Temperature.
Bioresource Technology, 58(1): 31-40.
Kim, C.W., Kim, B. G., Lee, T.H., and Park, T.J., 1994. Continuous and Early Detection of
Toxicity in Industrial Wastewater Using an On-line Respiration Meter, Water Science and
Technology, 30(3): 11-19.
Kim, J.S., Lee, C.H., and Chang, I.S., 2001. Effect of Pump Shear on the Performance of a
Crossflow Membrane Bioreactor. Water Research, 35: 2137-2144.
Kim, J.S., Lee, C.H., and Chun, H.D., 1998. Comparison of Ultrafiltration Characteristics
between Activated Sludge and BAC Sludge. Water Research, 32: 3443-3451.
Kim, S.M., Geissen, S.U., and Vogelpohl, A., 1997. Landfill leachate Treatment by a
Photoassisted Fenton Reaction. Water Science and Technology, 35(4): 239-248.
Knox, K., and Jones, P.H., 1979. Complexation Characteristics of Sanitary Landfill
Leachates. Water Research, 27: 405-411.
Knox, K., 1985. Leachate Treatment with Nitrification of Ammonia. Water Research, 19
(7): 895-904.
Krauth, K.H., and Staab, K.F., 1993. Pressurized Bioreactor with Membrane Filtration for
Wastewater Treatment. Water Research, 27: 405-411.
Krug A.T., and Mcdougall, S., 1988, Preliminary of a Microfiltration/Reverse Osmosis
Process for the Treatment of Landfill Leachate. Environmental Ontario Environmental
Research Technology Transfer Conference, 28-29 Nov, Toronto, Canada.
Kylefors, K., 1997. Landfill Leachate Management- Short and Long Term Perspectives.
Luleå University of Technology, Sweden: ISSN: 1402-1757.
LaGrega, M.D., Buckingham, P.L., and Evans, J.C., 1994. Hazardous Waste Management.
McGraw-Hill, USA: 0-07-019552-8.
Leckie, J.O., Pacey, J.G., and Halvadakis, C., 1975. Acceleration Refuse Stabilization
Through Controlled Moisture Application. Paper Presented in the 2
nd
Annual National
Environmental Engineering Research Development and Design, Gainsville, Florida, USA.

132
Leckie, J.O., Pacey, J.G., and Halvadakis, C., 1979. Landfill Management with Moisture
Control. Journal Environmental Engineering Division, ASCE, 105(EE2): 337-355.
Lecoupannce, F., 1999. Fractionnement et Caracterisation des Lixiviats de Centres
D’enfouissement de D’echets Menagers par Chromatographie Liquide (Fractionation and
Characterization of Sanitary Landfill Leachates by Liquid Chromatography). Ph.D.
Thesis, Universite de Bretagne-Sud, France.
Lee, C.J., 1979. Treatment of Municipal Landfill Leachate. Master Thesis, University of
British Columbia, Canada.
Lema, J.M., Mendez, R., and Blazquez, R., 1988. Characteristics of Landfill Leachates and
Alternatives for Their Treatment: A Review. Water, Air and Soil Pollution, 40: 223-250
Liao, B.Q., Allen, D.G., Droppo, I.G., Leppard, G.G., and Liss, S.N., 2001. Surface
Properties of Sludge and Their Role in Bioflocculation and Settleability. Water Research,
35: 339-350.
Liebeskind, M., 1999. Parameter for Dynamic Simulate of Municipal Sewage Treatment
Plant (German). Gewaessersghutz Wasser Abwasser No 171, Aachen Technical University.
Lin, S.H., and Chang, C.C., 2000. Treatment of Landfill Leachate by Combined Electro-
Fenton Oxidation and Sequencing Batch Reactor Method. Water Research, 34(17): 4243-
4249.
Lowry, O.H., Resebrough, N.J., Farr, A.L., and Randall, R., 1951. Protein Measurement
with the Folin Phenol Rreagent. Journal of Biological Chemistry, 193: 265-275.
Lubbecke, S., Vogelpohl, A., and Dewjanin, W., 1995. Wastewater Treatment in a
Biological High-Performance System with High Biomass Concentration. Water Research,
29: 793-802.
Madoni, P., Davoli, D., and Guglielmf, L., 1999. Response of SOUR and AUR to Heavy
Metal Contamination in Activated Sludge, Water Research, 33(10): 2459-2464.
Madoni, P., Davoli, D., Gorbi, G., and Vescovi, L., 1996. Toxic Effect of Heavy Metals on
the Activated Sludge Protozoan Community, Water Research, 30: 135-141.
Mallevialle, J., Odendaal, P.E., and Wiesner, M.R., 1996. Water Treatment Membrane
Processes. McGraw-Hill, USA: ISBN: 0-07-001559-7.
Mandra, V., Amar, D., Trouve, E., Courant, P., and Coulomb, I., 1995. Membrane
Bioreactor and Reverse Osmosis Coupling for the Treatment of Discharge Leachates.
Proceedings of International Workshop Membrane in Drinking Water Production,
International Water Supply Association, Paris, France: 33-38.
Manem, J., 1993. Membrane Bioreactors for Wastewater Treatment and Drinking Water
Production. Proceedings of the 3
rd
World Congress of the World Federation of
Engineering Organizations, Beijing, China: 907-914.

133
Martin, G.M.A., Auzmenti, A.I., and Olozaga, C.P., 1995. Landfill Leachate: Variation in
Quality and Quantity. Proceedings of Sardinia’ 95,
5
th
International Landfill Symposium,
Cagliari, Italy: 345-354.
Marttinen, S.K., Kettunen, R.H., Sormunen, K.M., Soimasuo, R.M., and Rintala, J.A.,
2002. Screening of Physical-Chemical Methods for Removal of Organic Material,
Nitrogen and Toxicity from Low Strength Landfill Leachates. Chemosphere, 46: 851-858.
Mavinic, D.S., 1998. Leachate Quality: Effects on Treatability. Proceedings of the
International Training Seminar: Management and Treatment of MSW Landfill Leachate,
2-4 December, Venice, Italy.
McBean, E.A., Rovers, F.A., and Farquhar, G.J., 1995. Solid Waste Landfill Engineering
and Design. Prentice-Hall, Inc. New Jersey, USA: ISBN: 0-13-079187-3.
McCann, B., 2002. The Secret of Success, Water 21, 8: 42-43.
Mejbri, R., Matejka, G., Lafrance, P., and Mazet, M., 1995. Fractioonnement et
Caracterisatioon de la Matiere Organique des Liziviats de Decharges D’ordures Menageres
(Fractionation and Characterization of the Organic Matter in Sanitary Landfill Leachates).
Rev. Sci. de l’Eau, 8: 217-236.
Mendez, R., Lema, J.M., Blazquez, R., Pan, M., and Forjan, C., 1989. Characterization,
Digestibility and Anaerobic Treatment of Leachates from Old and Young Landfills. Water
Science and Technology, 21: 145-155.
Mishra, P.N., Sutton, P.M., and Mourato, D., 1996. Industrial Wastewater Biotreatment
Optimization through Membrane Applications. Proceedings 89
th
Mtg. Air and Waste
Management Association, Nashville.
Miskiewicz, T., Oleszkiewicz, J.A., Kosinska, K., Koziarski, S., Kramarz, M., and
Ziobrowski, J., 1982. Dynamic Tests on Yeast Production from Piggery Effluents.
Agriculture Wastes, 4: 3-15.
Morgan, W.S.G., and Villiers, R.H., 1978. Rapid Assessment of Water Quality Using
Protozoan Respiratory Responses to Intoxication. Presented at the Biennial conference of
the Institute of Water Pollution Control (South African Branch).
Morgan, J.W., Froster, C.F., and Evison, L., 1990. A Comparative Study of the Nature of
Biopolymers Extracted from Anaerobic and Activated Sludges. Water Research, 24(6):
743-750.
Mukai, T., Takimoto, K., Kono, T., and Okada, M., 2000. Ultrafiltration Behaviour of
Extracellular and Metabolic Products in Activated Sludge System with UF Separation
Process. Water Research, 34: 902-908.
Muller, E.B., Stouthamer, A.H., Vanverseveld H.W., and Eikelboom, D.H., 1995. Aerobic
Domestic Wastewater Treatment in a Pilot Plant with Complete Sludge Retention by Cross
Flow Filtration. Water Research, 29, 1179-1189.

134
Nagano, A., Arikawa, E., and Kobayashi, H., 1992. The Treatment of Liquor Wastewater
Containing High Strength Suspended Solids by Membrane Bioreactor System. Water
Science and Technology, 26(3-4): 887-895.
Nagaoka, H., 1999. Nitrogen Removal by Submerged Membrane Separation Activated
Sludge Process. Water Science and Technology, 39: 107-114.
Nagaoka, H., Ueda, S., and Miya, A., 1996. Influence of Bacterial Extracelluar Polymers
on The Membrane Separation Activated Sludge Process. Water Science and Technology,
34:165-172.
Nedwell, D., and Reynolds, P., 1996. Treatment of Landfill Leachate by Methanogenic and
Sulphate-Reducing Digestion. Water Research, 30(1): 21-28.
Nielson, P.H., and Jahn, A., 1999. Extraction of EPS. In: Microbial Extracellular
Polymeric Substances. Edited by Wingender, J., Neu, T.R., and Flemming, H.C., Springer,
Berlin, Germany: 49-72.
Nishihara ESRC Ltd., 2001. Technical Details of the Yeast Cycle System. Personal
Communication and Company Process Catalog.
Oladimeji, A.A., and Offem, B.O., 1989. Toxicity of Lead to Claria lazera, Orechromis
niloticus, Chironomus tentens, and Benacus sp. Water Air and Soil Pollution, 44: 191-201.
Ortiz, C.P., Steyer, J.P., and Bories, A., 1997. Carbon and Nitrogen Removal from
Wastewater by Candida utilis: Kinetics Aspects and Mathematical Modelling. Process
Biochemistry, 32(3): 179-189.
Ozturk, I., Altinbas, M., Arikan, O., Tuyluoglu, B.S., and Basturk, A., 1999. Anaerobic
and Chemical Treatability of Young Landfill Leachate. Proceedings of 7
th
International
Waste Management and Landfill Symposium, 4-8 October, Cagliari, Italy: 311-318.
Palit, T., and Qasim, S.R., 1977. Biological Treatment Kinetics of Landfill Leachate.
Journal of Environmental Engineering Division, ASCE, 103(EE2): 353-366.
Patterson, W.J., Brezonik, L.P., and Putnam, H.D., 1970. Sludge Activity Parameters and
Their Application to Toxicity Measurements and Activated Sludge. Proceeding 24
th
Industrial Waste Conference, Indiana, USA.
Peters, T., 1997. Treatment of Landfill Leachate by Reverse Osmosis. Proceedings
Sardinia’ 97, 6
th
International Landfill Symposium, 13-17 October, Cagliari, Italy.
Pirbazari, M., Ravindran, V., Badriyha, B.N., and Kim, S.H., 1996. Hybrid Membrane
Filtration Process for Leachate Treatment. Water Research, 30(11): 2691-2706.
Pohland, F.G., 1972. Landfill Stabilization with Leachate Recycle. Interim Progress
Report, Solid Waste Research Division, U.S.EPA, Ohio, USA.
Pohland, F.G., 1975. Sanitary Landfill Stabilization with Leachate Recycle and Residual
Treatment, EPA 600/2-75-043, U.S. EPA, Ohio, USA.

135
Pohland, F.G., and Harper, S.R., 1985. Critical Reviews and Summary of Leachate and
Gas Production from Landfills. EPA Report Number 600/2-86/073.
Pohland, F.G., Stratakis, M., Cross, W.H., and Tyahla, S.F., 1990. Controlled Landfill
Management of Municipal Solid Waste and Hazardous Wastes. Proceedings of 1990
WPCF National Specialty Conference on Water Quality Management of Landfills, 15-18
July, Illinois, USA: 3-16 – 3-32.
Pohland, F.G., and Kim, J.C., 1999. In Situ Anaerobic Treatment of Leachate in Landfill
Bioreactors. Water Science and Technology, 40(8): 203 -210.
Pollution Control Department, 2000. Research and Development of Landfill Leachate
Treatment. Ministry of Science, Technology and Environment. Bangkok, Thailand: ISBN:
9-74-787938-7.
Pouet, M.F., and Grasmicj, A., 1995. Microfiltration of Urban Wastewater: the Roles of
the Different Organic Fractions in Fouling the Membrane. Proceeding Euromembrane’95,
University of Bath, England: 482-486.
Praet, E., Jupsin, H., El Mossaoui, M., Rouxhet, V., and Vasel, J.L., 2001. Use of a
Membrane Bioreactor and an Activated Carbon Adsorber for the Treatment of MSW
Landfill Leachates, Proceedings Sardinia’01, 8
th
International Waste Management and
Landfill Symposium, Cagliari, Italy.
Qasim, S.R., and Chiang, W., 1994. Sanitary Landfill Leachate- Generation, Control and
Treatment. Technomic Publishing Co., Inc. Pennsylvania, USA: ISBN: 1-56-676129-8.
Ragle N., Kissel, J.C., Ongerth, J.E., and DeWalle F.B., 1995. Composition and Variability
of Leachate from Recent and Aged Areas within a Municipal Landfill. Water Environment
Research, 67(2):238-243, 1995.
Raina, S., and Malvinic, D.S., 1985. Comparison of Fill and Draw Reactors for Treatment
of Landfill Leachate. Water Pollution Research Journal, of Canada, 20(2): 12-28.
Rautenbach R., and Albrecht, R., 1989. Membrane Processes, John Wiley and Sons Ltd.:
ISBN: 0-47-191110-0.
Rautenbach, R., and Mellis, R., 1994. Wastewater Treatment by a Combination of
Bioreactor and Nanofiltration. Desalination, 95: 171-188.
Reeves, T.G., 1972. Nitrogen Removal: A Literature Review. Journal of Water Pollution
Control Federation, 44(10): 1895-1908.
Reeves, J.B., 1976. Activated Sludge System Influent Toxicity Monitoring through
Utilization of Commercial, Continuous Respirometer. N.S. Dissertation, Virginia
Polytechnic Institute and State University, USA.
Robinson, H.D., and Grantham, G., 1988. The Treatment of Landfill Leachates in On-site
Aerated Lagoon Plants: Experience in Britain and Ireland. Water Research, 22(6): 733-
747.

136
Robinson, H.D., and Luo, M.M.H., 1991. Characterization and Treatment of Landfill
Leachates from Hong Kong Landfill Sites. Journal of Institute Water and Environmental
Management, 5: 326-335.
Robinson, H.D., Barr, M.J., and Last, S.D., 1992. Leachate Collection, Treatment and
Disposal. Journal of Institute Water and Environmental Management, 6: 321-332.
Robinson, H.D., and Maris, P.J., 1983. The Treatment of Leachates from Domestic Wastes
in Landfills–I: Aerobic Biological Treatment of Medium-Strength Leachate. Water
Research, 17(11): 1537-1548
Robinson, H.D., and Maris, P.J., 1985. The Treatment of Leachates from Domestic Waste
in Landfill Sites, Journal of Water Pollution Control Federation, 57(1): 30-38.
Robinson, H.D., 1999. State of the Art Landfill Leachate Treatment Systems in the UK and
Ireland. Waste Science and Research, England.
Rodney, F.B., 1993. Modern Experimental Biochemistry. 2
nd
Edition, USA:
Benjamin/Cummings Pub. Co.: ISBN: 0-80-530545-9.
Rosenberg, S., Kraume, M., and Szewzyk, U., 1999. Operation of Different Membrane
Bioreactors: Experimental Results and Physiological State of the Microorganisms.
Proceedings Membrane Technology in Environmental Management, Tokyo, Japan: 310-
316.
Sanin, D., and Vsilind. P.A., 2000. Bioflocculation of Activated Sludge: The Role of
Calcium Ions and Extracellular Polymers. Environmental Technology, 21: 1405-1412.
Sato, T., and Ishii, Y., 1991. Effects of Activated Sludge Properties on Water Flux of
Ultration Membrane Used for Human Excrement Treatment. Water Science and
Technology, 23: 1601-1608.
Sawyer, C.N., McCarty, P.L., and Parkin, G.F., 1994. Chemistry for Environmental
Engineering. McGraw-Hill, USA: ISBN: 0-07-113908-7.
Schrab, G.E., Brown, K.W., and Donnelly, K.C., 1993. Acute and Genetic Toxicity of
Municipal Landfill Leachate. Water Air and Soil Pollution, 69: 99-112.
Schuk, W.W., and James, S.C., 1986. Treatment of Landfill Leachate at Publicly Owned
Treatment Works. Waste Management and research, 4: 265-277.
Scioli, C., and Vollaro, L., 1997. Use of Yarrowia lipolytica to Reduce Pollution in Olive
Mill Wastewaters. Water Research, 31(10): 2520–2524.
Scott, J.A., and Smith, K.L., 1997. A Bioreactor Coupled to a Membrane to Provide
Aeration and Filtration in Ice-Cream Factory Wastewater Remediation. Water Research,
31(1): 69-74.

137
Shin, H.S., An, H., Kang, S.T., Choi, K.H., and Jun, K.S., 1999. Fouling Characteristics in
Pilot Scale Submerged Membrane Bioreactor. Proceeding 1
st
WEFTEC’ 99, New Orleans,
USA.
Siegrist, H., Reithaar, S., and Lais, P., 1998. Nitrogen Loss in a Nitrifying Rotating
Contactor Treating Ammonium Rich Leachate without Organic Carbon. Water Science
and Technology, 37(4-5): 589–591.
Sivapornpun, V., 2000. Heavy Metals in Landfill Leachate: Options for Reduction and
Treatment. Master Thesis, Asian Institute of Technology, Thailand.
Slater, C.S., Uchrin, C.G., and Ahlert, R.C., 1985. Ultrafiltration Processes for the
Characterization and Separation of Landfill Leachate. Journal of Environmental science
Health, A20(1): 97-111.
Smith, P.G., and Arab, F.K., 1988. The Role of Air Bubbles in the Desorption of Ammonia
from Landfill Leachates in High pH Aerated Lagoon. Water, Air and Soil Pollution, 38:
333-343.
Solyom, P., 1977. Industrial Experiences with Toxiguard, a Toxicity Monitoring System.
Prog. Water Technology, 9: 193-198.
Solyom, P., Boman, B., and Bjorndal, H., 1976. Continuous Monitoring of Acute-Toxic
Substances in Wastewater. Prog. Water Technology, 8: 417-422.
Srinath, E.G., and Loehr, R.C., 1974. Ammonia Desorption by Diffused Aeration. Journal
of Water Pollution Control Federation, 46(8): 1939-1957.
Steensen, M., 1993. Removal of Non-biodegradable Organics from Leachate by Chemical
Oxidation. Proceedingd Sardina’ 93, 4
th
International Landfill Symposium, Cagliari, Italy:
945-958.
Steensen, M., 1997. Chemical Oxidation for the Treatment of Leachate-Process
Comparison and Results from Full-Scale Plants. Water Science and Technology, 35(4):
249-256.
Stephenson, T., Judd, S., Jefferson, B., and Brindle, K., 2000. Membrane Bioreactors for
Wastewater Treatment. IWA Publishing: ISBN: 1-90-022207-8.
Strachan, L.J., Trois, C., Robinson, H.D., and Olufsen, J.S., 2000. Appropriate Biological
Treatment of Landfill Leachate with Full Nitrification and Denitrification. Conference
Proceedings, WISA 2000, Sun City, South Africa.
Suflita, J.M., Gerba, C.P., Ham, R.K., Palmisano, A.C., Rathje, W.L., and Robinson, J.A.,
1992. The World’s Largest Landfill: Multidisciplinary Investigation. Environmental
Science Technology, 26: 1486-1494.
Sun, D.D., Zeng, J.L., and Tay, J.H., 2002. A Submerged Tubular Ceramic Membrane
Bioreactor for High Strength Wastewater Treatment. Water Science and Technology,
47(1): 105-111.

138
Talinli, I., and Tokta, S., 1994. Oxygen Uptake Rate Inhibition Test: A Modified Method
for Priority Pollutants. Environmental Technology, 15: 979-988.
Tatsi, A.A., and Zouboulis, A.I., 2002. A field investigation of the quantity and quality of
leachate from a municipal solid waste landfill in a Mediterranean climate (Thessaloniki,
Greece). Advances in Environmental Research, 6: 207-219.
Tchobanoglous, G., Burton, F.L., and Stensel, H.D., 2003. Wastewater Engineering:
Treatment and Reuse. 4
th
Edition, McGraw-Hill, USA: ISBN: 0-07-112250-8.
Temmink, H., Vanrolleghem, P., Klapwijk, A., and Verstraete, W., 1993. Biological Early
Warning Systems for Toxicity Based on Activated Sludge Respirometry, Water Science
and Technology, 28(11-12): 415-425.
Thurman, E.M., and Malcolm, R.L., 1981. Preparative Isolation of Aquatic Substances.
Environmental Science and Technology, 15: 463-466.
Timur, H., and Ozturk, I., 1999. Anaerobic Sequencing Batch Reactor Treatment of
Landfill Leachate. Water Research, 33(15): 3225-3230.
Trankler, J., Manandhari, D.R., Xiaoning, Q., Sivapornpun, V., and Scholl, W., 2001.
Effects of Monsooning Conditions on the Management of Landfill Leachate in Tropical
Countries. Proceedingd Sardina’ 01, 8
th
International Waste Management and Landfill
Symposium, Cagliari, Italy: 59-68.
Tsai, C.T., Lin, S.T., Shue, Y.C., and Su, P.L., 1997. Electrolysis of Solution Organic
Matter in Leachate from Landfills. Water Research, 31(12): 3073-3081.
Turk, O., and Mavinic, D.S., 1989. Maintaining Nitrite Build-Up in a System Acclimatized
to Free Ammonia, Water Research, 23 (11): 1383-1388.
Ueda, T., Hata, K., and Kikuoka, Y., 1996. Treatment of Domestic Sewage from Rural
Settlements by a Membrane Bioreactor. Water Science and Technology, 34: 189-196.
Uloth, V.C., and Mavinic, D.S., 1977. Aerobic Biotreatment of High Strength Leachate.
Journal of the Environmental Engineering Division, ASCE, 103(EE6): 647-661.
Vanrolleghem, P.A., Spanjers, H., Petersen, B., Ginestet, P., and Takacs, I., 1999.
Estimating (combination of) activated Sludge Model No. 1 Parameters and Components by
Respirometry. Water Science and technology, 39(1): 195-214.
Venkatadri, R., and Peters, R.W., 1993. Chemical Oxidation Technologies: Ultraviolet
Light/Hydrogenperoxide, Fenton’s Reagent and Titanium Dioxide-Assisted Photocatalysis.
Hazardrous Waste and Hazardrous Materials, 10(2): 107-149.
Vicevic, G.P.., Top, P.J., and Laughlin, R.G.W., 1992. Aerobic and Anaerobic Fixed Film
Biological Reactors. In: Landfill of Waste: Leachate. Edited by Christensen, T.H., Cossu,
R., and Stegmann, R. Elsevier Science Publishers Ltd., England: ISBN: 1-85-166733-4:
229-243.

139
Visvanathan, C., Ben Aim, R., and Parameshwaran, K., 2000. Membrane Separation
Bioreactors for Wastewater Treatment. Environmental Science and Technology, 30(1): 1-
48.
Visvanathan, C., Trankler, J., Kuruparan, P., and Xiaoning, Q., 2003. Effects of
Monsooning Conditions on the Generation and Composition of Landfill Leachate-
Lysimeter Experiments with Various Input and Design Features. Proceeding Sardinia’03,
9
th
International Waste Management and Landfill Symposium, Cagliari, Italy.
Webber, W.J., and Smith, E.H., 1986. Removing Dissolved Organic Contaminants from
Water. Environmental Science and Technology, 20(10): 970-979.
Weber, B., and Holz, F., 1992. Combination of Activated Sludge Pre-treatment and
Reverse Osmosis. In: Landfill of Waste: Leachate. Edited by Christensen, T.H., Cossu, R.,
and Stegmann, R. Elsevier Science Publishers Ltd., England: ISBN: 1-85-166733-4: 323-
332.
Welander, U., Henrysson, T., and Welander, T., 1998. Biological Nitrogen Removal from
Municipal Landfill Leachate in Pilot Scale Suspended Carrier Biofilm Process. Water
Research, 32(5): 1564-1570.
Wisniewski, C., and Grasmick, A., 1998. Floc Size Distribution in a Membrane Bioreactor
and Consequences for Membrane Fouling. Colloids and Surfaces A, 138: 403-411.
Wisniewski, C., Grasmick, A., and Cruz, A.L., 2000. Critical Particle Size in Membrane
Bioreactor Case of a Denitirifying Bacterial Suspension. Journal of Membrane Science,
178: 141-150.
Wong, P.T., and Mavinic, D.S., 1984. Treatment of a Municipal Leachate under Multi-
Variable Conditions. Journal of Water Pollution Control Federation, Research, Canada.
Wu, Y.C., Hao, O.J., Ou. K.C., and Scholze, R.J., 1988. Treatment of Leachate from a
Solid Waste Landfill Site Using a Two-Stage Anaerobic Filter. Biotechnology and
Bioengineering, 31: 257-266.
Yalmaz, G., and Öztürk, I., 2001. Biological Ammonia Removal from Anaerobically Pre-
treated Landfill Leachate in Sequencing Batch Reactors (SBR). Water Science and
Technology, 43 (3): 307-314
Yamamoto, K., Hissa, M., Mahmood, T., and Matsuo, T., 1989. Direct Solid Liquid
Separation Using Hollow Fiber Membrane in an Activated Sludge Aeration Tank. Water
Science and Technology, 21: 43-54.
Yangin, C., Yilmaz, S., Altinbas, M., and Ozturk, I., 2002. A New Process for the
Combined Treatment of Municipal Wastewaters and Landfill Leachates in Coastal Areas.
Water Science and Technology, 46(8): 111-118.
Yoon, J., Cho, S., Cho, Y., and Kim, S., 1998. The Characteristics of Coagulation of
Fenton Reaction in the Removal of Landfill Leachate Organics. Water Science and
Technology, 38(2): 209-214.

140
Zaloum, R., and Abbott, M., 1997. Anaerobic Pretreatment Improves Single Sequencing
Batch Reactor Treatment of Landfill Leachates. Water Science and Technology, 35(1),
207-214.
Zapf-Gilje, R., and Mavinic, D.S., 1981. Temperature Effects on Biostabilization of
Leachate. Journal of the Environmental Engineering Division, ASCE, 107(EE4): 653-663.

141
Appendix A
Pictures of Experiments
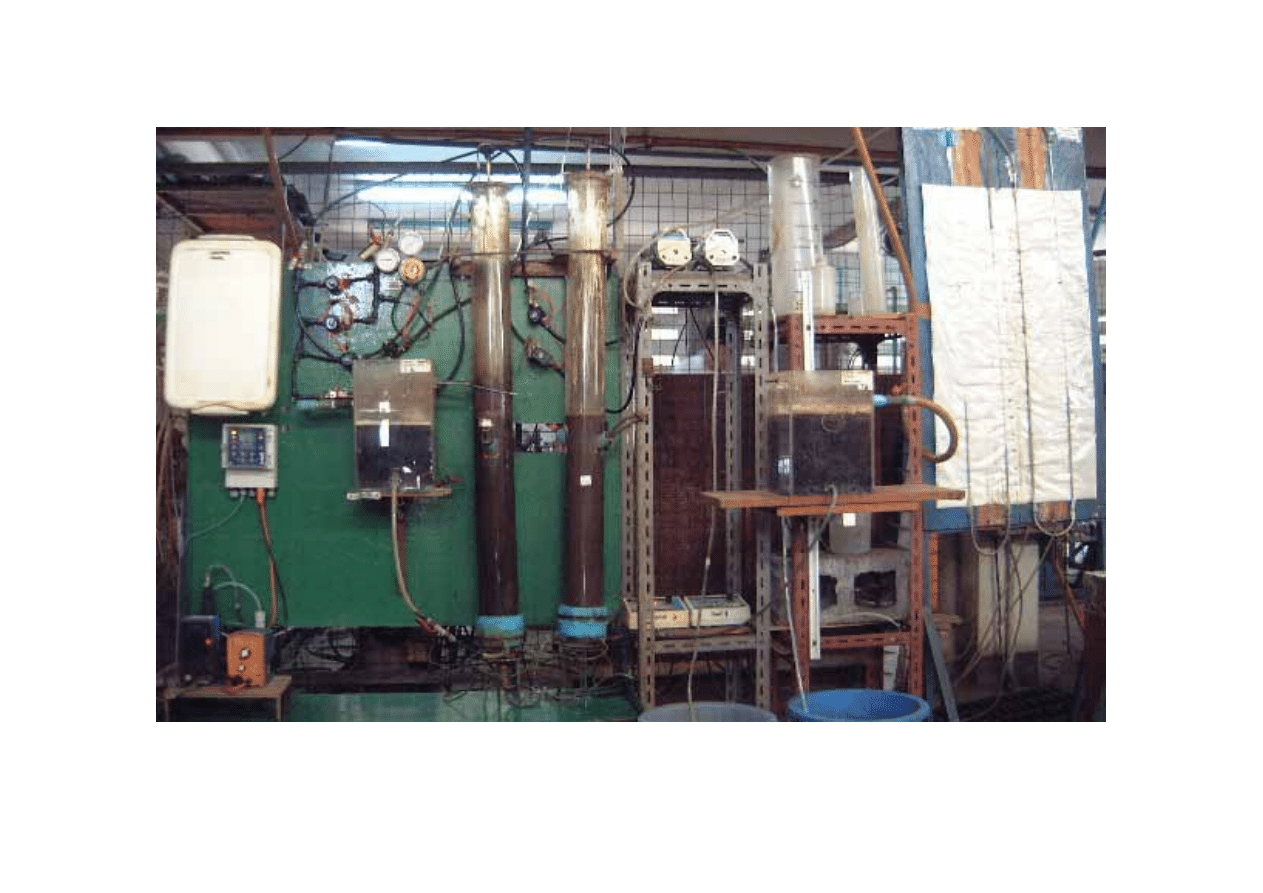
142
Figure A-1 YMBR and BMBR Reactors
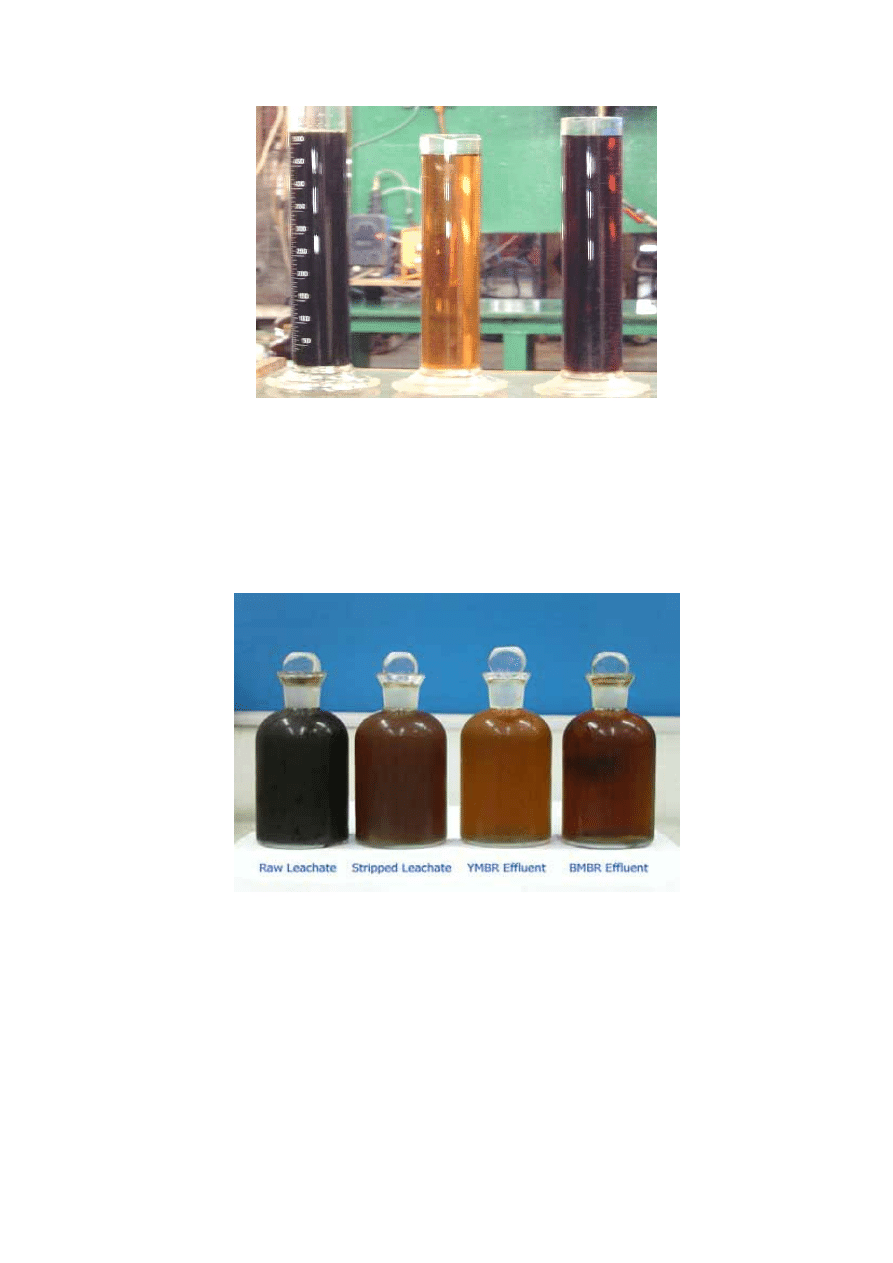
143
Figure A-2 Color Comparison of Raw Leachate with Selected Water after Treatment
(MBR System)
Figure A-3 Color Comparison of Raw Leachate with Selected Water after Treatment
(Coupling Ammonia Stripping with MBR System)
R a w L e a c h a te
Y M B R E fflu e n t
B M B R E fflu e n t
R a w L e a c h a te
Y M B R E fflu e n t
B M B R E fflu e n t

144
Figure A-4 Characteristics of Membrane
New Membrane
After Long-run
(YMBR)
After Washing
with Tap Water
After Chemical
Cleaning
After Long-run
(BMBR)
New Membrane
After Long-run
(YMBR)
After Washing
with Tap Water
After Chemical
Cleaning
After Long-run
(BMBR)
New Membrane
After Long-run
(YMBR)
After Washing
with Tap Water
After Chemical
Cleaning
After Long-run
(BMBR)

145
Appendix B
Leachate Characteristics and
Experimental Data of Acclimation
146
Table B-1 Leachate Characteristic of the Primary Sources and the Feed
Pathumthani Landfill Site
Ram-Indra Transfer Station
Feed
Sample No.
NH
4
+
-N
(mg/L)
TKN
(mg/L)
COD
(mg/L)
NH
4
+
-N
(mg/L)
TKN
(mg/L)
COD
(mg/L)
NH
4
+
-N
(mg/L)
TKN
(mg/L)
COD
(mg/L)
1
2,184 2,349 5,410 349 1,292
87,200
1,831 2,013 7,412
2
1,820 1,968 3,660 333 1,247
85,020
1,537 1,719 7,521
3
1,691 1,882 4,230 319 1,652
73,840
1,562 1,848 7,692
4
1,691 1,882 4,100 336 1,249
32,190
1,604 1,893 8,195
5
1,781 2,050 3,940 448 1,361
34,280
1,669 1,957 7,200
6
1,756 2,019 4,170 333 1,226
33,330
1,753 1,982 7,000
7
1,607 1,884 3,288 409 921 31,151 1,417 1,750 7,233
8
1,719 2,044 3,243 434 879 32,432 1,442 1,764 7,135
147
Table B-2 Acclimation of Mixed Yeast Sludge to Landfill Leachate Containing High
Organic and Ammonia Concentration
COD (mg/L)
Time
(days)
Influent Effluent
COD Removal
(%)
MLSS
(mg/L)
F/M ratio
(d
-1
)
1 3,800
2,090 45 3,750
1.01
3 3,800
1,710 55 3,933
0.97
6 4,000
1,440 64 4,233
0.94
9 4,000
1,320 67 4,533
0.88
12 4,150
1,287 69 4,800
0.86
14 4,150
1,245 70 5,367
0.77
17 4,320
1,210 72 5,633
0.77
21 4,320
1,166 73 6,240
0.69
25 4,800
1,296 73 6,560
0.73
29 4,800
1,248 74 6,740
0.71
35 4,800
1,200 75 7,040
0.68
39 5,530
1,438 74 7,540
0.73
42 5,530
1,327 76 8,167
0.68
44 5,,530
1,272 77 8,667
0.64
46 6,105
1,526 75 9,800
0.62
50 6,105
1,404 77 10,450
0.58
52 7,071
1,697 76 10,750
0.66
54 7,071
1,838 74 11,240
0.63
56 7,300
1,898 74 11,400
0.64
58 7,300
1,825 75 11,950
0.61
61 7,300
1,898 74 11,850
0.62
67 7,300
1,825 75 11,700
0.62

148
Table B-3 Acclimation of Mixed Bacteria Sludge to Landfill Leachate Containing High
Organic and Ammonia Concentration
COD (mg/L)
Time
(days)
Influent Effluent
COD Removal
(%)
MLSS
(mg/L)
F/M ratio
(d
-1
)
1 3,800
2,014 47 2,620
1.45
3 3,800
1,786 53 2,667
1.42
6 4,000
1,640 59 2,860
1.40
9 4,000
1,600 60 3,060
1.31
12 4,150
1,577 62 3,300
1.26
14 4,150
1,577 62 3,740
1.11
17 4,320
1,555 64 3,880
1.11
21 4,320
1,469 66 4,233
1.02
25 4,800
1,632 66 4,467
1.07
29 4,800
1,632 66 4,833
0.99
35 4,800
1,680 65 5,150
0.93
39 5,530
1,880 66 5,260
1.05
42 5,530
1,880 66 5,367
1.03
44 5,530
1,825 67 5,480
1.01
46 6,105
2,076 66 5,733
1.06
50 6,105
2,198 64 6,260
0.98
52 7,071
2,616 63 6,380
1.11
54 7,071
2,475 65 6,360
1.11
56 7,300
2,628 64 6,340
1.15
58 7,300
2,482 66 6,380
1.14
61 7,300
2,555 65 6,380
1.14
67 7,300
2,482 66 6,420
1.14

149
Appendix C
Experimental Data of Biokinetic Study and Toxicity Study
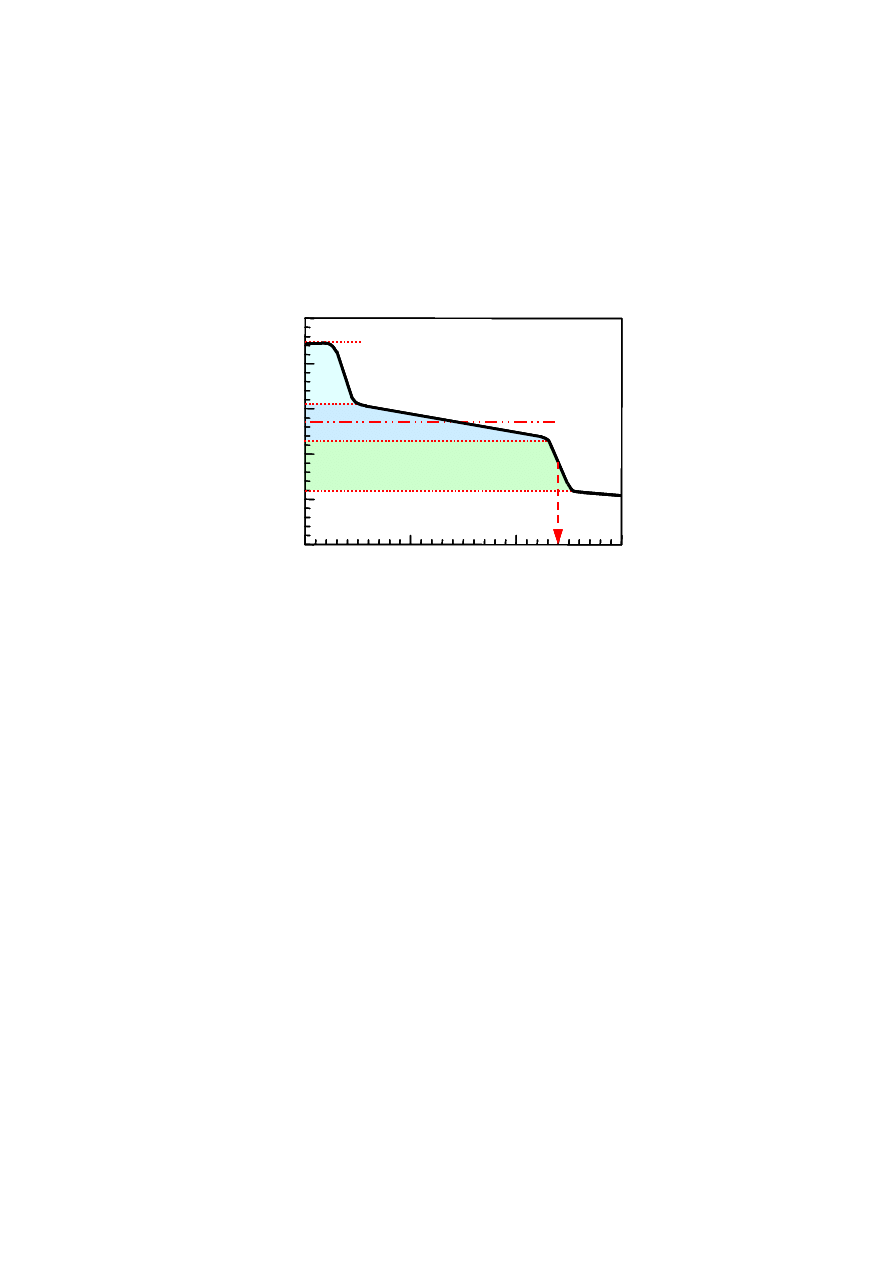
150
C.1 OUR Determination
In this study a selected volume of wastewater of known total COD is mixed with a
selected volume of mixed liquor of known MLVSS concentration in a batch reactor. After
mixing, the OUR is measured approximately every 5 to 10 minutes until OUR attains to a
constant value that is approximate or equal to OUR in the endogenous phase (Ekama, et al.,
1986). The respirogram is obtained by plotting the curve of OUR versus time as shown in
Figure C-1.
Figure C-1 OUR Response in Respirometer (Ekama, et al., 1986)
Where
Area A:
This area gives the concentration of readily biodegradable COD
oxidized by the biomass.
Area B:
This area represents the amount of less readily biodegradable
material being oxidized.
Area C:
This area shows the amount of oxygen being used to convert
ammonia into oxidized nitrate (nitrification).
Area D:
The area under the whole curve shows the total oxygen demand of
the liquor. This is the total amount of oxygen which must be
supplied to the sludge to achieve full treatment.
OUR at line e: The respiration rate at the end of the curve is the endogenous
respiration rate. This rate is proportional to the activity of the
biomass.
OUR at line f: This rate is the average respiration rate for the period where
nitrification and the breakdown of less readily biodegradable
substrates are occurring.
f
A
B
C
D
T
g
e
Time (min)
OUR (m
g
/L
.h
)
f
A
B
C
D
T
f
A
B
C
D
T
g
e
Time (min)
OUR (m
g
/L
.h
)
g
e
Time (min)
OUR (m
g
/L
.h
)

151
OUR at line g: This is the maximum respiration rate observed at the start-up of the
respiration cycles. At this point all oxidative reactions take place,
including the oxidation of carbon and nitrogen.
Time T:
The time for the sample to reach an endogenous respiration rate.
Specific OUR of substrate oxidation at a substrate concentration S (OUR
x,ox
) is given
by:
e
X
t
X
ox
X
OUR
OUR
OUR
,
,
,
−
=
(C-1)
Where:
OUR
x,t
=
Total respiration rate (mg O
2
/mg VSS.h)
OUR
x,e
=
Endogenous respiration rate (mg O
2
/mg VSS .h)
Further specific substrate removal rate at a substrate concentration S (
R
X
) is given by:
S
OC
OUR
R
ox
X
X
/
,
=
(C-2)
Where
R
X
=
Substrate removal rate (mg COD removed/mg VSS.h)
OC
=
Net oxygen consumption (mg O
2
/L)
S
=
Substrate concentration (mg COD/L)
OC is then equal to the area between the OUR curve and the second plateau level
where the OUR decreases rapidly and levels off (
OC = Area A+area B) (Figure C-1)
Biomass yield coefficient (
Y) is expressed as:
⎟
⎠
⎞
⎜
⎝
⎛ −
=
S
OC
f
Y
1
1
(C-3)
and the specific growth rate (
µ
) as:
X
R
Y.
=
µ
(C-4)
Where
µ
=
Specific growth rate (h
-1
)
f
=
COD/VSS ratio of the sludge (mg COD/mg VSS)
Y
=
Yield coefficient (mg VSS/mg COD removed)

152
Table C-1 Biokinetic Experimental Data of Mixed Bacterial Sludge with Leachate
S
(mg COD/L)
OUR
x,t
(mg O
2
/mg VSS. h)
OUR
x,e
(mg O
2
/mg VSS. h)
OC
(mg O
2
/L)
OUR
x,ox
(mg O
2
/mg VSS. h)
OC/S
r
x
(mg COD/mg VSS. h)
Y
vss
(mg VSS/mg COD)
µ
(day
-1
)
7.0 0.0080 0.0036 3.3 0.0044
0.47
0.0093
0.39 0.09
14.0 0.0084 0.0039 3.4 0.0045
0.24 0.0185
0.56 0.25
21.0 0.0082 0.0036 3.8 0.0047
0.18 0.0259
0.60 0.38
42.0 0.0123 0.0042 10.7 0.0081
0.25 0.0318
0.55 0.42
Table C-2 Biokinetic Experimental Data of Mixed Yeast Sludge with Leachate
S
(mg COD/L)
OUR
x,t
(mg O
2
/mg VSS. h)
OUR
x,e
(mg O
2
/mg VSS. h)
OC
(mg O
2
/L)
OUR
x,ox
(mg O
2
/mg VSS. h)
OC/S
r
x
(mg COD/mg VSS. h)
Y
vss
(mg VSS/mg COD)
µ
(day
-1
)
5.6 0.0031 0.0008 1.62 0.0023 0.29 0.0080
0.50 0.09
11.2 0.0040 0.0011 3.40 0.0029 0.30 0.0096
0.49 0.11
16.8 0.0052 0.0012 5.04 0.0040 0.30 0.0133
0.49 0.16
28.0 0.0097
0.0016 10.40 0.0081 0.37 0.0218
0.44 0.23
40.8 0.0067
0.0008 10.87 0.0059 0.27 0.0221
0.51 0.27

153
Table C-3 Experimental Results for Ammonia Toxicity in Mixed Bacterial Sludge at COD Concentration of 7.0 mg/L
NH
4
Cl
(mg NH
4
-N/L)
OUR
x,t
(mg O
2
/mg VSS. h)
OUR
x,e
(mg O
2
/mg VSS. h)
OC
(mg O
2
/L)
OUR
x,ox
(mg O
2
/mg VSS. h)
OC/S
r
x
(mg COD/mg VSS. h)
Y
vss
(mg VSS/mg COD)
µ
(day
-1
)
70 0.0078 0.0031
3.30
0.0047
0.47
0.0100
0.39 0.09
1000 0.0062 0.0033 3.38 0.0029
0.48 0.0060
0.38 0.05
1500 0.0066 0.0038 3.64 0.0028
0.52 0.0054
0.35 0.05
2000 0.0061 0.0034 4.23 0.0027
0.60 0.0045
0.29 0.03
Table C-4 Experimental Results for Ammonia Toxicity in Mixed Yeast Sludge at COD Concentration of 5.6 mg/L
NH
4
Cl
(mg NH
4
-N/L)
OUR
x,t
(mg O
2
/mg VSS. h)
OUR
x,e
(mg O
2
/mg VSS. h)
OC
(mg O
2
/L)
OUR
x,ox
(mg O
2
/mg VSS. h)
OC/S
r
x
(mg COD/mg VSS. h)
Y
vss
(mg VSS/mg COD)
µ
(day
-1
)
70 0.0031 0.0008
1.62
0.0023
0.29
0.0080
0.50 0.09
1000 0.0031 0.0009 1.67
0.00225
0.30 0.0075
0.49 0.09
1500 0.0030 0.0007 1.72 0.0023
0.31 0.0075
0.48 0.09
2000 0.0031 0.0008 1.68 0.0023
0.30 0.0077
0.49 0.09

154
Table C-5 Experimental Results for Lead Toxicity of Mixed Bacteria Sludge at COD Concentration of 7.0 mg/L
Pb(NO
3
)
2
(mg/L)
OUR
x,t
(mg O
2
/mg VSS. h)
OUR
x,e
(mg O
2
/mg VSS. h)
OC
(mg O
2
/L)
OUR
x,ox
(mg O
2
/mg VSS. h)
OC/S
r
x
(mg COD/mg VSS. h)
Y
vss
(mg VSS/mg COD)
µ
(day
-1
)
0 0.0078 0.0031
3.30
0.0047
0.47
0.0100 0.39
0.09
20 0.0061 0.0038
2.77
0.0023
0.40
0.0058
0.44 0.06
50 0.0051 0.0038
2.22
0.0013
0.32
0.0041
0.50 0.05
70 0.0042 0.0036
1.65
0.0006
0.24
0.0025
0.56 0.03
100 0.0032 0.0031
0.95
0.0001
0.14 0.0007
0.64 0.01
Table C-6 Experimental Results for Lead Toxicity of Mixed Yeast Sludge at COD Concentration of 5.6 mg/L
Pb(NO
3
)
2
(mg/L)
OUR
x,t
(mg O
2
/mg VSS. h)
OUR
x,e
(mg O
2
/mg VSS. h)
OC
(mg O
2
/L)
OUR
x,ox
(mg O
2
/mg VSS. h)
OC/S
r
x
(mg COD/mg VSS. h)
Y
vss
(mg VSS/mg COD)
µ
(day
-1
)
0.0 0.0031 0.0008
1.62
0.0023
0.29
0.0080
0.50 0.09
2.5 0.0022 0.0007
1.32
0.0015
0.24
0.0064
0.53 0.08
5.0 0.0023 0.0012
1.31
0.0011
0.23
0.0047
0.54 0.06
15.0 0.0017 0.0009
1.33
0.0008
0.24 0.0034
0.53 0.04
25.0 0.0013 0.0010
2.68
0.0003
0.48 0.0006
0.36 0.01

155
Appendix D
Membrane Resistance Studies

156
Table D-1 Experimental Data for Determination of Initial Membrane Resistance of
BMBR Membrane (A = 0.42 m
2
; Pore Size = 0.1 µm; Temperature = 30.7º C)
Trans-membrane Pressure
Flowrate
(L/h)
Permeate Flux
(L/m
2
.h)
(mmHg) (kPa)
14 34 45
6
32 76 88
12
48 115 138
18
57 135 160
21
65 155 183
24
Table D-2 Experimental Data for Determination of Initial Membrane Resistance of YMBR
Membrane (A = 0.42 m
2
; Pore Size = 0.1 µm; Temperature = 30.7º C)
Trans-membrane Pressure
Flowrate
(L/h)
Permeate Flux
(L/m
2
.h)
(mmHg) (kPa)
15 37 55
7
22 52 70
9
36 86 110
14
49 117 153
20
62 147 187
25

157
Table D-3 Experimental Data for Determination of Initial Membrane Resistance in YMBR
after Cleaning
(a)
Trans-membrane Pressure
Flowrate
(L/h)
Permeate Flux
(L/m
2
.h)
(mmHg) (kPa)
2.29 5.4 8 1.1
3.92 9.3 19 2.5
8.05 19.2 32 4.2
13.10 31.2 36 4.7
(b)
Trans-membrane Pressure
Flowrate
(L/h)
Permeate Flux
(L/m
2
.h)
(mmHg) (kPa)
3.00 7.1 78 10.3
3.03 7.2 80 10.5
3.11 7.4 84 11.1
3.36 8.0 88 11.6
3.55 8.4 90 11.8
(c)
Trans-membrane Pressure
Flowrate
(L/h)
Permeate Flux
(L/m
2
.h)
(mmHg) (kPa)
0.48 7.1 78 10.3
0.72 7.2 80 10.5
1.02 7.4 84 11.1
1.50 8.0 88 11.6
2.88 8.4 90 11.8
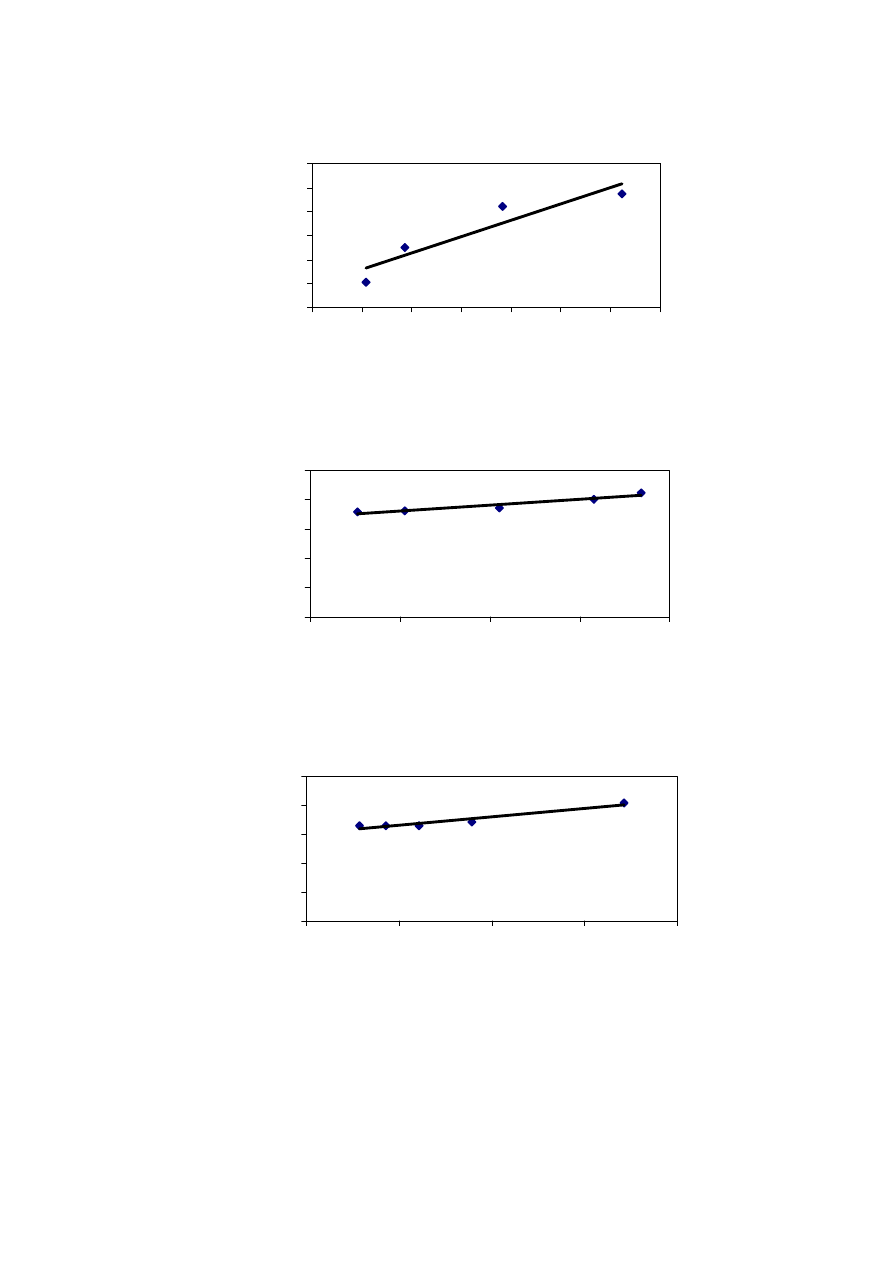
158
Figure D-1 Graphs Showing Initial Membrane Resistance in YMBR after Cleaning
R
2
= 0.8687
0
1
2
3
4
5
6
0
5
10
15
20
25
30
35
Flux (L/m
2
.h)
Pressure (kPa)
(a)
y = 0.7997x - 1.1956
R
2
= 0.9186
0
2
4
6
8
10
10.0
10.5
11.0
11.5
12.0
Flux (L/m
2
.h)
Pres
sure (k
Pa)
(b)
y = 0.2911x + 6.0323
R
2
= 0.9239
0
2
4
6
8
10
0
2
4
6
8
Flux (L/m
2
.h)
Pressur
e (kPa)
(c)

159
Table D-4 Experimental Data for Determination of Initial Membrane Resistance in BMBR
after Cleaning
(a)
Trans-membrane Pressure
Flowrate
(L/h)
Permeate Flux
(L/m
2
.h)
(mmHg) (kPa)
2.29 5.4 32 4.2
3.92 9.3 40 5.3
8.05 19.2 66 8.7
13.10 31.2
80 10.5
17.02 40.5 162 21.3
(b)
Trans-membrane Pressure
Flowrate
(L/h)
Permeate Flux
(L/m
2
.h)
(mmHg) (kPa)
0.92 2.2 40 5.2
5.72 13.6 53 7.0
8.59 20.5 71 9.3
10.88 25.9
77 10.1
16.42 39.1 104 13.7
19.56 46.6 122 16.1
(c)
Trans-membrane Pressure
Flowrate
(L/h)
Permeate Flux
(L/m
2
.h)
(mmHg) (kPa)
0.6 2.0
76 10.0
1.0 3.6
86 11.3
4.5 16.3
106 13.9
7.1 17.1
125 16.4
11.4 41.2
160 21.1
(d)
Trans-membrane Pressure
Flowrate
(L/h)
Permeate Flux
(L/m
2
.h)
(mmHg) (kPa)
6.00 14.3 64 8.4
6.18 14.7 68 8.9
6.48 15.4 70 9.2
6.78 16.1 72 9.5
6.90 16.4 76 10.0

160
(e)
Trans-membrane Pressure
Flowrate
(L/h)
Permeate Flux
(L/m
2
.h)
(mmHg) (kPa)
1.56 3.7 78 10.4
4.20 10.0 82 10.9
8.28 19.7 95 12.7
8.52 20.3 96 12.8
11.22 26.7 108 14.4
19.68 46.9 138 18.4
Table D-5 Experimental Data for Determination of Initial Membrane Resistance of 2
nd
Membrane in (a) BMBR and (b) YMBR
(a)
Trans-membrane Pressure
Flowrate
(L/h)
Permeate Flux
(L/m
2
.h)
(mmHg) (kPa)
0.5 1.2 74
9.9
1.2 2.9 78
10.4
3.2 7.6 82
10.9
5.2 12.4 84
11.2
9.9 23.6 102
13.6
(b)
Trans-membrane Pressure
Flowrate
(L/h)
Permeate Flux
(L/m
2
.h)
(mmHg) (kPa)
0.5 1.2 65
8.7
1.2 2.9 68
9.1
2.0 4.8 72
9.6
3.2 7.6 82
10.9
5.2 12.4 84
11.2
9.9 23.6 102
13.6
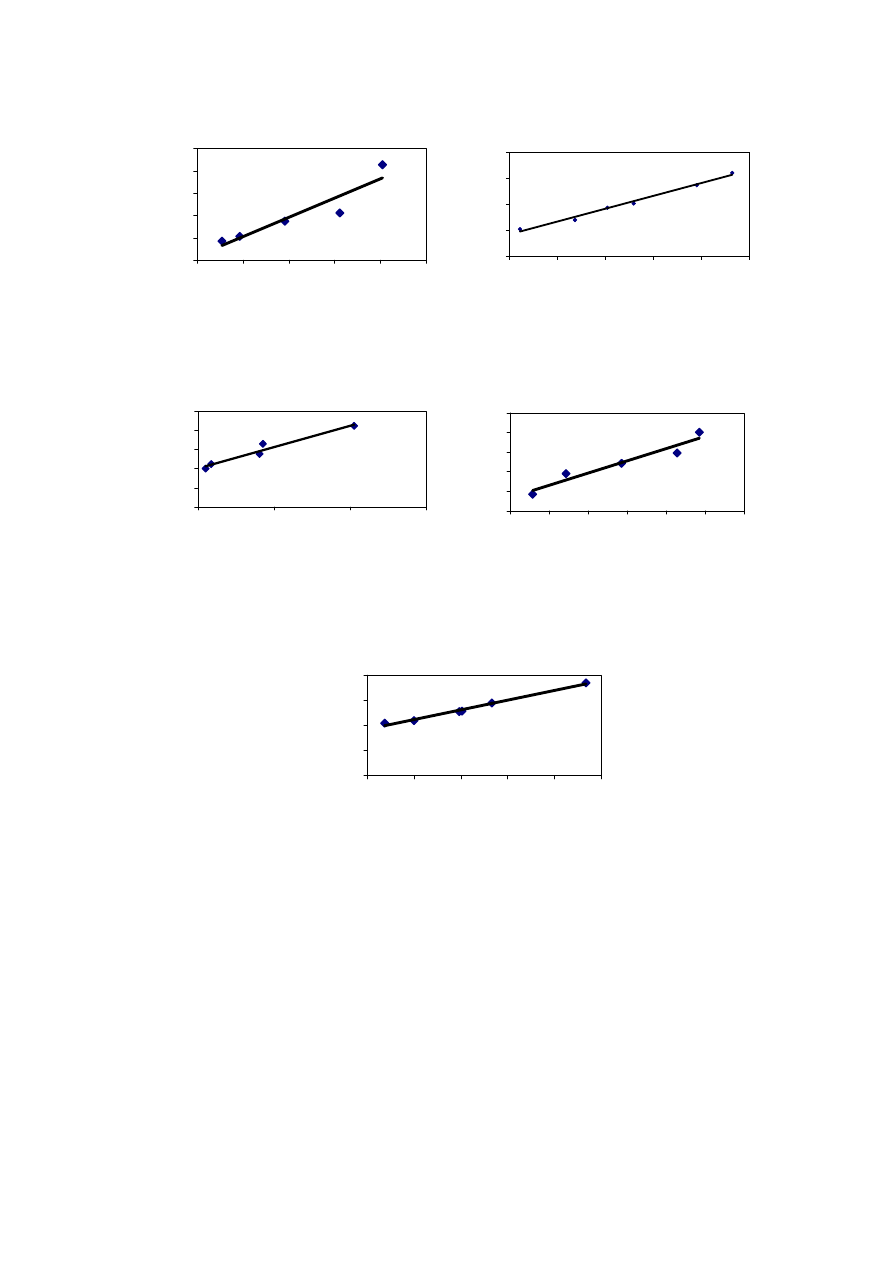
161
Figure D-2
Graphs Showing Initial Membrane Resistance in BMBR after Cleaning
R
2
= 0.9889
0
5
10
15
20
0.0
10.0
20.0
30.0
40.0
50.0
Flux (L/m
2
.h)
P
re
ss
u
re
(k
P
a)
(b)
R
2
= 0.868
0
5
10
15
20
25
0.0
10.0
20.0
30.0
40.0
50.0
Flux (L/m
2
.h)
Pressure (
k
Pa)
(a)
R
2
= 0.9514
0
5
10
15
20
25
0.0
20.0
40.0
60.0
Flux (L/m
2
.h)
P
re
ss
u
re
(k
P
a
)
(c)
R
2
= 0.9291
8
9
9
10
10
11
14.0
14.5
15.0
15.5
16.0
16.5
17.0
Flux (L/m
2
.h)
Pr
essu
re (kPa)
(d)
R
2
= 0.9881
0
5
10
15
20
0.0
10.0
20.0
30.0
40.0
50.0
Flux (L/m
2
.h)
Pressu
re (k
Pa)
(e)
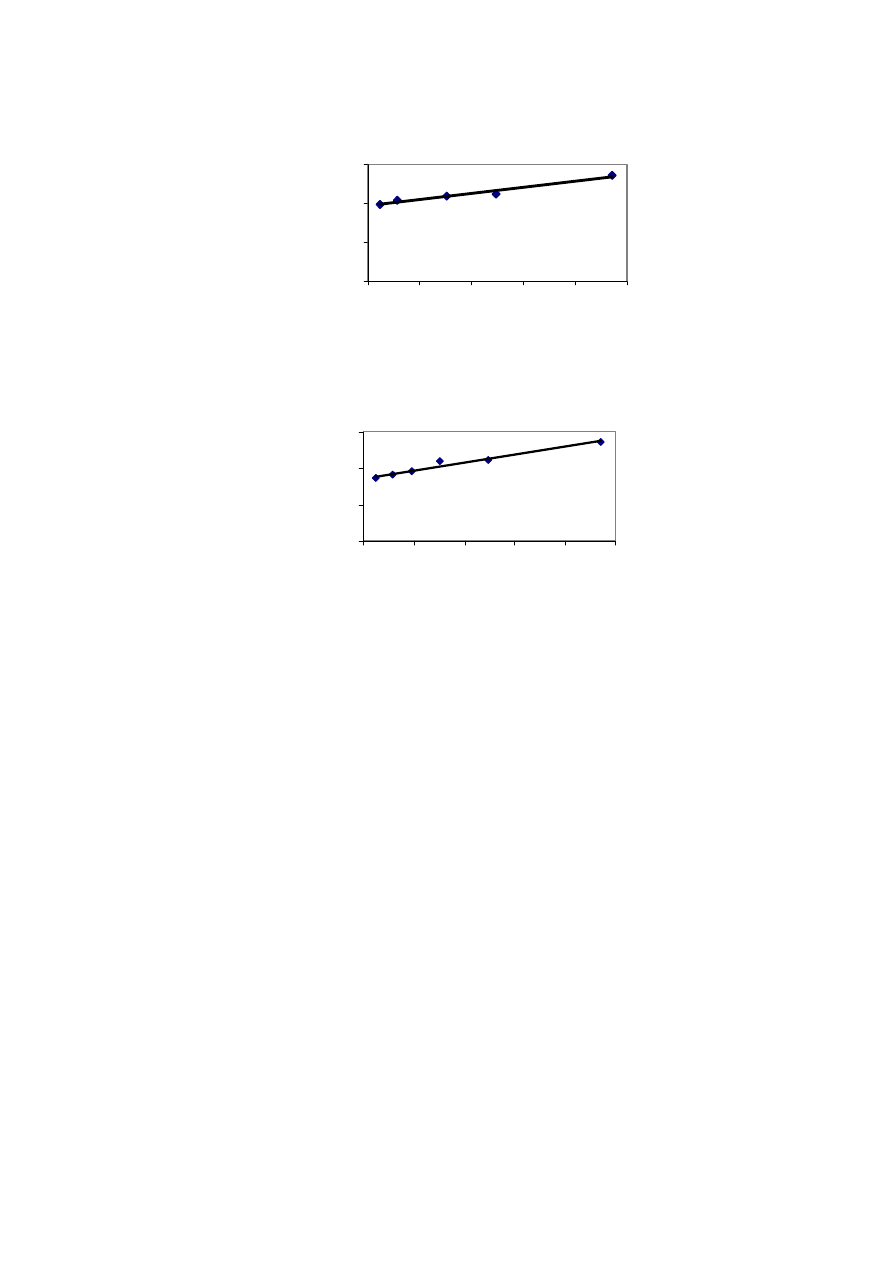
162
Figure D-3 Graphs Showing Initial Membrane Resistance of 2
nd
Membrane in (a) BMBR
and (b) YMBR
y = 0.1568x + 9.7058
R
2
= 0.9634
0
5
10
15
0.0
5.0
10.0
15.0
20.0
25.0
Permeate Flux (L/m
2
.h)
Trans-me
mbrane Pressu
re
(k
Pa)
(a)
y = 0.2161x + 8.6241
R
2
= 0.9671
0
5
10
15
0.0
5.0
10.0
15.0
20.0
25.0
Permeate Flux (L/m
2
.h)
T
ran
s-
me
mb
ra
n
e P
res
su
re
(kP
a)
(b)

163
Appendix E
MBR without Ammonia Stripping
164
Table E-1 Feed, Reactor and Effluent Characteristics in BMBR
Feed Reactor
Effluent
Removal
(%)
Day
HRT
(h)
pH
COD
(mg/L)
NH
3
-N
(mg/L)
TKN
(mg/L)
pH
DO
(mg/L)
MLSS
(mg/L)
COD
Loading
(kg/m
3
.d)
F/M
Ratio
COD
(mg/L)
TKN
(mg/L)
NH
3
-N
(mg/L)
COD TKN
1
24
7.2
7,384
7.4
5.3
12,800
7.38
0.58
5
24
7.3
7,140
7.4
4.8
10,980
7.14
0.67
3,094
57
8
24
7.7
7,736
7.2
5.6
7.74
2,618
66
9 24 7.3 6,752 1,705 1,705 7.0 5.0
6.75
3,174 1,319 1,266 53
26
16 24 7.3 7,981 1,843 1,852 7.0 6.1 10,950 7.98 0.73 2,777 1,356
65
26
22 24 7.5 8,331 1,618 1,619 7.0 2.8 11,450 8.33 0.73 3,253 1,230
61
24
26
20
7.4
6,336
7.0
2.6
7.60
2,611
59
28 20 7.3 9,216 1,704 1,967 6.9 3.5
11.06
4,562 1,336 1,285 50
35
35 20 7.0 9,094 1,459 1,653 6.8 2.6 14,167 10.91 0.77 3,375 1,173 1,110 63
24
43 20 7.4 7,938 1,278 1,376 7.0 4.2
9.53
1,883 1,031 955 76
13
48 20 7.6 9,281 1,260 1,764 7.2 3.1
11.14 0.60 2,936 1,482 1,233 68
16
54
20
7.6
9,281
6.9
4.0
12,600
11.14
0.66
2,618
72
61 16 7.4 7,442 1,536 1,796 6.9 3.8
11.16 0.68 2,764 1,279 1,221 58
29
66 16 7.0 9,322 1,511 1,960 7.1 4.5 11,900 13.98 1.36 2,618 1,384 1,233 72
29
68
16
7.5
9,322
6.9
3.1
12,733
13.98
1.10
3,134
66
72 16 7.3 7,282 1,217 1,698 6.8 3.5 12,000 10.92 1.06 1,764 1,324 1,196 76
22
78 16 7.8 6,358 1,735 1,837 6.9 3.6
9.54
3,077 1,246 1,194 52
25
83
16
7.5
7,415
7.0
4.2
13,000
11.12
0.99
2,576
65
89 16 7.9 8,529 1,735 1,837 7.0 3.6
12.79 1.66 3,282 1,378 1,221 61
25
90 16 8.2 8,529 1,232 1,560 6.9 3.3 10,067 12.79 1.47 3,332 1,237 1,176 61
15
94
16
8.1
7,759
7.0
3.0
14,400
11.64
0.94
3,248
58
97 16 8.5 8,735
1,764 7.0 3.2 9,667 13.10 1.57 3,282 1,482 1,233 62
16
104
16
8.7
8,662
7.0
4.6
13,700
12.99
1.10
3,320
62
107 16 8.7 8,662
1,796 6.8 4.1
12.99 1.00 3,077 1,384 1,185 64
23
165
Feed Reactor
Effluent
Removal
(%)
Day
HRT
(h)
pH
COD
(mg/L)
NH
3
-N
(mg/L)
TKN
(mg/L)
pH
DO
(mg/L)
MLSS
(mg/L)
COD
Loading
(kg/m
3
.d)
F/M
Ratio
COD
(mg/L)
TKN
(mg/L)
NH
3
-N
(mg/L)
COD TKN
117
16
8.2
9,600
7.2
3.1
12,333
14.40
1.86
3,282
66
119 16 8.4 6,957 2,045 2,253 7.1 4.2 14,067 10.43 0.86 3,140 1,515 1,460 55
35
124 16 8.2 8,735 1,691 2,145 7.3 2.2
13.10 1.32 4,182 1,389 1,322 67
27
130 16 7.4 7,938 1,778 2,156 7.2 2.6 11,600 11.91 1.31 3,653 1,497 1,439 58
31
136 16 7.4 7,938 1,106 1,613 7.0 3.2 11,567 11.91 1.40 3,282 1,258 1,176 59
22
141
16
8.2
7,759
8.4
2.3
10,900
11.64
1.07
3,320
57
145 16 7.9 7,646 1,837 2,093 8.3 7.6 13,533 11.47 1.39 3,077 1,581 1,361 60
24
150
12
8.2
8,938
2,066
8.3
0.6
10,900
17.88
2.41
3,896
56
157 12 8.5 8,000 1,831 2,013 8.8 6.6 12,333 16.00 1.98 4,308 1,753 1,574 46
13
164 12 8.1 7,344 1,540 1,837 7.1 1.8 11,567 14.69 1.79 3,830 1,504 1,358 48
18
169 12 8.0 7,077 1,590 1,876 7.1 3.8 11,000 14.15 1.56 3,538 1,649 1,355 50
12
173 12 8.1 7,076 1,562 1,848 7.0 5.7 10,233 14.15 1.62 3,231 1,658 1,364 54
10
176 12 8.1 7,050 1,604 1,893 7.1 4.5 13,533 14.10 1.52 3,450 1,672 1,403 51
12
179 12 8.1 7,077 1,649 1,960 7.1 2.8 11,567 14.15 1.90 3,538 1,593 1,324 50
19
181 12 8.2 6,962 1,607 1,893 7.1 3.6 11,000 13.92 1.91 3,073 1,688 1,464 56
11
166
Table E-2 Feed, Reactor and Effluent Characteristics in YMBR
Feed Reactor
Effluent
Removal
(%)
Day
HRT
(h)
pH
COD
(mg/L)
NH
3
-N
(mg/L)
TKN
(mg/L)
pH
DO
(mg/L)
MLSS
(mg/L)
COD
Loading
(kg/m
3
.d)
F/M
Ratio
COD
(mg/L)
TKN
(mg/L)
NH
3
-N
(mg/L)
COD TKN
1
24
7.2
7,384
3.6
5.0
8,940
7.38
0.83
5
24
7.3
7,140
3.6
4.0
11,650
7.14
0.61
3,015
58
8
24
7.7
7,736
3.6
7.9
7.74
2,380
69
9 24 7.3 6,752 1,705 1,705 3.6 7.3
6.75
2,460 1,221 1,221 64
28
16
24
7.3
7,987
3.6
7.9
7.99
3,015
62
17 24 7.5 7,981 1,843 1,852 3.6 7.9 10,820 7.98 0.74 3,094 1,336 1,285 61
28
22
24
7.5
8,331
1,618
1,619
3.6
8.0
8.33
3,332
60
24
24
7.4
8,504
3.6
8.0
8.50
3,099
64
26
20
7.3
6,336
3.6
7.6
7.60
3,456
28 20 7.0 9,216 1,704 1,967 3.6 3.9
11.06
3,295 1,611 1,515 64
18
35 20 7.4
9,094 1,459 1,653
3.6 4.0 12,180 10.91 1.04 3,563 1,322 1,252 61 20
40
20
7.6
9,744
3.6
4.2
9,720
11.69
1.40
2,959
70
43
20
7.6
7,938
1,278
1,376
3.6
4.8
9.53
3,286
59
48 20 7.0 9,281 1,260 1,764 3.6 4.2
11.14 0.78 3,563 1,159 1,036 62
34
54
20
6.7
9,281
1,449
3.6
4.9
11,867
11.14
0.87
1,002
918
31
57
20
7.4
8,372
3.6
4.6
10,567
7.64
0.95
2,489
61
61 16 7.0 7,442 1,536 1,796 3.6 4.0
11.16 0.62 2,800 1,226 823
62
32
66
16
7.5
9,322
3.6
3.4
13.98
1.02
2,698
71
68 16 7.5
9,322 1,511 1,960
3.6 3.4 13,033 13.98 1.24 2,579 1,567 1,484 72 20
72 16 7.3
7,282 1,217 1,698
3.6 3.5 11,700 10.92 1.08 1,862 1,378 1,221 74 19
78
16
7.8
6,358
1,837
3.6
3.6
12,433
9.54
0.89
1,345
1,284
27
84 16 7.5
7,415 1,735 1,837
3.6 4.6 11,600 11.12 1.11 2,831 1,194 1,194 62 35
88 16 7.9
7,415 1,232 1,560
3.6 3.5 11,933 11.12 1.08 2,576 1,322 1,106 65 15
90
16
8.2
8,529
1,232
1,560
3.6
2.0
10,367
12.79
1.43
2,142
75
94
16
8.1
7,759
3.6
2.0
13,067
11.64
1.03
3,104
60
167
Feed Reactor
Effluent
Removal
(%)
Day
HRT
(h)
pH
COD
(mg/L)
NH
3
-N
(mg/L)
TKN
(mg/L)
pH
DO
(mg/L)
MLSS
(mg/L)
COD
Loading
(kg/m
3
.d)
F/M
Ratio
COD
(mg/L)
TKN
(mg/L)
NH
3
-N
(mg/L)
COD TKN
104
16
8.5
8,662
3.6
3.3
10,000
12.99
1.51
3,176
63
107 16 8.7
8,662
1,796
3.6 4.6 12,600 12.99 1.20 3,409 1,279 1,176 61 29
117
16
8.7
9,600
3.6
4.9
11,367
14.40
1.47
3,757
61
119 16 8.2 6,957 2,045 2,253 3.6 3.7 12,333 10.43 0.98 2,769 1,440 818
60
36
124 16 8.4 8,735 1,691 2,145 3.6 4.7 9,533 13.10 1.59 2,470 1,389 1,221 72
35
130 16 8.2
7,938 1,778 2,156
3.6 3.5 12,700 11.91 1.09 1,985 1,482 1,110 75 31
136
16
7.4
7,938
1,106
1,613
3.6
4.8
11,367
11.91
1.22
2,483
69
141 16 7.4 7,759
1,613 3.6 3.2 12,700 11.64 1.06 3,070 1,313
60
19
148
16
8.2
7,646
1,854
3.6
5.2
10,233
15.29
1.49
2,146
72
150 12 7.9
8,938
2,066
3.6 3.5 10,900 17.88 1.64 3,320 1,581 1,358 63 23
157
12
8.2
8,000
1,831
2,013
3.6
0.4
11,867
16.00
1.35
3,231
60
160 12 8.5
8,566
2,093
3.6 6.9 10,833 17.13 1.58 4,273 1,798 1,610 50 11
164 12 8.1
7,344 1,540 1,837
3.6 2.5 11,567 14.69 1.27 3,515 1,456 1,331 52 15
169 12 8.0
7,077 1,590 1,876
3.6 6.1 11,867 14.15 1.19 3,385 1,504 1,352 52 20
173 12 8.1
7,076 1,562 1,848
3.6 2.6 11,900 14.15 1.19 3,038 1,512 1,361 57 18
176 12 8.1
7,050 1,604 1,893
3.6 3.2 13,533 14.10 1.04 3,300 1,599 1,375 53 16
179 12 8.1
7,077 1,649 1,960
3.6 6.7 10,600 10.62 1.16 2,769 1,576 1,369 61 20
181
12
8.2
6,962
1,607
1,893
3.6
3.9
11,867
10.44
1.02
3,231
54
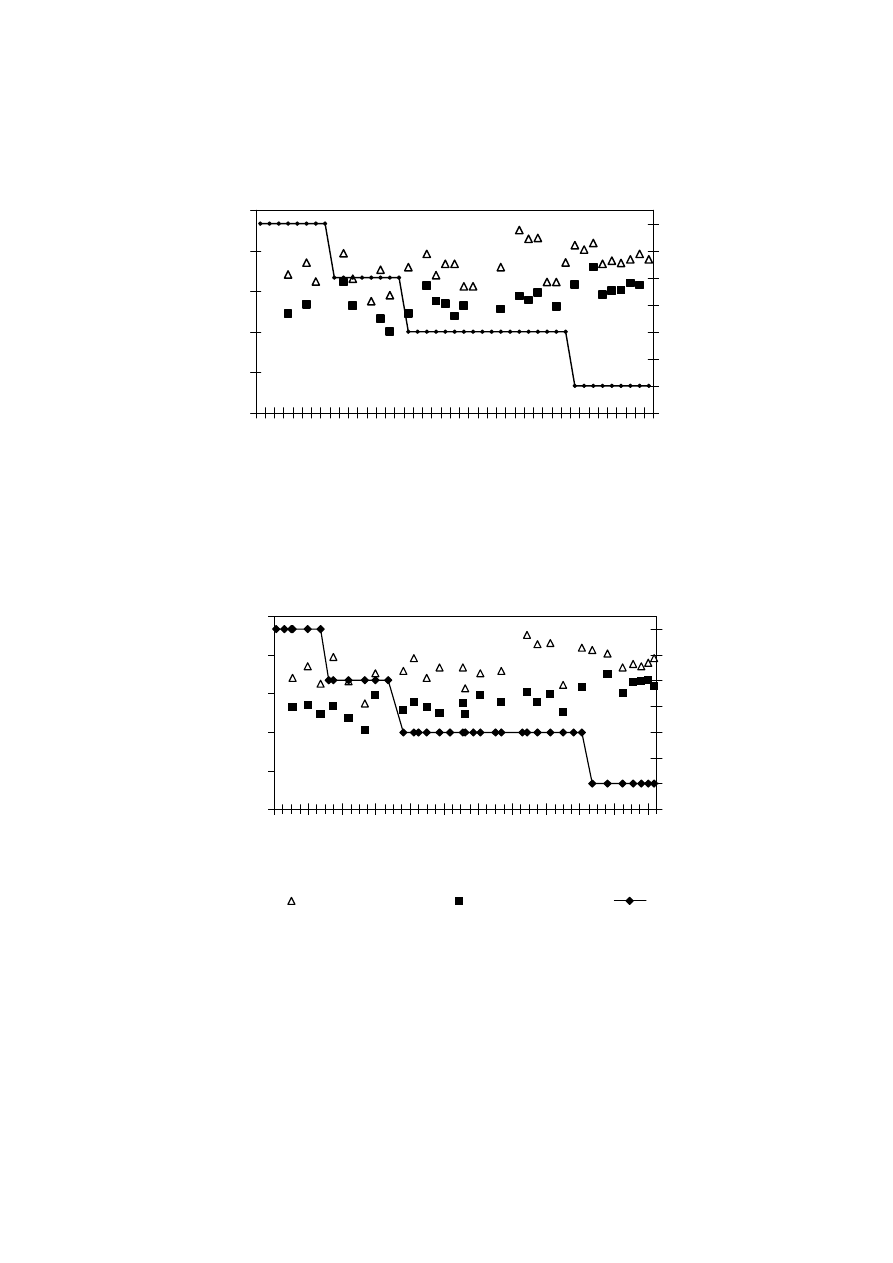
168
Figure E-1 Influent and Effluent TKN Concentration in (a) YMBR and (b) BMBR
0
5 0 0
1 0 0 0
1 5 0 0
2 0 0 0
2 5 0 0
0
1 6
3 2
4 8
6 4
8 0
9 6
1 1 2 1 2 8 1 4 4 1 6 0 1 7 6
T im e (d a ys )
TK
N
(
m
g
/L)
1 0
1 2
1 4
1 6
1 8
2 0
2 2
2 4
HR
T
(
h
)
Influe nt T K N
E fflue nt T K N
H R T
0
500
1000
1500
2000
2500
1
17
35
57
78
104
130
157
176
Time (days)
TKN (m
g/L)
10
12
14
16
18
20
22
24
HRT (h
)
(a)
0
500
1000
1500
2000
2500
0
16 32 48 64 80 96 112 128 144 160 176
Time (days)
T
KN (
m
g
/L
)
10
12
14
16
18
20
22
24
HR
T
(
h
)
Influent TKN
Effluent TKN
HRT
(b)
169
Table E-3 Variation in TMP with Time in BMBR
Day
HRT (h)
TMP (kPa)
Day
HRT (h)
TMP (kPa)
1 24 7.37
120
16
16.84
5 24 9.21
122
16
17.11
10 24 7.89
123
16 31.58
15 24 6.84
124
16 56.58
20 24 6.32
125
16 65.79
25 24 6.84
129
16 11.84
30 20 9.47
132
16 12.37
35 20 8.16
135
16 15.79
40 20 8.42
136
16 19.21
45 20 9.21
137
16 36.84
50 20 10.00
138
16 44.47
55 20 11.32
141
16 56.32
57 20 11.05
142
16 65.79
58 20 14.47
143
16 8.95
60 20 13.42
149
16 15.46
61 16 17.89
150
12 18.93
62 16 18.68
151
12 24.53
65 16 7.63
152
12 26.66
69 16 7.89
153
12 29.86
72 16 11.84
158
12 33.59
77 16 12.11
159
12 38.39
81 16 13.68
160
12 35.19
82 16 17.11
161
12 34.12
85 16 22.11
162
12 34.12
89 16 7.89
163
12 36.25
90 16 10.53
164
12 38.12
91 16 10.92
165
12 37.85
96 16 11.45
166
12 43.19
100 16 11.84
169
12 12.00
103 16 13.16
173
12 13.06
104 16 15.79
177
12 13.06
114 16 15.79
181
12 15.20
170
Table E-4 Variation in TMP with Time in YMBR
Day
HRT (h)
TMP (kPa)
Day
HRT (h)
TMP (kPa)
1 24 9.3 91
16 6.91
5 24 9.3 96
16 6.91
10 24 7.4 100
16 7.58
15 24 9.0 103
16 8.24
21 24 8.0 104
16 8.24
25 24 8.2 107
16 10.63
30 20 8.0 108
16 13.29
35 20 7.4 109
16 18.61
45 20 6.9 110
16 20.20
50 20 7.2 114
16 6.64
55 20 7.7 122
16 5.32
57 20 9.0 129
16 5.32
58 20 8.4 132
16 8.77
60 20 8.8 137
16 9.57
61 16 8.8 143
16 10.90
62 16 8.4 153
12 13.02
69 16 7.0 159
12 17.54
72 16 8.2 160
12 25.25
77 16 6.6 161
12 27.91
81 16 8.0 162
12 28.17
82 16 8.0 163
12 28.57
85 16 8.0 166
12 7.18
88 16 14.6
173
12 10.90
89 16 18.6
178
12 11.43
90 16 20.2
181
12 10.37

171
Appendix F
Ammonia Stripping Studies
172
Table F-1 Ammonia Removal Efficiency in Leachate with Varying pH
Ammonia Stripping (%)
Initial Concentration
(mg/L)
pH 9
pH 10
pH 11
pH 12
1,106 16
24
38
43
1,366 23
32
45
50
1,380 25
30
42
47
Table F-2 Experimental Data of Ammonia Concentration at a pH from 11 to 12 of
Leachate as Functions of Contact Time and Velocity Gradient (Run I: 1,106 mg/L)
Contact Time
2 h
4 h
6 h
Velocity
Gradient
(s
-1
)
NH
3
(mg/L)
Removal
(%)
NH
3
(mg/L)
Removal
(%)
NH
3
(mg/L)
Removal
(%)
0 767 30 602 45 543 51
1,530
378 66 174 84 73 93
2,850
298 73 60 95 25 98
4,330
269 76 56 95 20 98
Table F-3 Experimental Data of Ammonia Concentration at a pH from 11 to 12 of
Leachate as Functions of Contact Time and Velocity Gradient (Run II: 1,366 mg/L)
Contact Time
2 h
4 h
6 h
Velocity
Gradient
(s
-1
)
NH
3
(mg/L)
Removal
(%)
NH
3
(mg/L)
Removal
(%)
NH
3
(mg/L)
Removal
(%)
0 986 28 829 39 689 50
1,530
459 66 190 86 106 92
2,850
353 74 98 93 34 98
4,330
325 76 78 94 28 98
Table F-4 Experimental Data of Ammonia Concentration at a pH from 11 to 12 of
Leachate as Functions of Contact Time and Velocity Gradient (Run III: 1,380 mg/L)
Contact Time
2 h
4 h
6 h
Velocity
Gradient
(s
-1
)
NH
3
(mg/L)
Removal
(%)
NH
3
(mg/L)
Removal
(%)
NH
3
(mg/L)
Removal
(%)
0 994 28 876 37 736 47
1,530
540 61 216 84 160 88
2,850
434 69 165 88 59 96
4,330
406 71 148 89 53 96
173
Table F-5 Pilot Scale Study on Ammonia Stripping with Varying Contact Time (Reactor
Volume 40 L, pH 11-12, Velocity Gradient 2,850 s
-1
)
Contact Time
1 h
2 h
3 h
4 h
5 h
Initial
Concentration
(mg/L)
NH
3
(mg/L)
R
(%)
NH
3
(mg/L)
R
(%)
NH
3
(mg/L)
R
(%)
NH
3
(mg/L)
R
(%)
NH
3
(mg/L)
R
(%)
1,160
722 38 487 58 235 80 202 83 104 91
1,473
902 22 675 42 375 68 266 77 140 88
* R – Ammonia Removal Efficiency
Table F-6 Verification of the Optimum Parameters for the Ammonia Stripping Studies
with Varying Ammonia Concentration in the Leachate (Velocity Gradient: 2,850 s
-1
, pH:
11-12, Contact Time: 5 h)
Ammonia Concentration (mg/L)
Sample No.
Initial Final
Removal Efficiency (%)
1 1,473
140
90
2 1,546
148
91
3 1,310
151
88
4 1,753
218
88
5 1,546
241
84
6 1,414
227
84
7 1,358
202
85
8 1,277
210
84
9 1,369
218
84
10 1,442
238
83
11 1,389
179
87
12 1,490
162
89
13 1,532
218
86
14 1,473
140
90
15 1,546
148
91
Average 1,455
196
86

174
Appendix G
MBR with Ammonia Stripping
175
Table G-1 Feed, Reactor and Effluent Characteristics in BMBR at 16 h HRT
Feed Reactor Effluent
Removal
(%)
Day
COD
(mg/L)
TKN
Raw
(mg/L)
TKN
Stripp
(mg/L)
MLSS
(mg/L)
COD Loading
(kg/m
3
.d)
F/M Ratio
COD
(mg/L)
TKN
(mg/L)
NH
3
-N
(mg/L)
COD TKN
1
7,538
1,686 11,567 11.31 1.09
2,769
7
6,987
1,473 11,567 10.48 1.08
2,430
403 252 65
73
14
8,467
1,739 11,000 12.70 1.52
2,780
454 367 67
74
16
8,930
1,957 11,567 13.40 1.21
2,791
456 342 69
77
19
8,964
1,828 11,000 13.45 1.21
2,747
462 347 69
75
23 7,459 1,764
445
11,000
11.19
1.02 2,634 473
347
65
73
27 7,167 1,614
445
12,667
10.75
0.85 1,933 353
227
73
78
33 7,459 1,764
451
10,750
11.19
1.04 2,270 347
227
70
80
39 7,277 1,557
213
10,500
10.92
1.04 2,143
71
48 8,269 1,473
157
11,100
12.40
1.12 2,742
67
57 8,195 1,414
204
11,850
12.29
0.82 2,500 255
168
69
82
62 7,277 1,322
179
11,700
10.92
0.93 1,677 241
210
77
82
67 6,857
12,450
10.29
0.62 1,739
75
69 9,231 1,982
344
12,050
13.85
1.15 2,571 322
210
72
84
71 9,231
11,850
13.85
1.17 2,031
78
77 8,432 1,834
350
11,100
12.65
1.14 1,500 188
140
82
90
84 7,000 1,912
395
10,450
10.50
1.00 1,667 272
210
76
86
92 7,000 1,789
372
11,600
10.50
0.91 2,000 238
168
71
87
99 6,733 1,582
333
12,050
10.10
0.50 1,833 224
140
73
86
108 7,167 1,646
358
10,300
10.75
0.51
1,933
232
168
73
86
114 7,784 1,593
330
11,700
11.68
1.19
2,060
280
210
74
82
120 7,162 1,764
325
10,550
10.74
1.09
1,709
168
137
76
90
126 7,084
11,700
10.63
1.12
2,234
68
133 7,167
11,750
10.75
0.90
1,870
74
140 6,857 1,795
288
11,750
10.29
0.70
2,026
244
157
70
86
147 7,040 1,879
249
10,600
10.56
0.79
2,080
216
151
70
89
153 7,610
10,750
11.42
0.84
1,538
80
159 7,667 1,876
311
11,800
11.50
0.77
2,026
187
145
74
90
170 7,720
10,750
11.58
0.64
1,538
80

176
Table G-2 Feed, Reactor and Effluent Characteristics in BMBR at 24 h HRT
Feed Reactor Effluent
Removal
(%)
Day
COD
(mg/L)
TKN
Raw
(mg/L)
TKN
Stripp
(mg/L)
MLSS
(mg/L)
COD Loading
(kg/m
3
.d)
F/M
Ratio
COD
(mg/L)
TKN
(mg/L)
NH
3
-N
(mg/L)
COD TKN
1 7,655 1,646
358
11,300
7.66
0.68 1,862 232
168
76
86
5
7,500
12,550
7.50
0.60
13 8,262 1,574
342
12,050
8.26
0.69 1,655 151
126
80
90
14
7,655
10,133
7.66
0.76
1,742
77
17 8,129 1,582
333
11,850
8.13
0.69 2,032 224
140
75
86
24
8,262
12,750
8.26
0.65
30
7,655
2,041
361
11,600
7.66
0.66
162
109
92
35
8,129
13,467
8.13
0.60
42 9,322 1,876
311
12,750
9.32
0.73 2,531 216
157
73
88
46
7,500
12,033
7.50
0.62
49
9,223
11,300
9.22
0.82
2,344
75
52
9,223
11,233
9.22
0.82
2,430
74
58
8,852
13,467
8.85
0.66
2,164
76

177
Table G-3 Feed, Reactor and Effluent Characteristics in YMBR at 16 h HRT
Feed Reactor Effluent
Removal
(%)
Day
COD
(mg/L)
TKN
Raw
(mg/L)
TKN
Stripp
(mg/L)
MLSS
(mg/L)
COD Loading
(kg/m
3
.d)
F/M Ratio
COD
(mg/L)
TKN
(mg/L)
NH
3
-N
(mg/L)
COD TKN
1
7,538
1,686
10,833
11.31
2.08
2,769
7
6,987
1,473
10,933
10.48
2.01
2,127
70
14
1,739
12,567
14.05
0.93
2,780
521
395
70
70
16 8,930 1,957
10,933
13.40
1.05 2,791 448
316
69
77
19 8,964 1,828
11,250
13.45
1.19 2,747 459
333
69
75
23 7,459 1,764
445
12,267
11.19
1.06 2,195 353
238
71
80
27 7,167 1,614
445
10,850
10.75
0.96 1,864 322
210
74
80
33 7,459 1,764
451
11,600
11.19
0.96 2,571 339
221
66
81
39
7,459
1,557
213
10,750
11.19
1.24
2,261
70
48 8,269 1,473
157
12,100
12.40
1.02 2,714 126
115
67
91
57 8,195 1,414
204
12,400
12.29
0.66 2,667 233
199
67
84
62 7,277 1,322
179
10,900
10.92
1.06 1,223 193
185
83
85
67
6,514
11,250
9.77
0.92
1,739
73
69 9,231 1,982
344
11,700
13.85
1.25 2,571 274
184
72
86
71
9,231
12,100
13.85
1.10
1,846
80
77 8,432 1,834
350
10,900
12.65
1.27 2,250 241
146
73
87
84 7,000 1,912
395
11,050
10.50
0.91 1,743 224
185
75
88
92 7,000 1,789
372
11,750
10.50
0.95 2,167 216
199
69
88
99 6,733 1,582
333
11,600
10.10
0.75 2,000 277
146
70
82
108 7,167 1,646
358
12,200
10.75
0.99
2,100
210
199
71
87
114 7,784 1,593
330
11,950
11.68
1.23
2,166
232
185
72
85
120 7,162 1,764
325
11,400
10.74
1.09
1,565
221
143
78
87
126
7,084
11,750
10.63
0.69
1,940
73
133
7,167
11,950
10.75
0.90
1,558
78
140 6,857 1,795
288
11,950
10.29
0.63
2,026
252
162
70
86
147 7,040 1,879
249
11,550
10.56
0.73
1,920
232
148
73
88
153
7,610
11,600
11.42
0.98
1,846
76
159 7,667 1,876
311
11,750
11.50
1.04
2,054
220
150
73
88
170
7,720
11,600
11.58
0.66
1,846
76
178
Table G-4 Feed, Reactor and Effluent Characteristics in YMBR at 24 h HRT
Feed Reactor Effluent
Removal
(%)
Day
COD
(mg/L)
TKN
Raw
(mg/L)
TKN
Stripp
(mg/L)
MLSS
(mg/L)
COD Loading
(kg/m
3
.d)
F/M
Ratio
COD
(mg/L)
TKN
(mg/L)
NH
3
-N
(mg/L)
COD TKN
1 7,655 1,646
358
11,550
7.66
0.66 1,742 232
148
77
86
5
7,500
11,400
7.50
0.66
13 8,262 1,574
342
12,200
8.26
0.68 1,655 137
109
80
91
14
7,655
12,933
7.66
0.59
1,655
78
17 8,129 1,582
333
11,750
8.13
0.69 1,935 216
146
76
86
24
7,655
12,650
7.66
0.61
30 7,655 2,041
361
11,550
7.66
0.66
157
115
92
35
8,129
12,200
8.13
0.67
42 9,322 1,876
311
12,333
9.32
0.76 2,719 221
143
71
88
46
7,500
11,133
7.50
0.67
2,164
71
49
9,223
11,550
9.22
0.80
52
9,223
12,333
9.22
0.75
2,430
74
58
8,852
12,200
8.85
0.73
2,066
77

179
Appendix H
Other Studies

180
Table H-1 20 Days BOD of Raw Leachate, Stripped Leachate, Bacterial and Yeast
Effluents
BOD (mg/L)
Day
Raw
Leachate
Stripped Leachate
YMBR
Effluent
BMBR
Effluent
1 2,080
240 10
5
2 2,640
440 15
10
3 3,040
640 15
10
4 3,280
1,000
20
15
5 3,520
1,120
20
15
6 3,760
1,200
20
20
7 4,080
1,280
25
20
8 4,240
1,480
30
25
9 4,480
1,920
35
25
10 4,560
2,040 35
25
11 4,720
2,200 40
25
12 4,800
2,280 45
25
13 4,800
2,400 50
25
14 4,960
2,440 60
30
15 4,960
2,400 65
30
16 5,040
2,400 70
35
17 5,120
2,400 75
35
18 5,120
2,400 75
35
19 5,200
2,400 80
35
20 5,280
2,400 80
40
COD (mg/L)
7,742
6,581
1,839
1,742
BOD
5
(mg/L)
3,520
1,120
20
15
BOD
5
/COD 0.45
0.17
0.01 0.01
BOD
10
/COD 0.59
0.31
0.02 0.01
BOD
15
/COD 0.64
0.36
0.04 0.02
BOD
20
/COD 0.68
0.36
0.04 0.02
181
Table H-2 Membrane Resistance of the Membrane Used for MWCO Studies
MW 50k
MW 10k
MW 5k
Pressure
(kPa)
Flowrate
(L/h)
Permeate
Flux
(L/m
2
.h)
Flowrate
(L/h)
Permeate
Flux
(L/m
2
.h)
Flowrate
(L/h)
Permeate
Flux
(L/m
2
.h)
101 0.53 117.78 0.31 68.02 -
-
202 0.79 174.68
0.65
143.18
0.18 40.76
303 1.13 249.78
0.99
217.29
0.26 57.70
404 1.32 290.47
1.31
288.22
0.36 79.93
505 1.52 335.47
1.42
313.90
0.45 99.25
Membrane
Resistance
8.16 x 10
12
m
-1
6.99 x 10
12
m
-1
1.86 x 10
13
m
-1
Figure H-1 Determination of Initial Membrane Resistance of Flat Sheet Membrane
(A = 45.34 cm
2
)
0
200
400
600
0
200
400
Permeate Flux (L/m
2
.h)
P
re
ssu
re
(k
P
a)
MW 10k
0
200
400
600
0
100
200
300
400
Permeate Flux (L/m
2
.h)
P
re
ssu
re
(k
P
a)
MW 50k
0
100
200
300
400
500
600
0
50
100
150
Permeate Flux (L/m
2
.h)
Pres
sure (k
Pa)
MW 5k

182
Table H-3 COD Fraction of Raw Leachate, Stripped Leachate and Yeast and Bacterial
Membrane Bioreactor Effluents at Different Molecular Weight
Raw Leachate
Stripped Leachate
Yeast Effluent
Bacterial
Effluent
Molecular
Weight
COD
(mg/L)
COD
(%)
COD
(mg/L)
COD
(%)
COD
(mg/L)
COD
(%)
COD
(mg/L)
COD
(%)
MW>50k 6,445
87
3,643 65 54 3 127 7
MW
10k-50k 401 5 359 6 286 14 230 12
MW
5k-10k 590 8 606 11 529 26 588 31
MW<5k
nd nd 970 17 1,093 54 998 53
Table H-4 COD and BOD Fraction of Raw Leachate, Stripped Leachate and Yeast and
Bacterial Membrane Bioreactor Effluents at Different Molecular Weight
Raw Leachate
Stripped Leachate
Yeast Effluent
Bacterial
Effluent
Molecular
Weight
COD
(mg/L)
COD
(%)
COD
(mg/L)
COD
(%)
COD
(mg/L)
COD
(%)
COD
(mg/L)
COD
(%)
MW>50k 6,916 91 4,732 72 123 7 48 3
MW
10k-50k
215 3 178 3 175 9 178 9
MW
5k-10k
492 6 456 7 353
19
355
19
MW<5k
nd nd 1,196 18 1,233 65 1,286 69
Raw Leachate
Stripped Leachate
Yeast Effluent
Bacterial
Effluent
Molecular
Weight
BOD
(mg/L)
BOD
(%)
BOD
(mg/L)
BOD
(%)
BOD
(mg/L)
BOD
(%)
BOD
(mg/L)
BOD
(%)
MW>50k 3,032
88 1,149 72 12 10 6 4
MW
10k-50k
91 3 57 4 6 6 38
23
MW 5k-10k
328
10
115
7
11
10
13
8
MW<5k
nd nd 274 17 86 74 108 65
Table H-5 Chemical Cost for the Yeast and Bacterial Membrane Bioreactor without
Ammonia Stripping
Sample
pH
H
2
SO
4
(L/m
3
)
NaOH*
(kg/m
3
)
Chemical Cost
(Baht/m
3
)
Raw Leachate
7.8
-
-
-
YMBR Effluent
3.6
5.6 (pH 3.6)
0.5 (pH 7.0)
93
BMBR Effluent
7.5
0.3 (pH 7.5)
-
5
Note * Increase in pH of YMBR effluent

183
Table H-6 Chemical Cost for the Yeast and Bacterial Membrane Bioreactor with Ammonia
Stripping
Sample
pH
NaOH
(kg/m
3
)
H
2
SO
4
(L/m
3
)
NaOH*
(kg/m
3
)
Chemical
Cost
(Baht/m
3
)
Raw Leachate
7.8
-
-
-
-
Stripped Leachate
11.5 15.25 (pH 11.5)
-
-
458
YMBR Effluent
3.6
-
13.5 (pH 3.6)
0.5 (pH 7.0)
204
BMBR Effluent
7.5
-
7.7 (pH 7.5)
-
107
Note * Increase in pH of YMBR effluent
Wyszukiwarka
Podobne podstrony:
Arkusz Olimpiada 2004 pdf
Raport losy absolwentów WSIiZ 2004 2005, PDF-y darmowe, Elastyczne formy zatrudnienia i organizacji
Arkusz Olimpiada 2004 pdf
Dz U 2004 121 1263 Ustawa o SZWO pdf
ref 2004 04 26 object pascal
instr 2011 pdf, Roztw Spektrofoto
(ebook PDF)Shannon A Mathematical Theory Of Communication RXK2WIS2ZEJTDZ75G7VI3OC6ZO2P57GO3E27QNQ
antropomotoryka 26 2004 id 6611 Nieznany (2)
KSIĄŻKA OBIEKTU pdf
2004 07 Szkoła konstruktorów klasa II
zsf w3 pdf
CAD CAM KWPPWPS Zad graf PDF
brzuch i miednica 2003 2004 23 01
2004 06 21
więcej podobnych podstron