
Fluid, Electrolyte Balance

Fluid, Electrolyte & Acid-Base
Disorders
1. Review of key concepts:
-- Fluid homeostasis– more than blood
flow & plasma volume
-- Fluid Compartments & composition
-- Hormones and Fluid Balance
2. Interstitial Tissue, Starling Forces,
& Edema Formation
3. Fluid and Electrolyte Disorders
4. Control of pH & Acid – Base
Disorders
-- regulatory systems: Buffers, Lungs,
Kidneys
-- clinical laboratory applications

Total Body Water & Fluid
Compartments
• Fluid compartments average adult (70kg
m)
– TBW 60% of body wt. (42L)*
– ECF 20% (plasma 5% + interstitial 15% =14L)
– ICF 40% (28L)
– (transcellular spaces- CSF, synovial etc 1-2%)
• GI Tract Fluid Loss
– GI secretes 6-8L per day & reabsorbs all but
about 100ml lost with stool. Severe diarrhea
can lose large amounts

Distribution of Major Cations and
Anions
ECF*
ICF
Na+ (mEq/L)
135-145
10
K+ (mEq/L
3.5-5.0
150
Ca++ (mEq/L) 5
(.0001)**
Cl- (mEq/l)
100-107 5
HCO3- (mEq/L)
22-28
12
Phosphate (mEq/L) 2
40-95
Proteins 16
54
pH 7.4 7.1
*Ionic composition of ISF & plasma is the same as ECF,
exception plasma has more protein; ICF calcium primarily
bound-not free

Osmolality & Tonicity
• Osmolarity = osmoles/L H2O (particles
per unit volume or liter of water)
• Osmolality = osmoles/Kg H2O (particles
per unit wt of water)
• Tonicity = osmotic pressure of solutes
(effective osmoles) that cause water
movement (NaCl, glucose, KCL,) across
cell membrane. Water moves out of the
red cell (shrinks) in a hypertonic
solution.
– Although Na is the primary effective solute,
other solutes can contribute to tonicity.
Hyponatremia can occur in high, normal &
low tonicity, ie. Hypertonic hyponatremia.

Plasma Osmolality
• Normal plasma osmolality = 280-
295 mOsm/kg H2O
• 2 estimates of plasma osmolality
– plasma osm = 2x (plasma [Na+])
– plasma osm =
2(Na+) + (glucose/18) + (urea/2.8)*
*Glucose & urea in mg/dl can converted to mmol/L or mOsm/kg – gives
better estimate than using just sodium if pts with hyperglycemia or
elevated BUN (see Berne & Levy 5
th
ed)
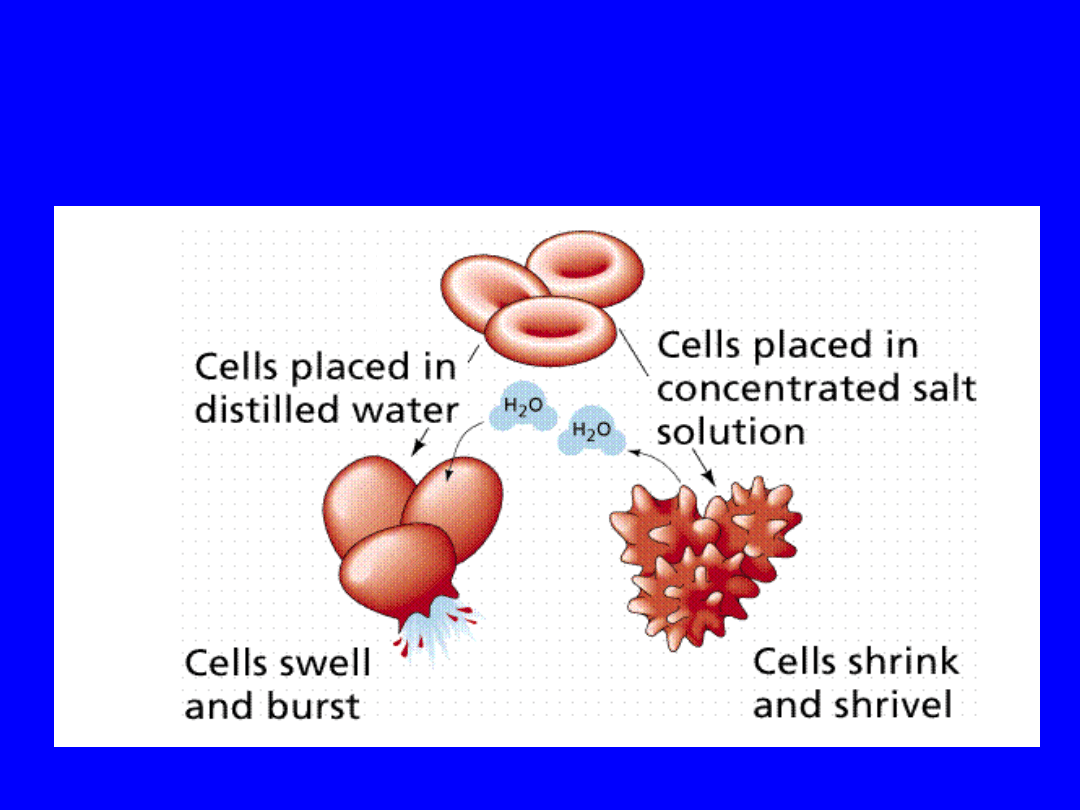
Osmosis & Difference between
“effective” osmolality of cell and
surrounding fluid
Osmolality
=330
Osmolality
=275
285
285
(Hypertonic)
(Hypotoni
c)

Hormone Control of Volume &
Sodium
• Two primary controls of ECF
volume (water balance):
1.
Regulation of serum sodium
concentration–
Antidiuretic Hormone (ADH)
Thirst
2.
Regulation of total body sodium –
Renin-Angiotensin-Aldosterone system
(RAA)
Natriuretic Peptides (ANP & BNP)

-Hormone Control of Volume &
Sodium
• Hypothalamus & Posterior Pituitary
– Osmoreceptors in hypothalamus respond to
decrease in vascular volume & increased
osmolarity >295 mOsmols stimulate
• thirst (diminished in age)
• ADH release from PP – regulates water excretion via
change in permeability of distal tubule
• Syndrome of Inappropriate ADH (SIADH)
– High levels of ADH result in hyponatremia. Causes:
infection, neoplasms of the CNS, pulmonary
disease, operative stress.
• Diabetes Insipidus (Low ADH-dilute urine):
– Central : CNS infections, trauma, tumor
– Nephrogenic: unresponsive to ADH (drugs,
congenital)
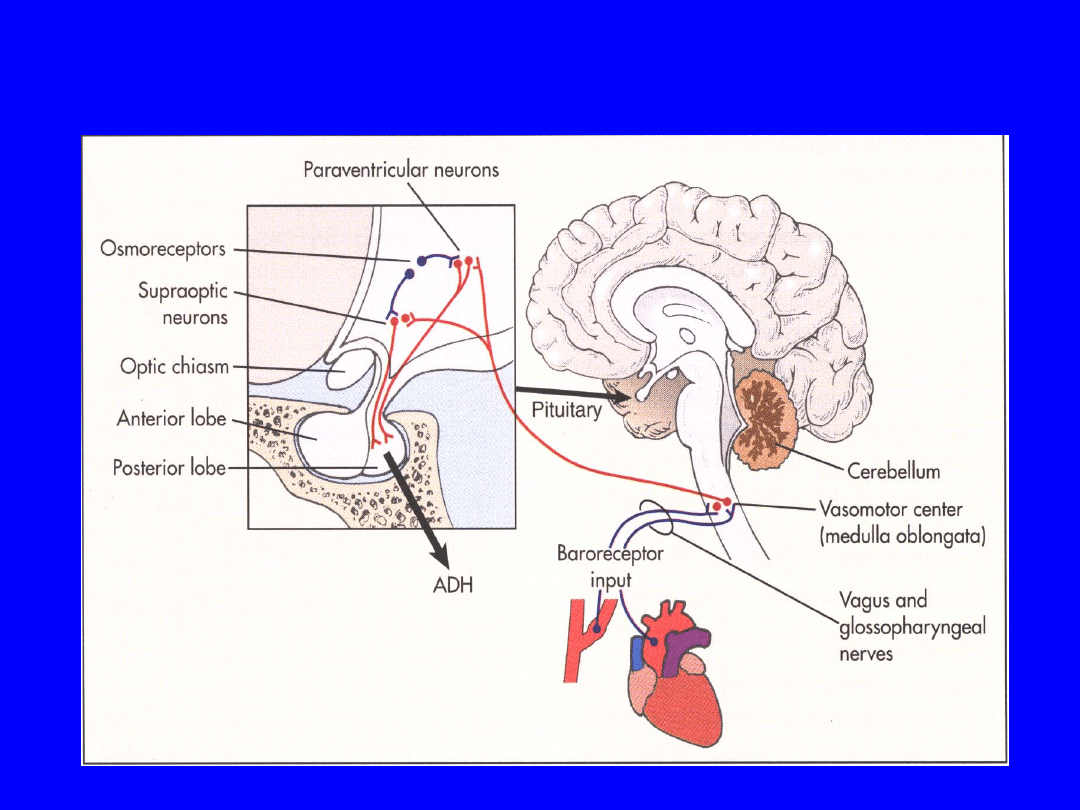
Regulators of ADH
• Regulators of ADH
– Two major: interact
• Plasma osmolality (react to changes as small as 1%)
osmoreceptors (shrink or swell based on plasma osmol)
located in the hypothalamus.
• Volume and pressure (5-10% change in pressure is required)
of the vascular system-activated by receptors in
– Left atrium and pulmonary artery: vascular volume
– Aortic arch and carotid sinus: wall tension (arterial pressure)
– Both send signal via vagus and glossopharyngeal.
– Nausea-stimulates
– Atrial natriuretic peptide (ANP) inhibits
– Angiotensin II stimulates
– Drugs (nicotine-stimulates secretion, alcohol-
inhibits)
Berne & Levy, 2000, p 437 &
438
ADH

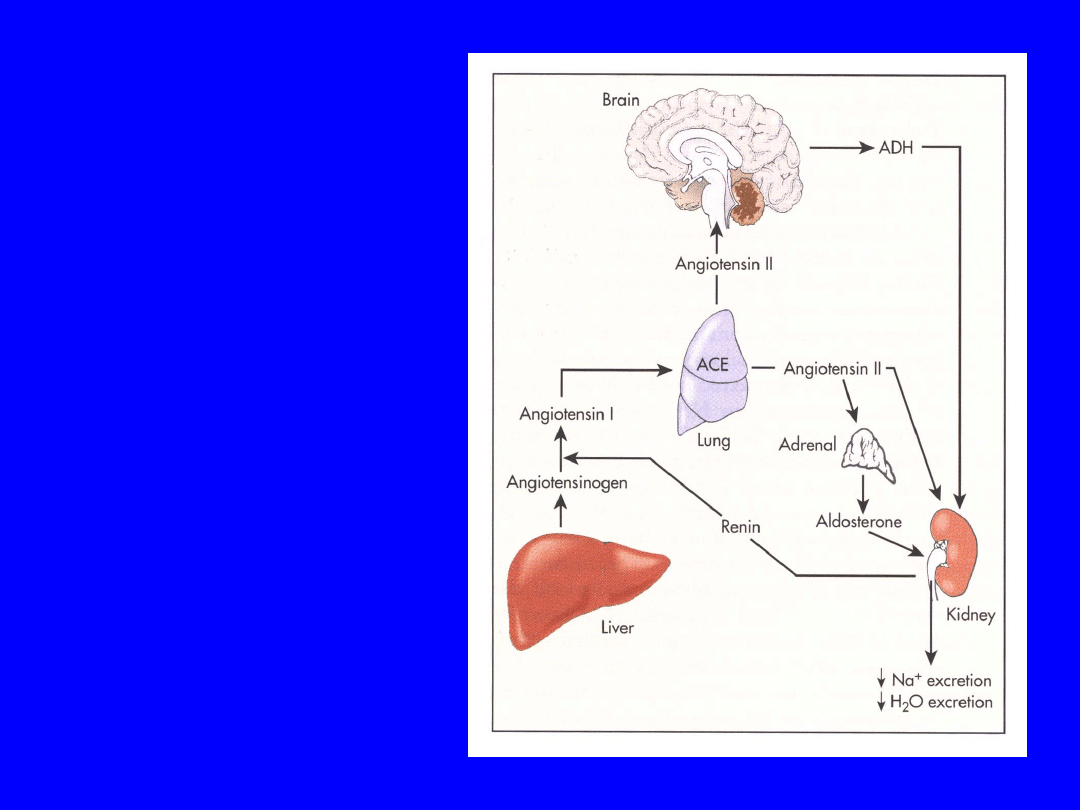
-Hormone Control of Volume &
Sodium
• Renin-Angiotensin --> Aldosterone (RAA)
– Controls ECF by regulating Na excretion
– Acts on distal tubules retains Na (& water)
excretes K
– Angiotensin also direct effect of Na reabsorption
in proximal tubules & enhances ADH effect
• Atrial Natriuretic Peptide (ANP) & “Brain”
Natriuretic Peptide (BNP)*
– Secreted by atrial myocytes (BNP ventricular
myocytes-marker of HF) in response to increase
venous/atrial pressure or increase blood volume
– Increase GFR, inhibits Na (water) reabsorption
in collecting ducts
– Inhibits ADH & renin release
*Baughman KL NEJM 2002 347:158-9; Levin ER et al NEJM ’98
339:321-8
Aldosterone
• Stimulates Na+
reabsorption in
the distal
tubule and
collecting duct
• Enhances Na+
reabsorption by
cells of the
thick ascending
limb of the loop
of Henle
Response to volume
depletion
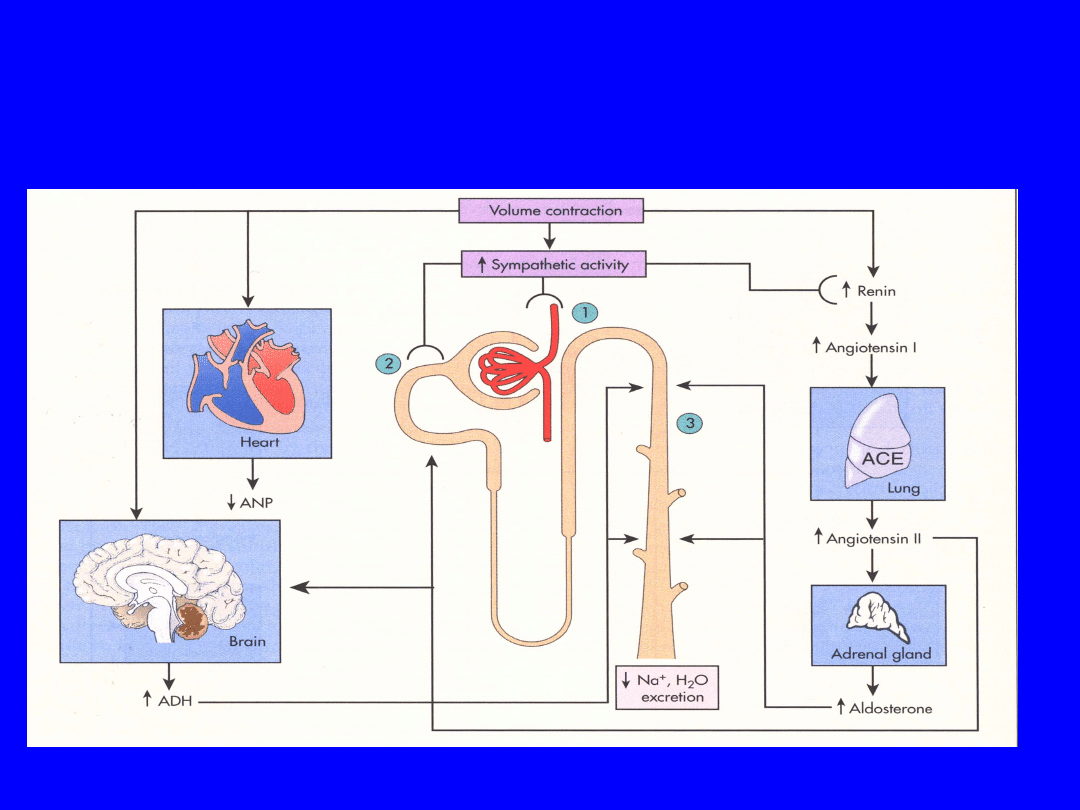
ADH and Aldosterone and ANP
Response to ECF contraction
Berne & Levy, 2000 p
451
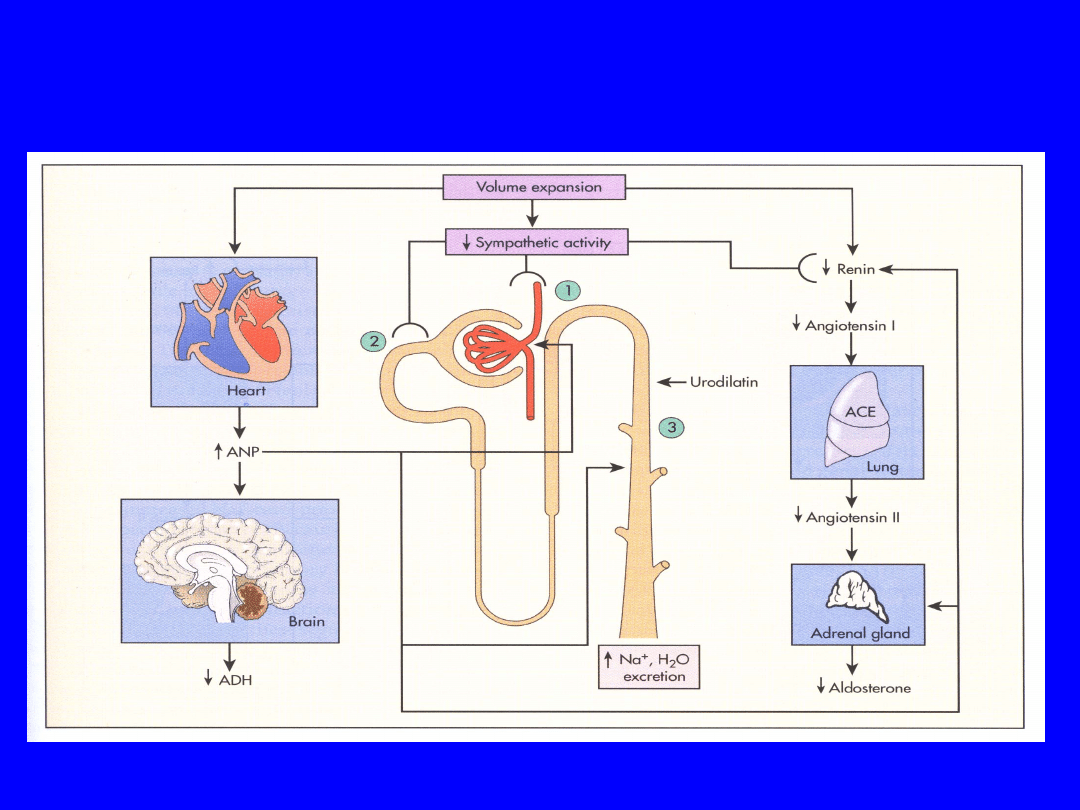
ADH and Aldosterone and ANP
Response to ECF Expansion
Berne & Levy, 2000 p
452

Control of Urine Solute
Concentration:
Age & Disease
• Normal
– Body must excrete a minimum of 1200 mOsm
– Healthy kidney can vary concentration from 40-
1400 mOsm/L
– Minimum urine volume at maximum [C] ability
=
1200/1400 kgH2O/24 hr = 857ml/24hr
(35ml/hr)
• Development, Aging & Disease
– Infant: max concentrating ability ~
600mOsmols/kg due to low ADH and immature
renal concentrating
– Elderly: renal function diminishes with age, >70
yrs ~ 900mOsmols/kg H2O
– Minimum urine volume at maximum [C]
1200/900 kgH2O/24 hr = 1300/24hr
(55ml/hr)

Capillary- Interstitial
Exchange & Edema

Normal Interstitial Tissue
• Interstitial Tissue
– Provides the “microenvironment” of the cells
– Composed of cells, water & electrolytes, ground
substances, and fibrillary elements
– Electrolytes & pH maintained in equilibrium
both with capillary-plasma & intracellular fluid
• Fibrillary elements (collagen, elastin)
produce by connective tissue cells, mainly
fibroblasts & ground substance
(glycoproteins, fibronectin). (Implications in
aging)
• Lymphatics
• Fluid Exchange Forces: Capillary & Tissue
hydrostatic & oncotic pressure- major
difference between ISF & plasma – ISF very
low in protein!*
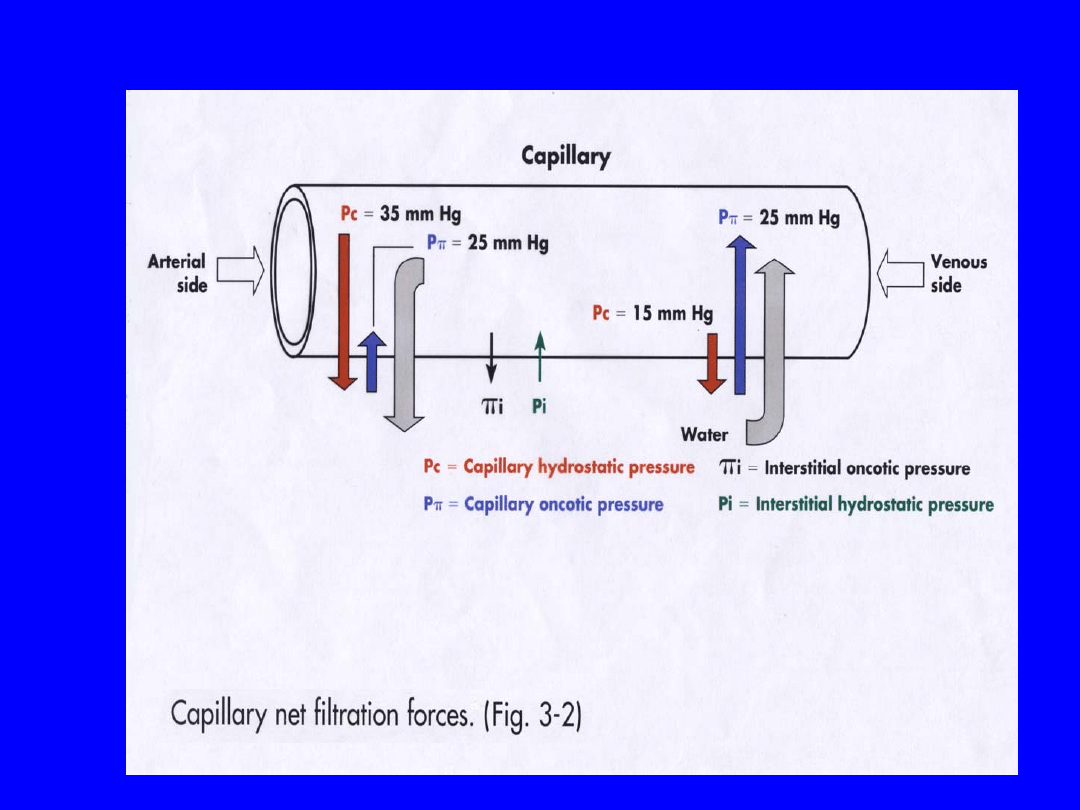
Starling Forces acting on capillary.
(McCance)

Edema Formation
• Excess fluid within interstitial space
• Generalized: 2 or more liters excess in
the interstitial space for edema to be
clinically evident; thus patient can gain
several kgs of H2O in weight before
edema observable or palpable (pitting).
– Cardiac, renal, hepatic failure.
– Nutritional (low albumin)
• Localized: increased capillary
permeability or Hp
– inflammation, hypersensitivity, lymph/venous
obst, lymph node resection, filariasis
– Cirrhosis with accumulation in peritoneal
space (ascites)

Mechanisms of Edema
Formation
• Increased Hydrostatic P
– increased venous pressure or impaired
venous return (heart failure -HF)
• Reduced Plasma Oncotic P*
– hypoproteinemia (nephrotic syndrome-
loss, malnutrition & cirrhosis-impaired
synthesis)
• Lymphatic obstruction
– Obstruction (neoplastic, surgical)
• Sodium retention (renal, HF,
aldosteronism)
• Inflammatory (typically local)
*Role of reduced oncotic P? as edema does not always correlate with
hypoalbuminemia

Key Electrolytes
Imbalances*
• Sodium [135-145mEq/L]
– Hypernatremia >147
– Hyponatremia < 135
• Potassium [3.5-4.5]
– Hyperkalemia >5.5
– Hypokalemia < 3.5
• Calcium [8.6-10.5 mg/dl]
– Hypercalcemia >12
– Hypocalcemia <8.5
*Huether 110-116, McCance
89-102

Regulators of ADH
• Regulators of ADH
–
Two major: interact
• Plasma osmolality (react to changes as small as 1%)
osmoreceptors (shrink or swell based on plasma osmol)
located in the hypothalamus.
• Volume and pressure (5-10% change in pressure is
required) of the vascular system-activated by receptors in
– Left atrium and pulmonary artery: vascular volume
– Aortic arch and carotid sinus: wall tension (arterial pressure)
– Both send signal via vagus and glossopharyngeal.
–
Nausea-stimulates
–
Atrial natriuretic peptide (ANP) inhibits
–
Angiotensin II stimulates
–
Drugs (nicotine-stimulates secretion, alcohol-
inhibits)
Berne & Levy, 2000, p 437 &
438
Document Outline
- Slide 1
- Slide 2
- Slide 3
- Slide 4
- Slide 5
- Slide 6
- Slide 7
- Slide 8
- Slide 9
- Slide 10
- Slide 11
- Slide 12
- Slide 13
- Slide 14
- Slide 15
- Slide 16
- Slide 17
- Slide 18
- Slide 19
- Slide 20
- Slide 21
- Slide 22
Wyszukiwarka
Podobne podstrony:
Wykład 16 1
Negocjacje i sztuka porozumiewania się, NEGOCJACJE I SZTUKA POROZUMIEWANIA SIĘ WYKŁAD 4( 16 06 2013)
Analiza Wykład 6 (16 11 10) ogarnijtemat com
Wykład 16 (19.12.07), toxycologia
OiS Wykład 3 (16 10 2014)
PROSZKI wykład 16, tpl(1)
13 Fluid, Electrolyte?lance PL
Wyklad IV fluid, IŚ Tokarzewski 27.06.2016, VI semestr COWiG, Źródła ciepła, Wykłady, zródła wykłady
Gospodarka a środowisko - Wykłady (16), Gospodarka a środowisko
8 bankowosc wyklad 8 16 12 2014
wykład 16 - 173455, Postanowienie
Wykład 3 16 X 2007, Politologia
2013 2014 ZARZADZANIE ZASOBAMI LUDZKIMI wyklad 2 16 10
więcej podobnych podstron