
Infrared Spectroscopy
Infrared Spectroscopy

2
2
Introduction
Introduction
Spectroscopy is an analytical
Spectroscopy is an analytical
technique which helps determine
technique which helps determine
structure
structure
It destroys little or no sample
It destroys little or no sample
The amount of light absorbed by the
The amount of light absorbed by the
sample is measured as wavelength is
sample is measured as wavelength is
varied
varied

3
3
Types of Spectroscopy
Types of Spectroscopy
Infrared (IR) spectroscopy
Infrared (IR) spectroscopy
–
measures the bond vibration frequencies in a molecule
measures the bond vibration frequencies in a molecule
and is used to determine the functional group
and is used to determine the functional group
Mass spectrometry (MS)
Mass spectrometry (MS)
–
fragments the molecule and measures the masses
fragments the molecule and measures the masses
Nuclear magnetic resonance (NMR) spectroscopy
Nuclear magnetic resonance (NMR) spectroscopy
–
detects signals from hydrogen atoms and can be used to
detects signals from hydrogen atoms and can be used to
distinguish isomers
distinguish isomers
Ultraviolet (UV) spectroscopy
Ultraviolet (UV) spectroscopy
–
uses electron transitions to determine bonding patterns
uses electron transitions to determine bonding patterns
4
4
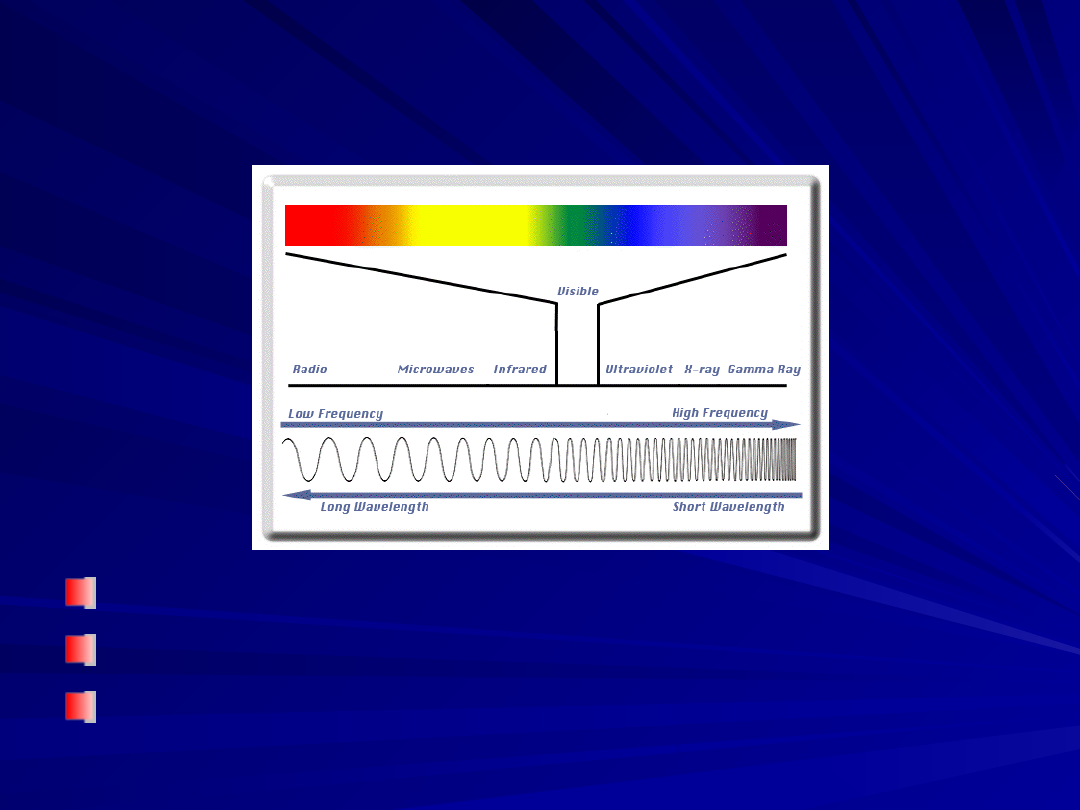
Electromagnetic Spectrum
Electromagnetic Spectrum
Frequency and wavelength are inversely proportional
Frequency and wavelength are inversely proportional
c
c
=
=
, where
, where
c
c
is the speed of light
is the speed of light
Energy per photon =
Energy per photon =
h
h
, where
, where
h
h
is Planck’s constant
is Planck’s constant
5
5
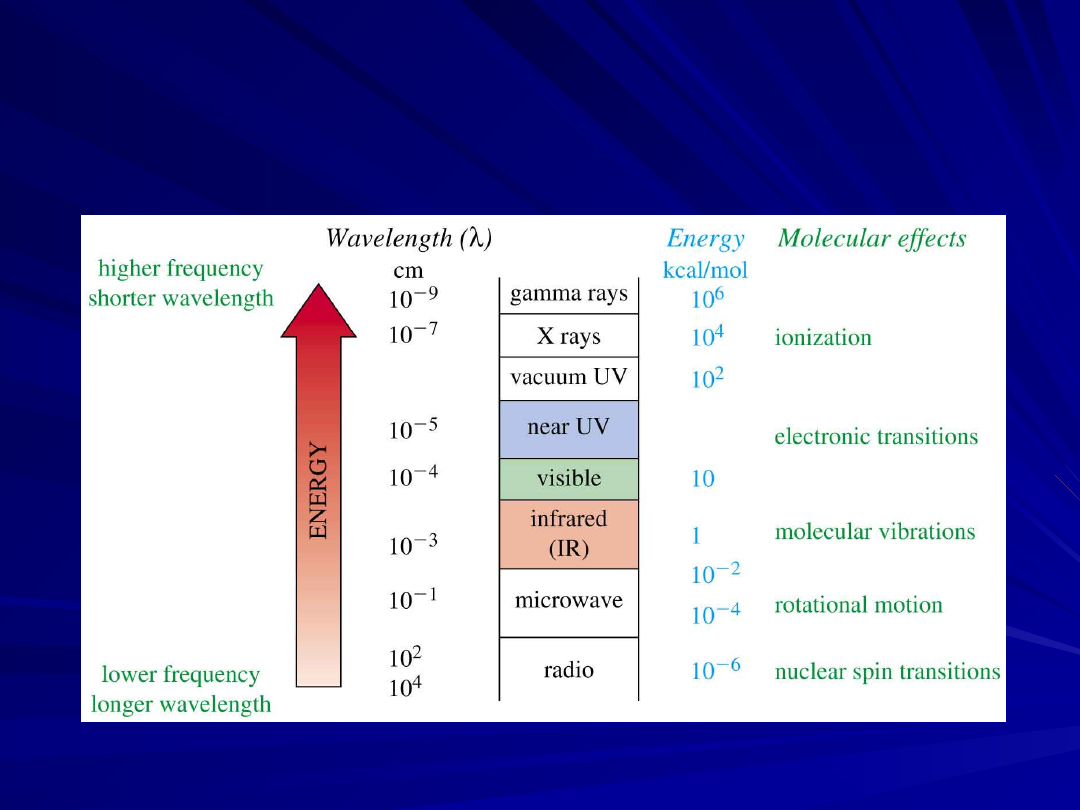
The Spectrum and Molecular
The Spectrum and Molecular
Effects
Effects
=
>

6
6
The IR Region
The IR Region
Just below red in the visible region
Just below red in the visible region
Wavelengths usually 2.5-25
Wavelengths usually 2.5-25
m
m
More common units are wavenumbers,
More common units are wavenumbers,
or cm
or cm
-1
-1
, the reciprocal of the wavelength
, the reciprocal of the wavelength
in centimeters (4000-400 cm
in centimeters (4000-400 cm
-1
-1
)
)
Wavenumbers are proportional to
Wavenumbers are proportional to
frequency and energy
frequency and energy
7
7
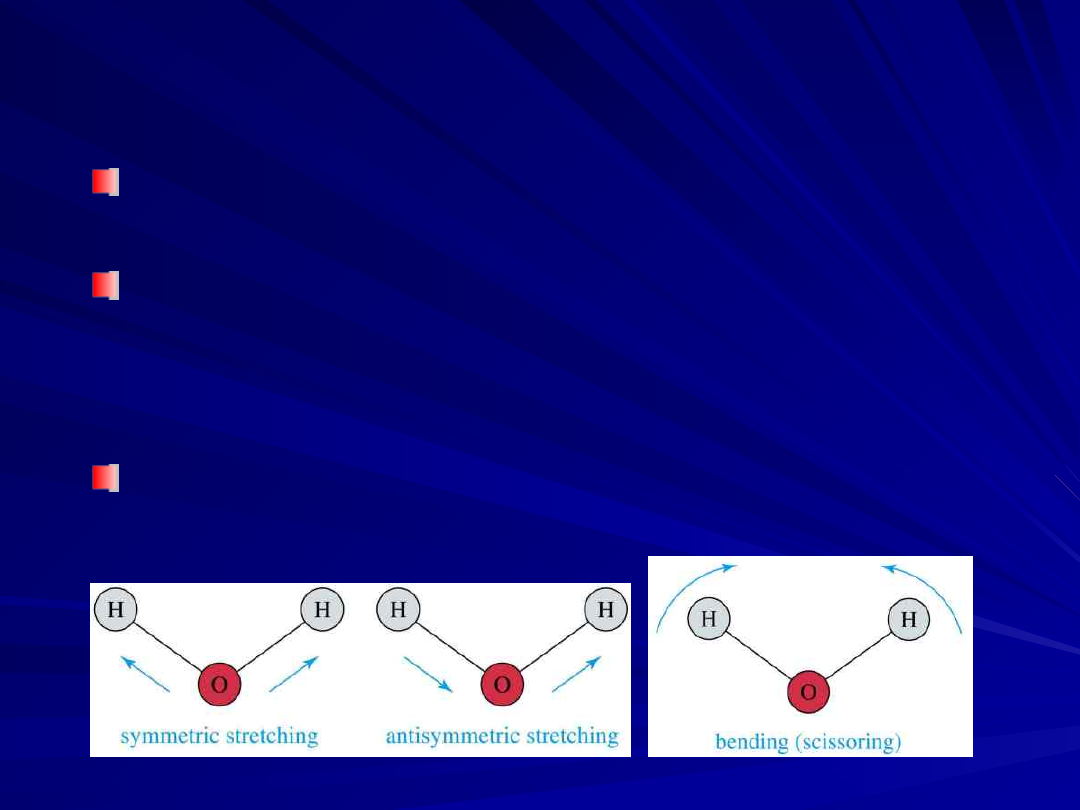
Molecular Vibrations
Molecular Vibrations
Light is absorbed when radiation frequency
Light is absorbed when radiation frequency
= frequency of vibration in molecule
= frequency of vibration in molecule
Covalent bonds vibrate at only certain
Covalent bonds vibrate at only certain
allowable frequencies
allowable frequencies
–
Associated with types of bonds and movement
Associated with types of bonds and movement
of atoms
of atoms
Vibrations include stretching and bending
Vibrations include stretching and bending
8
8
IR Spectrum
IR Spectrum
No two molecules will give exactly the same IR
No two molecules will give exactly the same IR
spectrum (except enantiomers)
spectrum (except enantiomers)
Simple stretching: 1600-3500 cm
Simple stretching: 1600-3500 cm
-1
-1
Complex vibrations: 400-1400 cm
Complex vibrations: 400-1400 cm
-1
-1
, called the
, called the
“fingerprint region”
“fingerprint region”
Baseline
Absorbanc
e/Peak

9
9
Interpretation
Interpretation
Looking for presence/absence of
Looking for presence/absence of
functional groups
functional groups
Correlation tables
Correlation tables
–
Wade: Ch. 12 and Appendices 2A and 2B
Wade: Ch. 12 and Appendices 2A and 2B
–
BTC: Chapter 11
BTC: Chapter 11
A polar bond is usually IR-active
A polar bond is usually IR-active
A nonpolar bond in a symmetrical
A nonpolar bond in a symmetrical
molecule will absorb weakly or not at all
molecule will absorb weakly or not at all

10
10
Carbon-Carbon Bond
Carbon-Carbon Bond
Stretching
Stretching
Stronger bonds absorb at higher frequencies:
Stronger bonds absorb at higher frequencies:
–
C-C 1200 cm
C-C 1200 cm
-1
-1
–
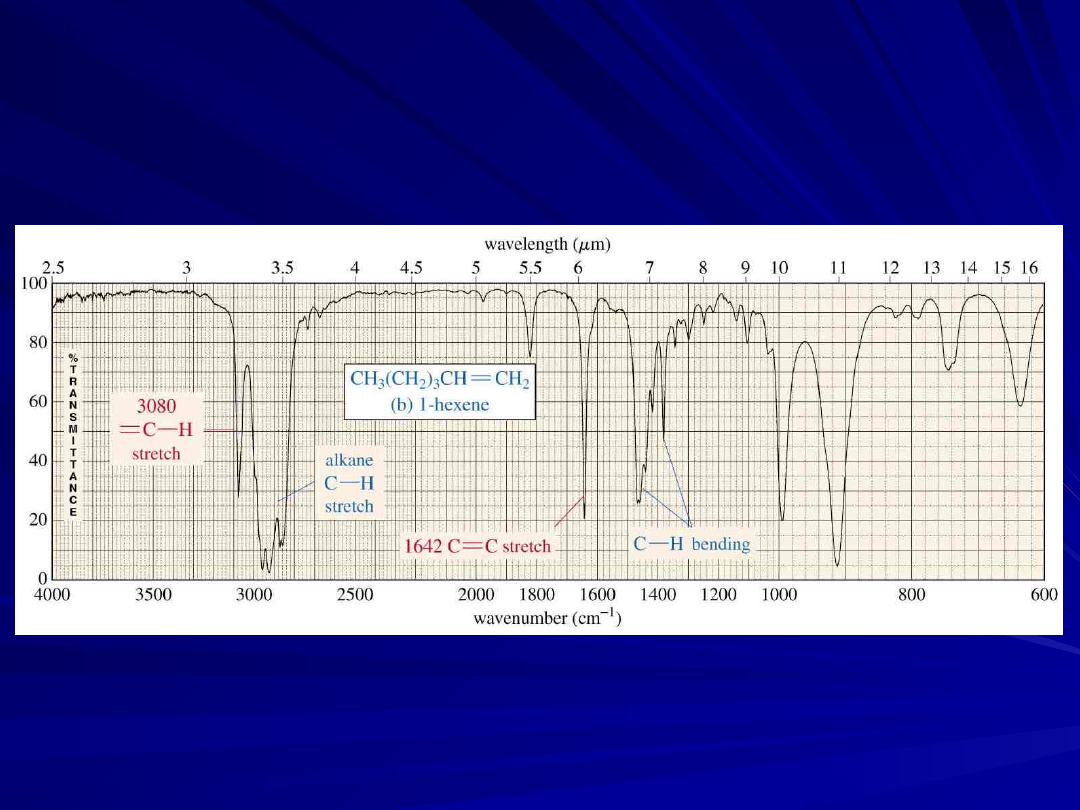
C=C 1660 cm
C=C 1660 cm
-1
-1
–
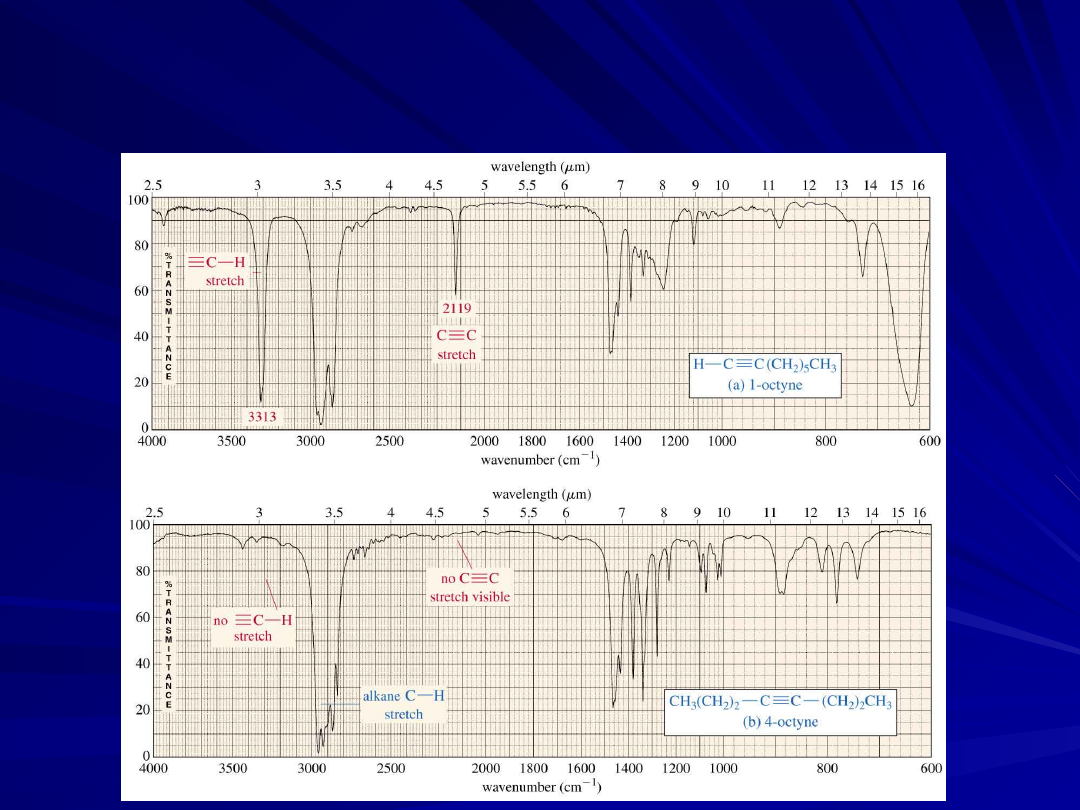
C
C
C 2200 cm
C 2200 cm
-1
-1
(weak or absent if internal)
(weak or absent if internal)
Conjugation lowers the frequency:
Conjugation lowers the frequency:
–
isolated C=C
isolated C=C
1640-1680 cm
1640-1680 cm
-1
-1
–
conjugated C=C
conjugated C=C
1620-1640 cm
1620-1640 cm
-1
-1
–
aromatic C=C
aromatic C=C
approx. 1600 cm
approx. 1600 cm
-1
-1

11
11
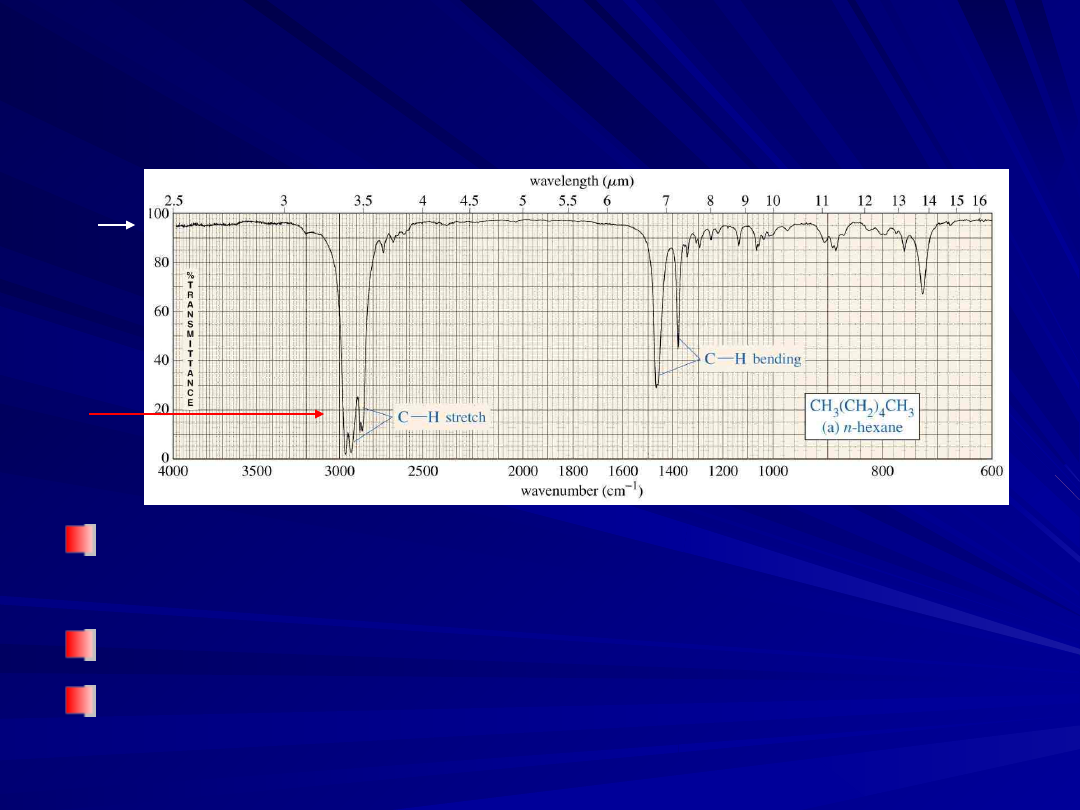
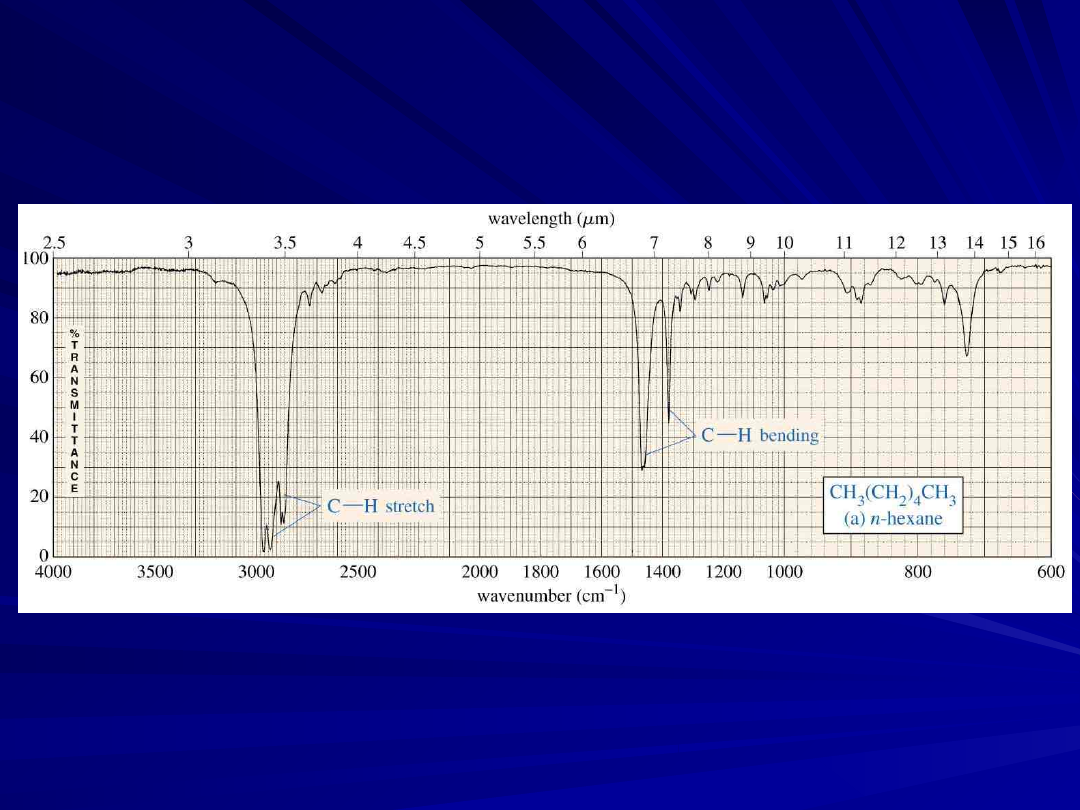
Carbon-Hydrogen Stretching
Carbon-Hydrogen Stretching
Bonds with more
Bonds with more
s
s
character absorb
character absorb
at a higher frequency
at a higher frequency
–
sp
sp
3
3
C-H, just below 3000 cm
C-H, just below 3000 cm
-1
-1
(to the
(to the
right)
right)
–
sp
sp
2
2
C-H, just above 3000 cm
C-H, just above 3000 cm
-1
-1
(to the
(to the
left)
left)
–
sp
sp
C-H, at 3300 cm
C-H, at 3300 cm
-1
-1
12
12
An Alkane IR Spectrum
An Alkane IR Spectrum
13
13
An Alkene IR Spectrum
An Alkene IR Spectrum
14
14
An Alkyne IR Spectrum
An Alkyne IR Spectrum

15
15
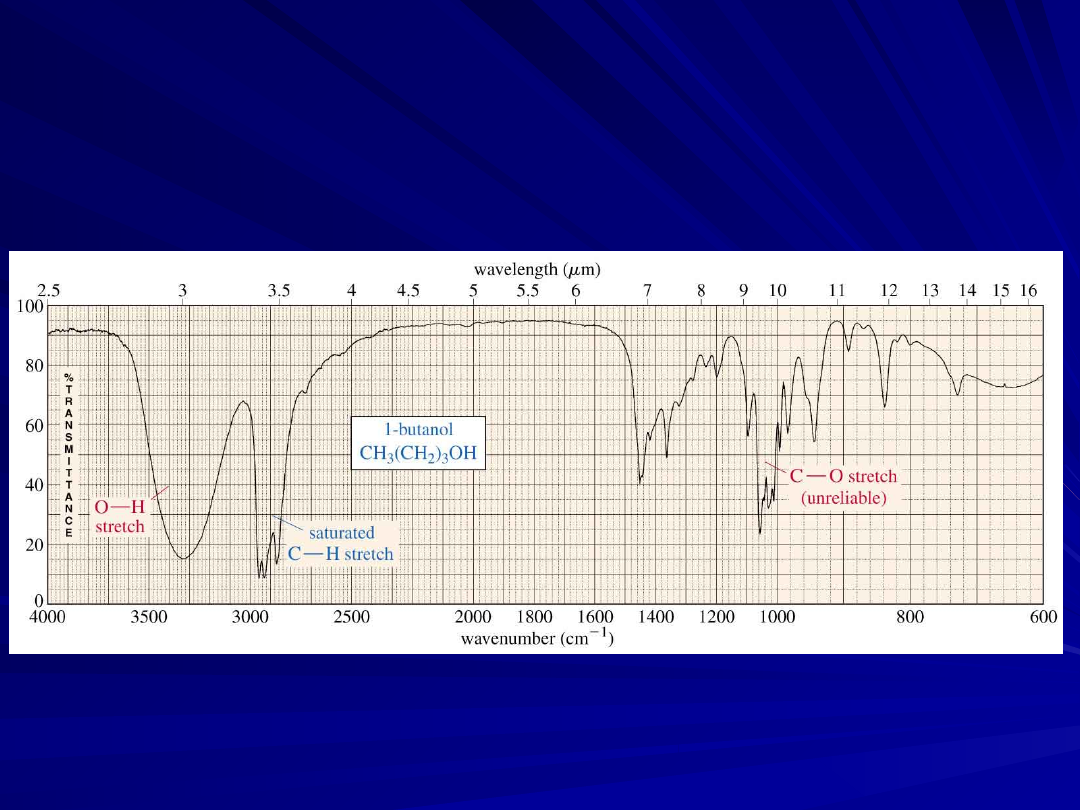
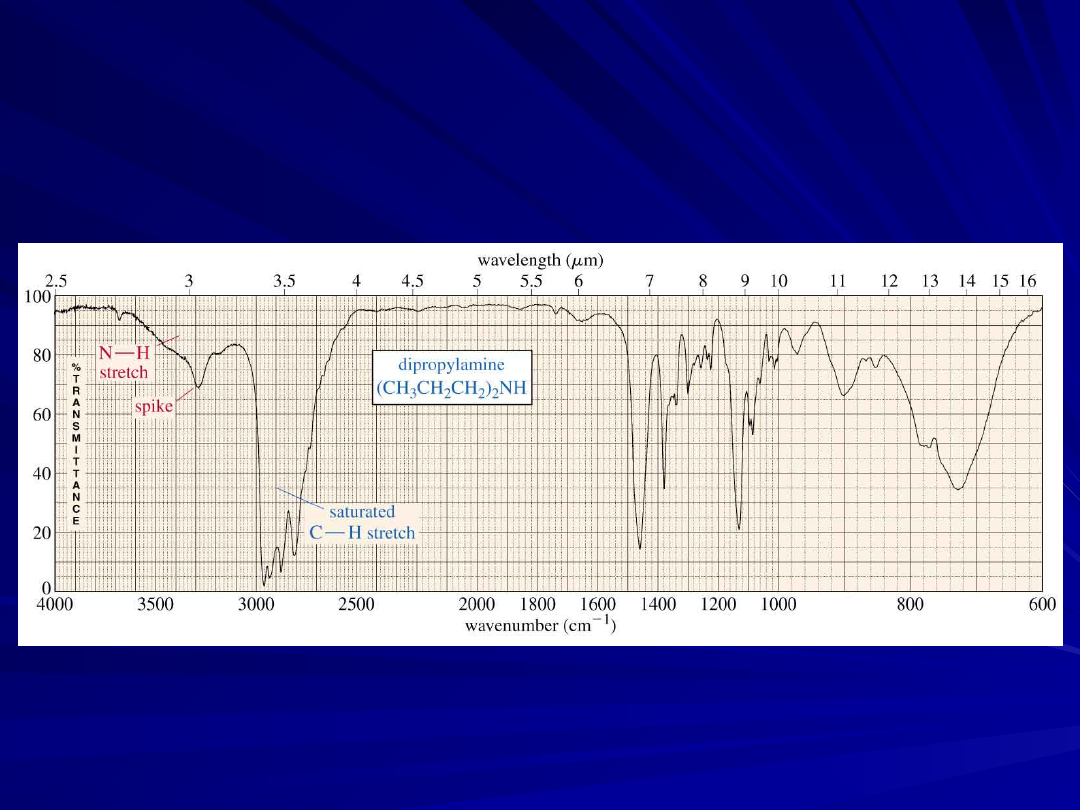
O-H and N-H Stretching
O-H and N-H Stretching
Both of these occur around 3300 cm
Both of these occur around 3300 cm
-
-
1
1
, but they look different
, but they look different
–
Alcohol O-H, broad with rounded tip
Alcohol O-H, broad with rounded tip
–
Secondary amine (R
Secondary amine (R
2
2
NH), broad with one
NH), broad with one
sharp spike
sharp spike
–
Primary amine (RNH
Primary amine (RNH
2
2
), broad with two
), broad with two
sharp spikes
sharp spikes
–
No signal for a tertiary amine (R
No signal for a tertiary amine (R
3
3
N)
N)
16
16
An Alcohol IR Spectrum
An Alcohol IR Spectrum
17
17
An Amine IR
An Amine IR
Spectrum
Spectrum

18
18
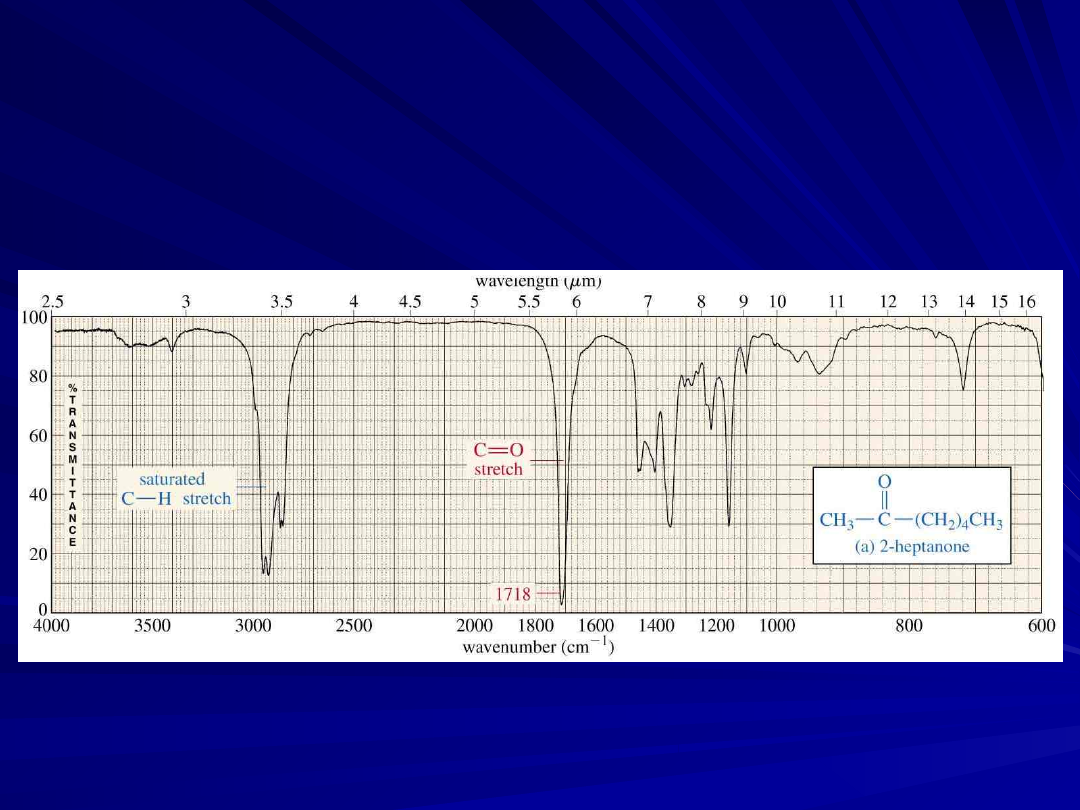
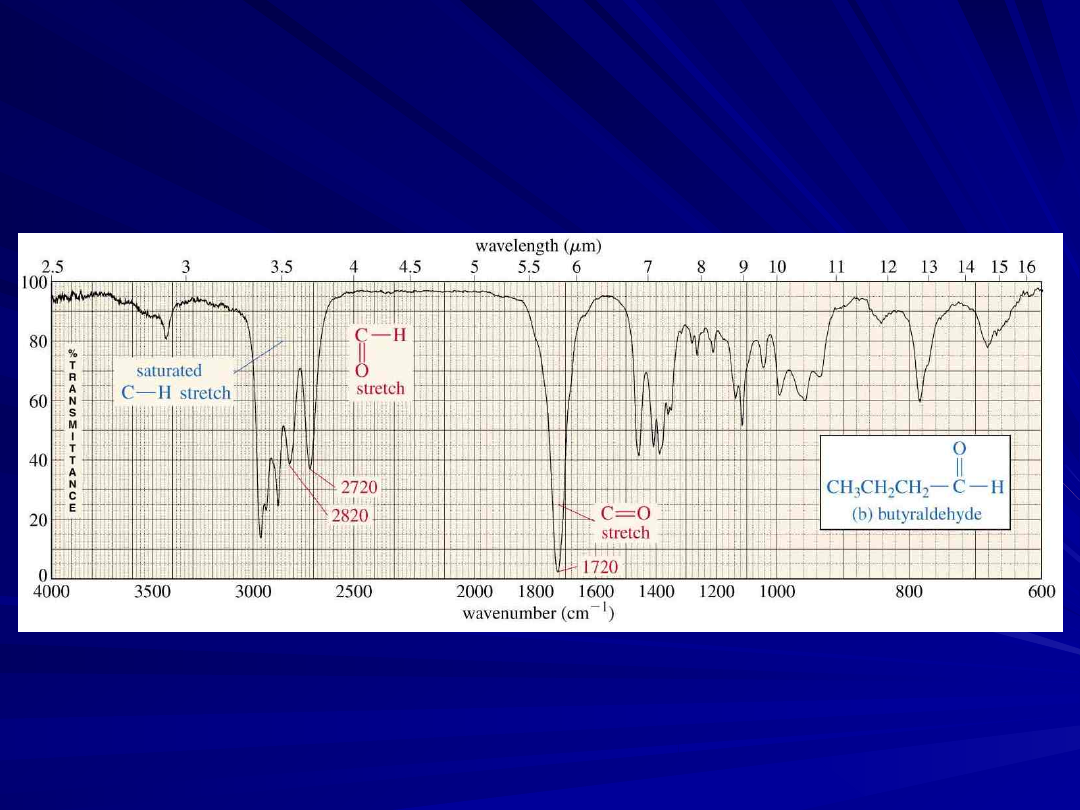
Carbonyl Stretching
Carbonyl Stretching
The C=O bond of simple ketones,
The C=O bond of simple ketones,
aldehydes, and carboxylic acids absorb
aldehydes, and carboxylic acids absorb
around 1710 cm
around 1710 cm
-1
-1
Usually, it’s the strongest IR signal
Usually, it’s the strongest IR signal
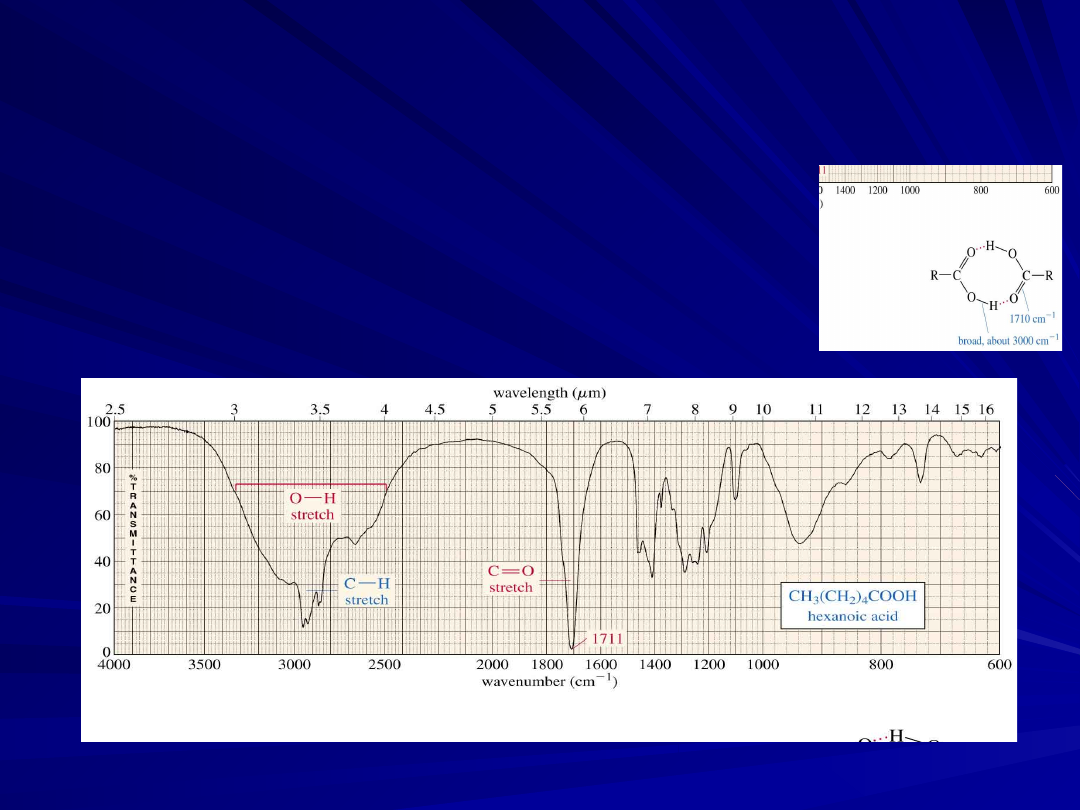
Carboxylic acids will have O-H also
Carboxylic acids will have O-H also
Aldehydes have two C-H signals around
Aldehydes have two C-H signals around
2700 and 2800 cm
2700 and 2800 cm
-1
-1
19
19
A Ketone IR
A Ketone IR
Spectrum
Spectrum
20
20
An Aldehyde IR Spectrum
An Aldehyde IR Spectrum
21
21
O-H Stretch of a Carboxylic
O-H Stretch of a Carboxylic
Acid
Acid
This O-H absorbs broadly, 2500-3500 cm
This O-H absorbs broadly, 2500-3500 cm
-
-
1
1
, due to strong hydrogen bonding
, due to strong hydrogen bonding

22
22
Variations in C=O Absorption
Variations in C=O Absorption
Conjugation of C=O with C=C lowers the stretching
Conjugation of C=O with C=C lowers the stretching
frequency to ~1680 cm
frequency to ~1680 cm
-1
-1
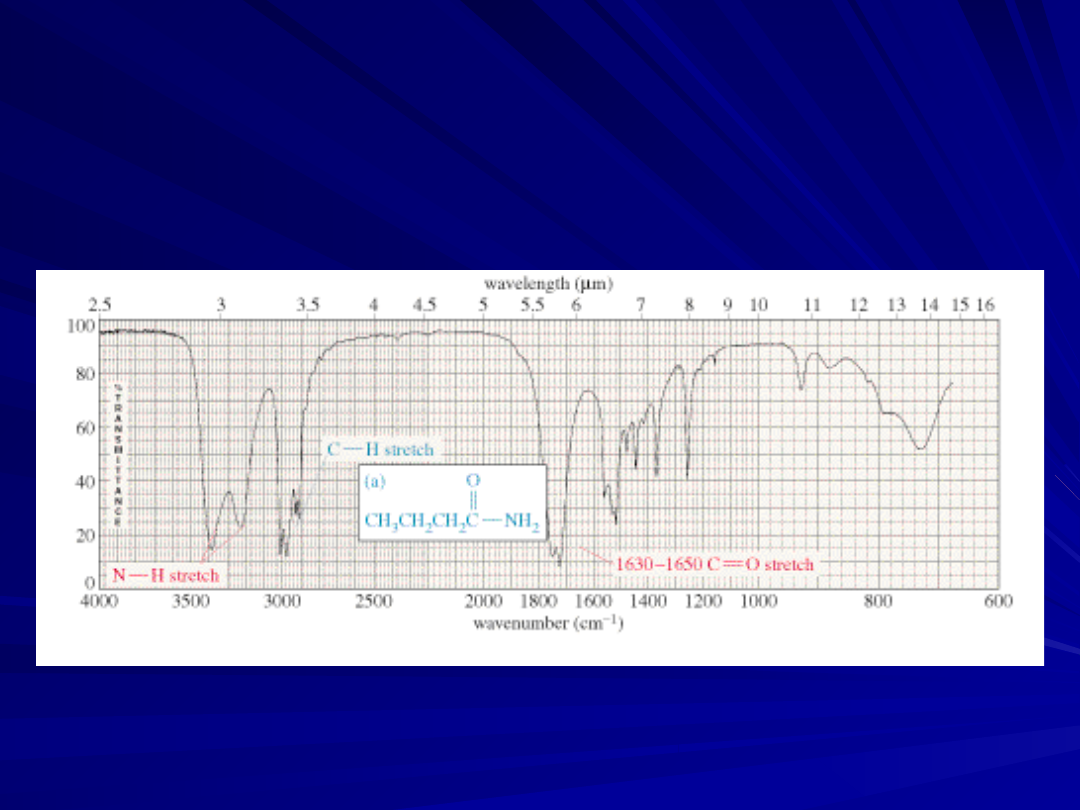
The C=O group of an amide absorbs at an even
The C=O group of an amide absorbs at an even
lower frequency, 1640-1680 cm
lower frequency, 1640-1680 cm
-1
-1
The C=O of an ester absorbs at a higher frequency,
The C=O of an ester absorbs at a higher frequency,
~1730-1740 cm
~1730-1740 cm
-1
-1
Carbonyl groups in small rings (5 C’s or less)
Carbonyl groups in small rings (5 C’s or less)
absorb at an even higher frequency
absorb at an even higher frequency
23
23
An Amide IR
An Amide IR
Spectrum
Spectrum

24
24
Carbon - Nitrogen
Carbon - Nitrogen
Stretching
Stretching
C - N absorbs around 1200 cm
C - N absorbs around 1200 cm
-1
-1
C = N absorbs around 1660 cm
C = N absorbs around 1660 cm
-1
-1
and is much
and is much
stronger than the C = C absorption in the same
stronger than the C = C absorption in the same
region
region
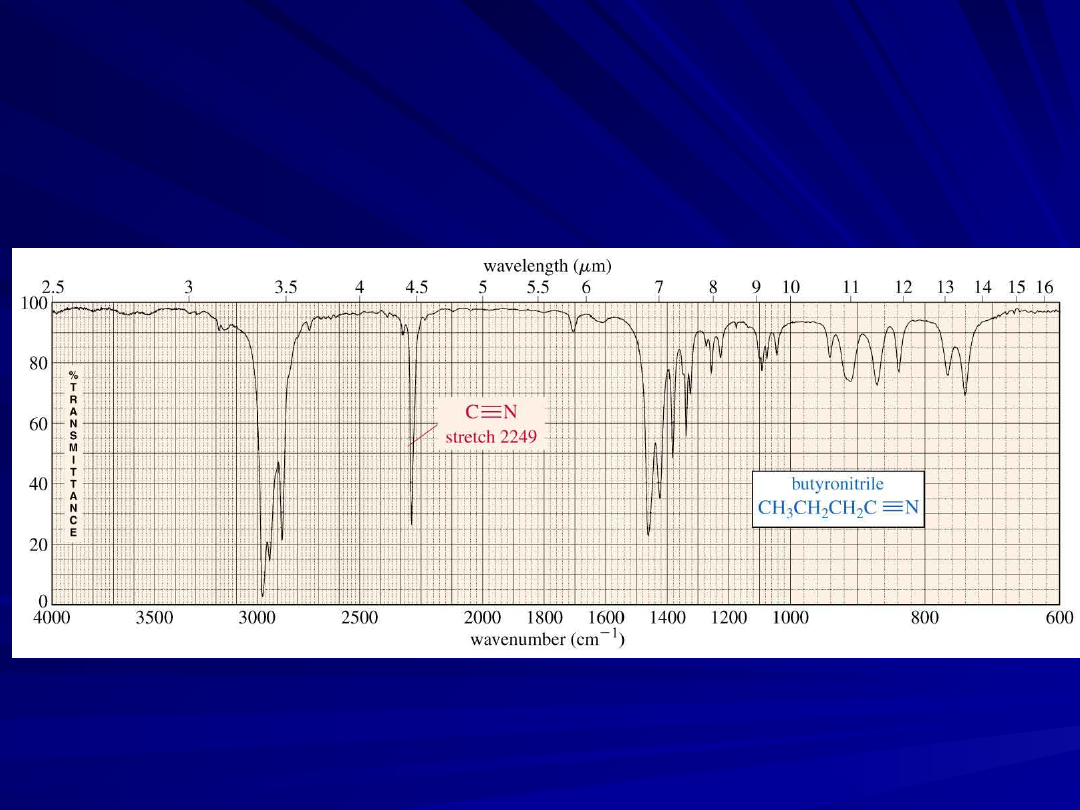
C
C
N absorbs strongly just
N absorbs strongly just
above
above
2200 cm
2200 cm
-1
-1
.
.
The alkyne C
The alkyne C
C signal is much weaker and is
C signal is much weaker and is
just
just
below
below
2200 cm
2200 cm
-1
-1
25
25
A Nitrile IR Spectrum
A Nitrile IR Spectrum
26
26
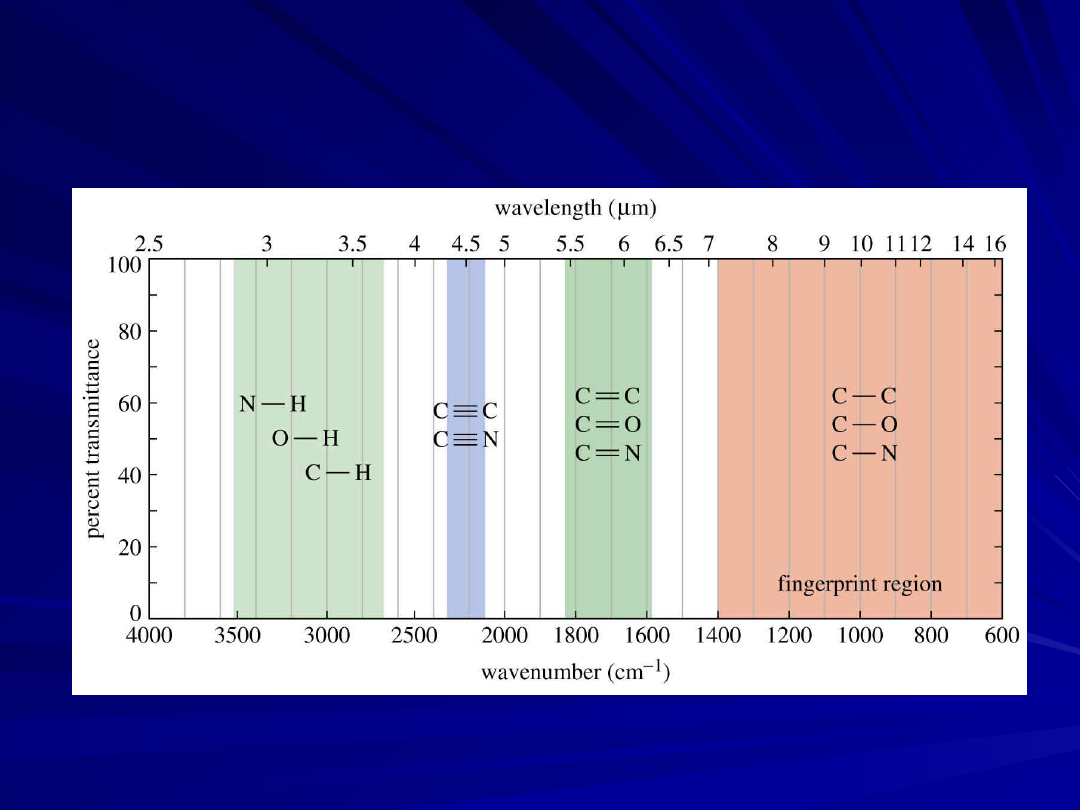
Summary of IR Absorptions
Summary of IR Absorptions

27
27
Strengths and Limitations
Strengths and Limitations
IR alone cannot determine a structure
IR alone cannot determine a structure
Some signals may be ambiguous
Some signals may be ambiguous
The functional group is usually indicated
The functional group is usually indicated
The
The
absence
absence
of a signal is definite proof
of a signal is definite proof
that the functional group is absent
that the functional group is absent
Correspondence with a known sample’s IR
Correspondence with a known sample’s IR
spectrum confirms the identity of the
spectrum confirms the identity of the
compound
compound
Document Outline
- Slide 1
- Slide 2
- Slide 3
- Slide 4
- Slide 5
- Slide 6
- Slide 7
- Slide 8
- Slide 9
- Slide 10
- Slide 11
- Slide 12
- Slide 13
- Slide 14
- Slide 15
- Slide 16
- Slide 17
- Slide 18
- Slide 19
- Slide 20
- Slide 21
- Slide 22
- Slide 23
- Slide 24
- Slide 25
- Slide 26
- Slide 27
Wyszukiwarka
Podobne podstrony:
uml LECTURE
lecture3 complexity introduction
196 Capital structure Intro lecture 1id 18514 ppt
Lecture VIII Morphology
benzen lecture
lecture 1
Lecture10 Medieval women and private sphere
8 Intro to lg socio1 LECTURE2014
lecture 3
Ir 1 (R 1) 127 142 Rozdział 09
IR and philosophy of history
Lecture1 Introduction Femininity Monstrosity Supernatural
G B Folland Lectures on Partial Differential Equations
4 Intro to lg morph LECTURE2014
LECTURE 2 Prehistory
lecture01
Descriptive Grammar lecture 6
więcej podobnych podstron