
Cykl życia branży + Rating
Cykl życia branży + Rating
Wprowadzenie do wyboru
branży w procesie
inwestowania

Cena akcji
Czas - lata
Faza I
Faza II
Faza III
Faza IV
Faza V
Faza VI
Venture
capital
D=
0
D=
0
D -
duża
D –
malejąca
D=
0

Faza I
Faza I
Duże nakłady inwestycyjne
Duże koszty przygotowania i
wdrożenia do produkcji nowego
wyrobu (300 tys. aut)
Poszukiwanie nowych wynalazków
(firmy garażowe, duża rola
inżynierów)
Duża rola funduszy Venture Capital (1
/ 5 sukcesów)

Faza II
Faza II
Spółka poszukuje finansowania
zewnętrznego – emisja publiczna,
debiut giełdowy.
Nie wypłaca dywidendy
Silny wzrost ceny akcji na
giełdzie
Stopa zwrotu
0
0
%
C
PP
D
C
C
i
t
t
t

Faza III - dojrzałości
Faza III - dojrzałości
Branża generuje duże przychody – jest
na szczycie popularności
Obecnie branża lotnicza i przemysł
samochodowy
Poszukiwanie wynalazków, które w
przyszłości pozwolą utrzymać się
firmie na szczycie.
Mała zmiana kursu akcji
Wypłata dużych dywidend.

Akcje wdów i sierot
Akcje wdów i sierot
widows and orphans
widows and orphans
Blue chips
Monopol produkcji (podtrzymywany
przez państwo)
Wysoka dywidenda

Czas -
lata
Dywidenda w USD na jedną akcję
Kredyt
Zmiana polityki
dywidendy

Lintner's Model
Lintner's Model
A model stating that dividend policy is based on two
parameters: (1) the target payout ratio and (2) the speed at
which current dividends adjust to the target.
In 1956 John Lintner developed this theory from two
important observations that he made of dividend policy:
1) Companies tend to set long-run target ratios of dividends
to earnings according to the amount of positive NPV projects
they have available.
2) Earnings increases are not always sustainable. As a
result, dividend policy is not changed until managers can
see that new earnings levels are sustainable.

Back In Vogue: Dividends
Investopedia Staff (
If we had published this article during the dotcom boom, we would have no doubt been laughed at. Back then everything was going up in double-digit percentages. Nobody wanted to fool around with the meager 2-3%
gain from dividends. After all, we were in the new economy: "the rules had changed" and companies that paid dividends were "sooo old economy."
Well, as Bob Dylan once sang, "the times, they are a-changing." Dividends are no longer on the back burner now and, for many of us, they once again make a lot of sense. In this
what dividends are and how you can make them work for you.
Background on Dividends
Our website's dictionary defines a dividend as "a cash payment using profits that's announced by a company's board of directors to be distributed among stockholders." Dividends are an investor's share of the profits,
given for being an owner of the company. Once you are paid dividends, they are yours to keep. If you did an especially good job picking the right company, you will also be rewarded with a
price). Aside from option strategies, dividends are the only way to profit from ownership of stock without eliminating your stake in the company.
decides what percentage of earnings will be paid out to shareholders, and then the remaining profits are plowed back into the company. It is important to remember that a company is not
obligated to pay a dividend every single quarter. In fact, they may stop paying a dividend at any time. This, however, is rare, especially for firms with a long history of dividend payments, such as General Electric.
People are so used to their quarterly dividend from GE that a sudden stop of payments to investors would be the equivalent of the company's financial suicide. It would also indicate that something is fundamentally
wrong with the company. The board of directors will usually go to great lengths to keep paying at least the same dividend.
Free Options Information KitIf you are looking to take the "next step" in your investing career, or you are interested in investing in exciting and high potential investments, get this Free CD-ROM.
The great thing about dividends is they can't be faked. They are paid or not paid, increased or not increased. This isn't the case with earnings, as we've learned in past articles on
, and the new
. Earnings are nothing more than an accounting measurement. You can think of earnings as a "best guess" of a company's profitability. All too often, though, aggressive accounting practices make restating
reported earnings necessary. Because many investors base future stock price predictions on historical earnings, a company restating its earnings can really cause trouble. Dividends, unlike earnings, are impossible to
fake or restate. The check either comes, or it doesn't. No accountant can restate dividends and ask for that check back.
Where Have the Dividends Gone?
Most secure and stable companies, like utilities, offer dividends. Their share prices might not move all that much, but their steady dividend makes up for this. High growth companies, like technology, usually don't offer
dividends because all their profits are reinvested into the company to help sustain growth. Their theory is that, by reinvesting into themselves, they'll be able to give shareholders a better return through capital
appreciation.
For a company to continue to justify reinvesting into itself, it must keep growing at a huge pace. If growth slows, the stock won't climb as much, and dividends will be necessary to keep shareholders around. This
happens to virtually all companies after getting to a
. When this happens, regardless of how much money they plow back into the company, it's tough to double or triple growth like a
Companies simply reach a certain limit at which it is impossible to grow 30% or 40% percent a year--the law of big numbers stands in the way. A perfect example of this is Microsoft. In January of 2003 they finally
announced that they would pay a dividend. They became so big that it was time to stop being a high-flying growth stock.
The Power Of Dividend Growth
What should you look for in a stock that pays dividends? A common perception is that a high dividend yield, the annual dividends per share divided by price per share, is most important; however, a high yield usually
isn't the best choice. A yield that is considerably higher than that of other stocks in an industry may indicate a depressed stock price and may be a sign of a dividend cut or, worse, the elimination of the dividend. If you
see a stock that is paying 8% or more a year in dividends, then beware!
A better strategy is to look for a stock with a history of its dividends increasing over time. If you are a long-term investor, this strategy can be very rewarding. Let's demonstrate with an example:
Let's say you invest $1000 by buying buy ten shares, each at $100 per share, from Joe's Ice Cream Company. It's a well managed firm that gives a 2.5% dividend, which amounts to a total annual payment of $25.
That's decent but nothing to write home about. Because Joe is such a great manager, the company is always expanding. As earnings increase so does the dividend, which eventually gets put up to three dollars per
share (a yield of 3%). The company keeps on growing, and after several years the stock price is around $200. The current dividend yield is still 3.0%, so the payout is six dollars a share. Since you paid $100 per share,
your effective dividend yield is 6.0%. Now, fast forward a decade: Joe's Ice Cream Company enjoys great success as more and more North Americans move to the sun-drenched areas of the world. The stock price keeps
appreciating and sits at $130 after splitting three times. This means your initial $1000 investment in 10 shares has grown to 80 shares (20, then 40, and now 80 shares) worth $10,400. If the yield remains at 3%, it
pays a $3.90 dividend per share. Since you have 80 shares, as a result of splits, your payment is $312 per year. You are now earning $312 per year on what was originally a $1000 investment; that's a 31.2% return on
dividends alone! Your yield, regardless of stock price, has grown from a measly few percent to over 30% a year just because you invested in a growing company with a steady dividend policy.
This is nothing new. For decades many investors have been using this strategy with household companies like Coca-Cola, Johnson & Johnson, Kellogg, General Electric, etc. In fact, Johnson & Johnson has increased its
dividend every year for the past 38 years! If you bought the stock 30 years ago, the dividend yield that you'd earn on your initial shares would have grown approximately 12% annually. Today your earnings from
dividends alone would be a 48% annual return on your initial shares! This, however, doesn't come fast. The key to this strategy is to be a patient, long-term investor.
We'll be the first to admit this might not be the sexy investment strategy you've been looking for. But over the long run, using time-tested investment strategies with these "boring" companies will achieve returns that
are anything but boring.
In part two of this series, we delve into dividends a little more by taking a closer look at

Dividend Reinvestment Plans--Are They For You?
Investopedia Staff (
Thanks to dividend reinvestment plans (DRIPs), the "I don't have enough money to open a brokerage account" excuse no longer holds water. For as little as $10--yes, that's right, $10--you can
invest directly into some of the world's top corporations! (If you need a refresher on dividends, check out part one of this article, entitled "
.")
Background on DRIPs
A DRIP is a program, run by a public corporation, that allows individuals to make cash purchases of stock and/or to reinvest
directly from the company. DRIP plans offer investors the
option of reinvesting their cash dividends by purchasing additional shares or fractional shares.
DRIPs are an excellent option for investors wanting to invest in small amounts. To become eligible for a DRIP program, an investor usually needs only one share of stock. Some plans even allow
you to buy shares at a discount off the current share price. In our opinion, though, the best thing is that shares are purchased commission free. Because individuals deal directly with the
company, they essentially bypass the middleman. DRIPs are traditionally used by individual investors looking for a long-term investment.
At last count there were in excess of 1,000 corporations offering different types of DRIPs. These include companies like Bank of America, Coca Cola, Nokia, Phillip Morris, and Yahoo. The specifics
of the DRIP plan can vary depending on the corporation. For example, some corporations allow investors to make contributions to their DRIP as often as every week while others only allow stock
purchases on a monthly or quarterly basis. Because each DRIP plan is different, it is important to make sure you know what you're getting before you decide to go ahead with a DRIP.
Free Options Information KitIf you are looking to take the "next step" in your investing career, or you are interested in investing in exciting and high potential investments, get this Free CD-
ROM.
DRIPs Are Beneficial to Investors and to the Company
You may be wondering why a huge corporation would concern itself with selling a couple shares here and there. The company's advantage is that DRIPs offer the company low-cost access to
capital. When you purchase a stock on an exchange you are buying it from another investor, so the company sees no benefit from the sale. DRIPs are different. The DRIP shares are bought
directly from the company, and the proceeds from you buying the shares are then reinvested into the company.
Companies also like DRIPs because they get a stable shareholder base that typically has a long-term investment style. DRIP investors are highly unlikely to run for the exits when the markets
start to turn south, partly because selling DRIP shares takes a little more time and effort than just calling a broker.
How to Get Started
Many beginner direct investors make the mistake of thinking that just buying the shares in a brokerage account will count toward setting up a DRIP. Unfortunately, this is not the case. To start a
DRIP you must have the shares issued in your name. Most shares purchased though a broker are held "in street name," which means your broker is listed as the owner. The Moneypaper (
) informed us that for a flat $30 they get you started in a DRIP with a list of 1000 or more companies, and that's all you ever pay. Just remember that as an individual
investor dealing with DRIPs, you won't receive help from any brokers because Wall Street has no interest in selling stock without commissions. If you wish to use existing shares you own in a
DRIP, you must either use a transfer agent, or kindly ask your broker, who will typically charge you a fee for the service. Transfer agents include the NAIC (
http://www.better-investing.org/store/
) and Moneypaper.
Taxes and Dividends
One misconception is that DRIPs are not subject to tax because the investor is not receiving a cash dividend. While DRIPs are beneficial for their cost-effective approach to investing, they are still
subject to tax. Reinvested dividends received through a DRIP are still considered income and need to be accounted for. Like any stock,
from shares held in a DRIP are not calculated
and taxed until the stock is finally sold, usually several years down the road.
Keep in mind that we've just scratched the surface of this topic. If you're interested in learning more, here are some great sites for more information on DRIPs and DRIP companies:
- A newsletter designed to empower the individual investor through DRIPS.
- A monthly publication bringing you the latest news on dividend reinvestment plans and no-load stocks and their many commission-free investment options.
Motley Fool: Fool School: Drip Investing
- Tutorials and articles explaining DRIPs.
Have a Great Week!
Investopedia Staff

Don't Forget Dividends
By Ben McClure
October 29th, 2003
“The only thing that gives me pleasure is to see my dividend coming in.” --John D. Rockefeller.
One of the simplest ways for companies to communicate financial well being and shareholder value is to say “the
check is in the mail.” Dividends, those cash distributions that many companies pay out
regularly to shareholders from earnings, send a clear, powerful message about future prospects and performance. A company's willingness and capability to pay steady dividends over time and its power to increase
them provide good clues about its fundamentals.
Dividends Signal Fundamentals
Before corporations were required to disclose financial information in the 1930s, a company's ability to pay dividends was one of the few signs of its financial health. Dividends, however, remain a worthwhile yardstick
of company's prospects.
Typically, mature, profitable companies pay dividends. By contrast, companies that have no profits to distribute are ill-advised to pay dividends. However, companies that do not pay dividends are not necessarily
without profits. If a company thinks that its own growth opportunities are better than investment opportunities available to shareholders elsewhere, the company should keep the profits and reinvest them into the
business. For these reasons, few “
” companies pay dividends.
A company's health is judged by the consistency of dividend payments. Many investors like to watch
, which is the annual dividend income per share divided by the current share price. The dividend yield
measures the amount of income received in proportion to the share price. If a company has a low dividend yield compared to other companies in its sector, it can mean two things: (1) the share price is high because
the market reckons the company has impressive prospects and isn't overly worried about the company's dividend payments, or (2) the company is in trouble and cannot afford to pay reasonable dividends.
As I mentioned earlier, for growth companies, substantial dividend yield is of little importance because retained earnings will be reinvested in expansion opportunities, giving shareholders profits in the form of
. Even mature companies, while much of their profits may be distributed as dividends, still need to retain enough cash to fund business activity and handle contingencies.
When you are evaluating a company's dividend-paying practices, ask yourself if the company can afford to pay the dividend. The ratio between a company's earnings and net dividend paid to shareholders--known as
dividend coverage--remains a well-used tool for measuring whether earnings are sufficient to cover dividend obligations. The ratio is calculated as earnings per share divided by the dividend per share.
Investors can feel safe with a coverage ratio of two or three. In practice, however, the coverage ratio becomes a pressing indicator when coverage slips below about 1.5. That's when prospects start to look risky. If the
ratio is under 1, the company is using its retained earnings from last year to pay this year's dividend. When coverage is getting thin, odds are good that there will be a dividend cut that can have a dire impact on
valuation. At the same time, if the payout gets very high, say above 5, investors should ask whether management is starving the business or is leaving enough room for a bad quarter or year.
Managers that raise their dividends are telling investors that the course of business over the coming twelve months or more will be stable. When Kimberly Clark, the giant of personal care products, increased its
dividend by 13% in the first quarter of 2003, the company was telling investors that the punishing price war with Proctor & Gamble was not a long-term problem. The signal was even stronger because KC said it
intended to increase its dividend further over the following five years.
By contrast, if a company with a history of consistent rising dividend payments suddenly cuts its payments, investors should treat this as a signal that trouble is looming. Texas Utilities, once recognized for its
consistent payouts, was among the highest-yielding stocks available. Then in 2002 the company cut its quarterly dividend, and the stock price plummeted by nearly a third in a single day.
While a history of steady or increasing dividends is certainly reassuring, investors still need to be wary of companies that rely on borrowings to finance those payments. Take the utilities industry, which once attracted
investors with reliable earnings and fat dividends. As some of those companies have diverted cash into expansion opportunities while trying to maintain dividend levels, they have had to take on greater debt levels.
Watch out for companies with debt-to-equity ratios greater than 60%. Higher debt levels often lead to pressure from Wall Street as well as debt-rating agencies. That, in turn, can hamper a company's ability to pay its
dividend.
Great Disciplinarian
Dividends bring more discipline to management's investment decision making. Holding onto profits might lead to excessive executive compensation, sloppy management and unproductive use of assets. University of
finds that the more cash a company keeps, the more likely it will overpay for
and, in turn, damage shareholder value. In fact, companies that pay dividends tend to
be more efficient in their use of capital than similar companies that do not pay dividends.
Furthermore, companies that pay dividends are less likely to be
. Let's face it. Managers can be awfully creative when it comes to making earnings look good. But with dividend obligations to meet
twice a year, manipulation becomes that much more challenging.
Besides, dividends are public promises. Breaking them is both embarrassing to management and damaging to share prices. To tarry over raising dividends, never mind suspending them, is seen as a confession of
failure.
A Way to Calculate Value
Dividends can give investors a sense of what a company is really worth. The
is a classic formula that explains the underlying value of a share, and it is a staple of the
which, in turn, is the basis of corporate finance theory. According to the model, a share is worth the sum of all its prospective dividend payments, discounted back to their net
. As uncertainty
always surrounds companies' future dividends (and the appropriate
), the dividend-discount model remains an essential tool. It is important to note also that stocks with dividends are less likely to reach
unsustainable values. Investors have long known that dividends put a ceiling on market declines.
Conclusion
The bottom line is that dividends matter. Evidence of profitability in the form of a dividend check can help investors sleep more easily. Profits on paper say one thing about a company's prospects; profits that produce
cash dividends say another thing entirely.

How and Why Do Companies Pay Dividends?
Investopedia Staff (
Printer friendly version
Look anywhere on the web and you're bound to find information on how dividends affect stockholders: the information ranges from a consideration of steady flows of income, to the
proverbial "widows and orphans," and to the many different tax benefits that dividend-paying companies provide. An important part missing in many of these discussions is the purpose of
dividends and why they are used by some companies and not by others. Before we begin describing the various policies that companies use to determine how much to pay, let's look at
different arguments for and against dividends policies.
First, some financial analysts feel that the consideration of a dividend policy is irrelevant because investors have the ability to create homemade dividends. This is done by adjusting a
personal portfolio to reflect the investor's own preferences. For example, investors looking for a steady stream of income are more likely to invest in bonds (whose interest payments don't
change), rather than a dividend paying stock (whose value can fluctuate). Because their interest payments won't change, those who own bonds don't care about a particular company's
dividend policy.
The second argument suggests that little to no dividend payout is more favorable for investors. Supporters of this policy point out that taxation on a dividend is higher than on capital gain.
The argument against dividends is based on the belief that a firm who reinvests funds (rather than pays it out as a dividend) will increase the value of the firm as a whole and consequently
increase the market value of the stock. According to the proponents of the no-dividend policy, a company's alternatives to paying out excess cash as dividends are the following:
undertaking more projects, repurchasing the company's own shares, acquiring new companies and profitable assets, and reinvesting in financial assets.
In opposition to these two arguments is the idea that a high dividend payout is more important for investors because dividends provide certainty about the company's financial well being;
dividends are also attractive for investors looking to secure current income. The principle behind the attractiveness of a company's ability to pay high dividends is that it provides certainty
about the company's financial well being. There are many examples of how the decrease and increase of a dividend distribution can affect the price of a security. Companies that have a
long standing history of stable dividend payouts would be negatively affected by lowering or omitting dividend distributions; these companies would be positively affected by increasing
dividend payouts or making additional payouts of the same dividends. Furthermore, companies without a dividend history are generally viewed favorably when they declare new dividends.
Get a FREE Investing Education Kit Mailed Today!Learn to trade the markets like a Pro! Explore our wide range of FREE offers including CD-ROMs, Books, Home Study Courses,
Software, and even Trade Recommendations. Click Here To see the FREE Offers.
Now, should the company decide to follow either the high or low dividend method, it would use one of three main approaches: residual, stability, or a compromise between the two.
Residual
Companies using the residual dividend policy choose to rely on internally generated equity to finance any new projects. As a result, dividend payments can only come out of the residual or
leftover equity after all project capital requirements are met. These company's usually attempt to maintain balance in their debt/equity ratios before making any dividend distributions,
which demonstrates that such a company decides upon dividends only if there is enough money leftover after all operating and expansion expenses are met. For example, let's suppose
that a company named CBC has recently earned $1000 and has a strict policy to maintain a debt/equity ratio of 0.5 (one part debt to every two parts of equity). Now, say this company had
a project with a capital requirement of $900. In order to maintain the debt/equity ratio of 0.5, CBC would have to pay 1/3 by using debt ($300) and 2/3 ($600) by using equity. In other words
the company would have to borrow $300 and use $600 of its equity to maintain the 0.5 ratio, leaving a residual amount of $400 ($1000-$600) for dividends. On the other hand, if the
project had a capital requirement of $1500, the debt requirement would be $500 and the equity requirement would be $1000, leaving $0 ($1000-$1000) for dividends. Should any project
require an equity portion that is greater than the company's available levels, the company would issue new stock.
Stability
The fluctuation of dividends created by the residual policy significantly contrasts the certainty of the dividend stability policy. With the stability policy, companies may choose a cyclical
policy that sets dividends at a fixed fraction of quarterly earnings, or they may choose a stable policy whereby quarterly dividends are set at a fraction of yearly earnings. In either case, the
aim of the dividend stability policy is to reduce uncertainty for investors and to provide them with income. Suppose our imaginary company CBC earned the $1000 for the year (with
quarterly earnings of $300, $200, $100, $400). If CBC decided upon a stable policy of 10% of yearly earnings ($1000*10%), it would pay $25 ($100/4) to shareholders every quarter.
Alternatively, if CBC decided upon a cyclical policy, the dividend payments would adjust every quarter to be $30, $20, $10, and $40 respectively. In either instance, company's following this
policy are always attempting to share earnings with shareholders rather than searching for projects to invest excess cash.
Hybrid
The final approach is a combination between the residual and stable dividend policy. Using this approach, companies tend to view the debt/equity ratio as a long-term rather than a short-
term goal. In today's markets, this approach is commonly used by companies that pay dividends. As these companies will generally experience business cycle fluctuations, they will
generally have one set dividend, which is set as a relatively small portion of yearly income and can be easily maintained. On top of this set dividend, these companies will offer another
extra dividend paid only when income exceeds general obtained levels.
Cheers

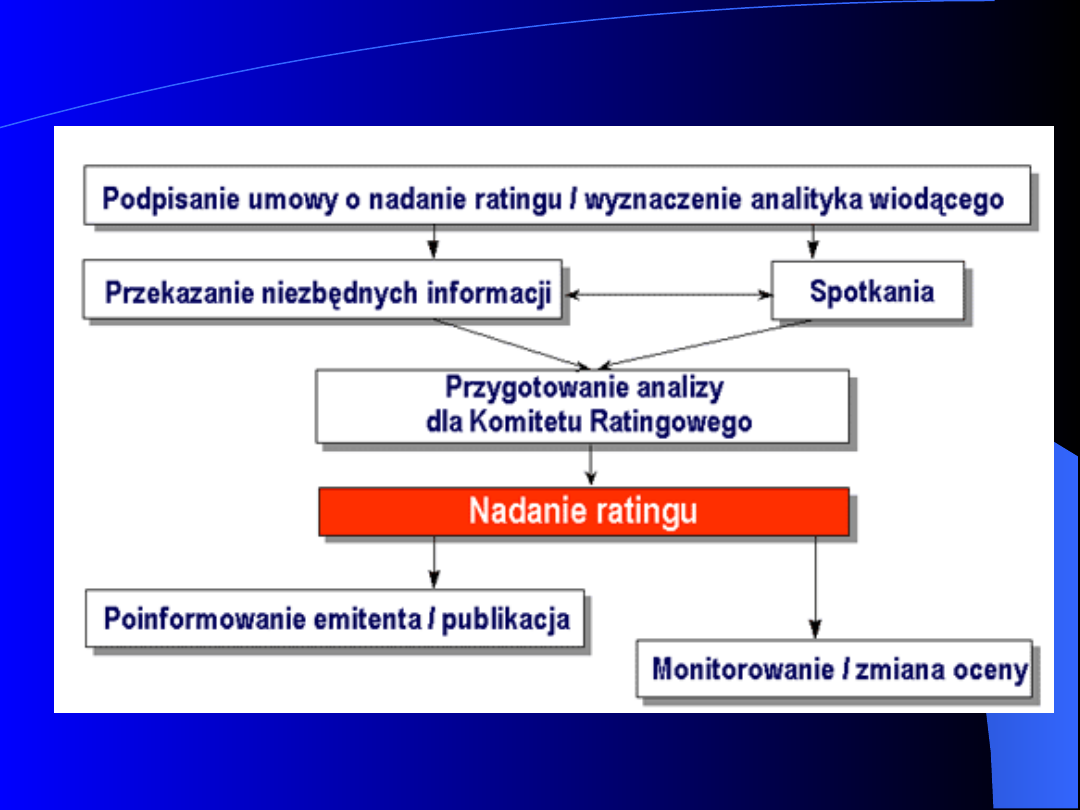
Rating
Rating

Co to jest rating?
Co to jest rating?
Rating jest niezależną i obiektywną oceną
ryzyka kredytowego podmiotu zaciągającego
dług na rynku. Innymi słowy jest to opinia
dotycząca możliwości obsługi zobowiązań
płatniczych zaciąganych przez dany podmiot.
Rating wyrażany jest odpowiednim symbolem
według przyjętej skali. Nadany rating jest
wynikiem przeprowadzenia wszechstronnej
analizy nie tylko sytuacji danego podmiotu
ale także otoczenia w jakim działa.

Co to jest rating?
Co to jest rating?
Rating jest ważnym elementem
uwzględnianym przez inwestorów przy
podejmowaniu decyzji inwestycyjnych.
Rating może być nadany:
- emisji papierów dłużnych: obligacji lub
krótkoterminowych papierów dłużnych
- podmiotowi zaciągającemu
zobowiązanie na rynku finansowym.

Co to jest rating?
Co to jest rating?
Nadany rating jest monitorowany przez
agencję do momentu wykupu
przeprowadzonej emisji. Agencja ma
prawo w każdej chwili do weryfikacji
nadanego ratingu (zarówno w górę jak
i w dół) w przypadku, gdy wystąpią
okoliczności lub zdarzenia
uzasadniające taką decyzję.

Ratingi:
Międzynarodowe
Krajowe
Banków

Skala - międzynarodowa
Skala - międzynarodowa
Ratingi długoterminowe
Poziom inwestycyjny
AAA
Najwyższa jakość kredytowa.
Oznacza, że istnieje najniższe oczekiwanie wystąpienia
ryzyka kredytowego. Ratingi "AAA" nadawane są jedynie
w sytuacji, gdy zdolność do terminowej spłaty
zobowiązań finansowych jest wyjątkowo wysoka.
Prawdopodobieństwo, że przewidywalne zdarzenia
negatywnie wpłyną na zdolność do regulowania
zobowiązań jest bardzo niewielkie.

Skala - międzynarodowa
Skala - międzynarodowa
AA
Bardzo wysoka jakość kredytowa.
Oznacza istnienie bardzo niskiego oczekiwania ryzyka
kredytowego. Wskazuje na bardzo wysoką zdolność do
terminowej spłaty zobowiązań finansowych. Zdolność ta
jest mało podatna na przewidywalne wydarzenia.
A
Wysoka jakość kredytowa.
Oznacza niskie oczekiwanie ryzyka kredytowego.
Zdolność spłaty zobowiązań finansowych jest uważana
za wysoką. Zdolność ta jednak może być bardziej
podatna na zmiany okoliczności lub warunków
gospodarczych niż w przypadku wyższych kategorii.

Skala - międzynarodowa
Skala - międzynarodowa
BBB
Dobra jakość kredytowa.
Oznacza, że obecnie występuje niskie
oczekiwanie ryzyka kredytowego.
Zdolność do terminowego regulowania
zobowiązań finansowych jest uznana za
odpowiednią, jednak istnieje większe
prawdopodobieństwo, że pojawiające
się niekorzystne zmiany okoliczności lub
warunków gospodarczych mogą ją
osłabić. Jest to najniższa kategoria
inwestycyjna.

Skala - międzynarodowa
Skala - międzynarodowa
Poziom spekulacyjny
BB
Ocena spekulacyjna.
Oznacza, że istnieje możliwość wzrostu ryzyka
kredytowego, szczególnie w wyniku
niekorzystnych zmian w gospodarce.
Wywiązanie się ze zobowiązań jest jednak
zależne od alternatywnych możliwości
prowadzenia działalności bądź uzyskania źródeł
finansowania. Papiery zakwalifikowane do tej
kategorii nie znajdują się na poziomie
inwestycyjnym.

Skala - międzynarodowa
Skala - międzynarodowa
B
Ocena wysoce spekulacyjna.
Istnieje znaczne ryzyko kredytowe, ale pozostaje jeszcze
ograniczony margines bezpieczeństwa. Zobowiązania
finansowe są obecnie regulowane, jednak dalsza zdolność do
ich spłaty uzależniona jest od występowania dogodnych i
trwałych warunków rozwoju w otoczeniu gospodarczym.
CCC, CC, C
Wysokie ryzyko niewypłacalności.
Wysoce prawdopodobne jest wystąpienie niewypłacalności.
Zdolność do spłaty zobowiązań jest uzależniona wyłącznie od
korzystnych i trwałych zmian w gospodarce lub otoczeniu
gospodarczym, w którym działa dana instytucja. Rating "CC"
oznacza, że niewypłacalność w jakiejś formie wydaje się
prawdopodobna . Natomiast rating w wysokości "C" jest
sygnałem, że może ona nastąpić w każdej chwili.

Skala - międzynarodowa
Skala - międzynarodowa
DDD, DD, D
Niewypłacalność.
Ratingi zobowiązań w tej kategorii są oparte na szansie częściowej lub
całkowitej spłaty zobowiązań w wyniku reorganizacji lub likwidacji
dłużnika. Oczekiwana wartość spłaty jest wysoce spekulacyjna i nie
może być szacowana z jakąkolwiek precyzją. Generalnie można
określić, że zobowiązania oceniane na "DDD" mają największą szansę
na spłatę w 90%-100% ich wartości razem z zakumulowanymi
odsetkami. Zobowiązania z ratingiem "DD" wykazują potencjalnie
szansę na spłatę w wysokości 50%-90% natomiast "D"- poniżej 50%.
Podmioty, których oceny znalazły się w tej kategorii, nie dotrzymały
niektórych lub wszystkich swoich zobowiązań. Podmioty oceniane na
"DDD" mają największą szansę na kontynuowanie działalności po
dokonaniu lub bez potrzeby formalnej reorganizacji. Podmioty
oceniane na "DD" oraz "D" są generalnie w trakcie procesów
reorganizacji lub znajdują się w likwidacji. Te które oceniane są na
"DD" wykazują szansę na spłatę większej części swoich zobowiązań,
zaś te z oceną "D" mają małe szanse na spłatę wszystkich swoich
zobowiązań.

Skala - międzynarodowa
Skala - międzynarodowa
Ratingi krótkoterminowe
Poniższa skala ratingowa ma zastosowanie do ratingów w
walucie zagranicznej lub lokalnej (krajowej). Ratingi
krótkoterminowe mają horyzont czasowy do 12 miesięcy dla
większości zobowiązań lub do 3 lat w przypadku
amerykańskich papierów wartościowych. Z tego względu
większy nacisk jest położony na niezbędny poziom płynności
zapewniający terminową spłatę zobowiązań

Skala - międzynarodowa
Skala - międzynarodowa
F1
Najwyższa jakość kredytowa. Wskazuje na najwyższą zdolność
do spłaty zobowiązań finansowych w terminie. Znak "+" może
zostać dodany w celu zaznaczenia wyjątkowo dobrej zdolności
terminowej spłaty zobowiązań.
F2
Dobra jakość kredytowa. Terminowa zdolność do spłaty
zobowiązań finansowych jest satysfakcjonująca, jednak
margines bezpieczeństwa jest nieco mniejszy niż w kategorii
F1.
F3
Dostateczna jakość kredytowa. Odpowiednia zdolność do
terminowej spłaty zobowiązań finansowych. Jednakże
niesprzyjające zmiany (mające miejsce w nadchodzącym
czasie) mogą spowodować obniżenie oceny do poziomu
spekulacyjnego.

Skala - międzynarodowa
Skala - międzynarodowa
B
Ocena spekulacyjna. Bardzo mała zdolność do terminowej
spłaty zobowiązań finansowych oraz podatność na
niesprzyjające zmiany warunków finansowych i
ekonomicznych.
C
Wysokie ryzyko niewypłacalności. Istnieje realne ryzyko
niedotrzymania zobowiązań. Zdolność do spłaty zobowiązań w
terminie jest możliwa wyłącznie w przypadku zaistnienia
trwałych, korzystnych warunków ekonomicznych i
finansowych.
D
Niewypłacalność. Obecna lub mająca nastąpić wkrótce
niezdolność do spłaty zobowiązań finansowych.

Skala - międzynarodowa
Skala - międzynarodowa
Uwagi dla ratingów długo- i krótkoterminowych.
Znaki "+" i "-" mogą zostać dodane do poszczególnych ocen
ratingowych aby określić różnice w ramach jednej kategorii.
Znaków "+" i "-" nie stosuje się w przypadku długoterminowej
oceny AAA, oraz dla kategorii poniżej CCC, a także w
odniesieniu do ratingów krótkoterminowych innych niż F1.

Skala - międzynarodowa
Skala - międzynarodowa
"
NR" oznacza, iż FITCH nie nadał ratingu dla danych
emisji lub emitentów.
'Wycofany'. Rating zostaje wycofany w przypadku
gdy FITCH stwierdzi, że otrzymane informacje są
niewystarczające by nadać ocenę ratingową, lub
gdy wygaśnie zobowiązanie, zostało złożone
wezwanie do jego wykupu lub zostało
zrefinansowane.

Skala - międzynarodowa
Skala - międzynarodowa
Rating Watch. Lista obserwacyjna.
Ratingi są umieszczane na liście
obserwacyjnej by powiadomić inwestorów, że
istnieje prawdopodobieństwo, że ocena
ulegnie zmianie.
Pokazuje również w jakim kierunku ocena
może ulec zmianie. Używane są do tego
określenia "pozytywna" - wskazuje na
potencjalny wzrost, "negatywna" - potencjalny
spadek oraz "w toku" - potencjalny wzrost,
spadek lub brak zmiany.
Zmiany ratingu są dokonywane z reguły w
krótkim czasie.

Skala - międzynarodowa
Skala - międzynarodowa
Rating Outlook. Prognozy.
Wskazują w jakim kierunku może ulec zmianie ocena
ratingowa w perspektywie od roku do dwóch lat.
Prognozy mogą być "pozytywne" lub "negatywne" lub
"stabilne".
Pozytywna lub negatywna prognoza nie zakłada, że
zmiana oceny jest nieunikniona, podobnie jak w
przypadku ratingu z prognozą "stabilną" rating może
zostać podniesiony lub obniżony zanim prognoza
zostanie zmieniona na "pozytywną" lub "negatywną"
(jeżeli okoliczności usprawiedliwiają taką decyzję).
W szczególnych przypadkach FITCH może nie być w
stanie ocenić podstawowych kierunków zmian trendów,
w takim przypadku prognoza może być określona jako:
"w toku".
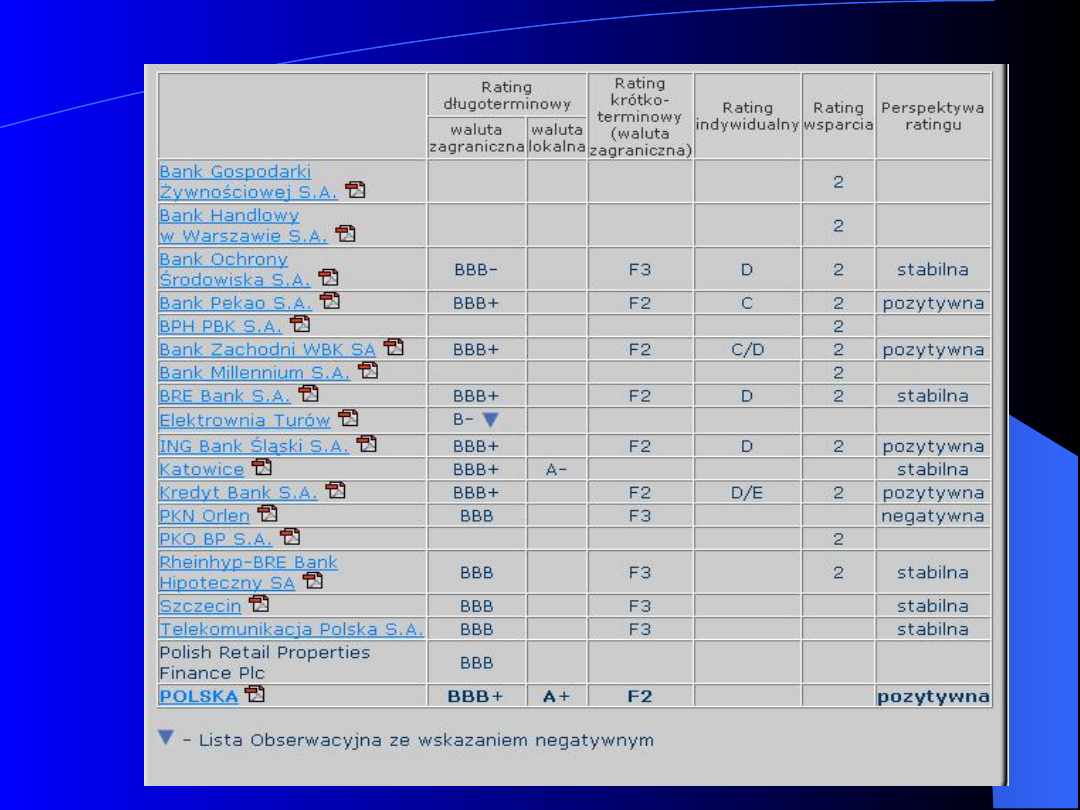
Rating z dnia
Rating z dnia
19.01.2004
19.01.2004

Najważniejsze Agencje
Najważniejsze Agencje
Ratingowe
Ratingowe

Moody's Standard
& Poor's
Fitch Duff &
Phelps
Krótka
charakterystyka
Aaa
AAA
AAA
AAA
P rime
Aa1
AA+
AA+
AA+
Aa2
AA
AA
AA
Aa3
AA-
AA-
AA-
A1
A+
A+
A+
A2
A
A
A
J akość powyżej średniej
A3
A-
A-
A-
Baa1
BBB+
BBB+
BBB+
Baa2
BBB
BBB
BBB
J akość nieco poniżej
średniej
Baa3
BBB-
BBB-
BBB-
Ba1
BB+
BB+
BB+
Ba2
BB
BB
BB
Ba3
BB-
BB-
BB-
B1
B+
B+
B+
B2
B
B
B
Charakter wysoce
spekulacyjny
B3
B-
B-
B-
CCC+
Ca
CCC
CCC
CCC
CCC-
Ca
CC
CC
C
C
C
J eszcze bardziej
spekulacyjne
CI
Obligacje dochodowe nie
wypłaca się odsetek
DDD
Zawieszenie obsługi długu
DD
DD
D
D
Charakter wybitnie spekulacyjny: znaczne ryzyko lub
zwłoka w regulowaniu zobowiązań
Znaczące ryzyko, niska
zdolność kredytowa
Obsługa długu może być
nieregularna, niezwykle
spekulacyjne
Wysoka zdolność kredytowa - charakter inwestycyjny
Pierwszorzędne
maksymalne
bezpieczeństwo
Bardzo wysoka ocena,
wysoka jakość
Charakter spekulacyjny - non investment grade, high yield
bonds, junk bonds
High
quality
Upper
medium
grade
Medium
grade
Niska ocena, charakter
spekulacyjny

Moody's Standard
& Poor's
Fitch Duff &
Phelps
A-1 +
F-1 +
Duff 1+
P-1
A-1
F-1
Duff 1
Duff 1 -
P-2
A-2
F-2
Duff 2
Klasa druga
P-3
A-3
F-3
Duff 3
NP.
B
F-S
Duff 4
C
D
D
Duff 5
Zagrożone
Klasa
pierwsza
Charakter spekulacyjny
Charakter inwestycyjny
Document Outline
- Slide 1
- Slide 2
- Slide 3
- Slide 4
- Slide 5
- Slide 6
- Slide 7
- Slide 8
- Slide 9
- Slide 10
- Slide 11
- Slide 12
- Slide 13
- Slide 14
- Slide 15
- Slide 16
- Slide 17
- Slide 18
- Slide 19
- Slide 20
- Slide 21
- Slide 22
- Slide 23
- Slide 24
- Slide 25
- Slide 26
- Slide 27
- Slide 28
- Slide 29
- Slide 30
- Slide 31
- Slide 32
- Slide 33
- Slide 34
- Slide 35
Wyszukiwarka
Podobne podstrony:
Cykl życia branży wykład 2
Cykl życia branży
Cykl życia branży wykład 2
ITIL v3 Cykl życia usług IT
Cykl życia przedsiębiorstwa
11 Cykl zycia przedsiebiorstwai Nieznany (2)
cykl życia produktu
Cykl życia produktu
cykl zycia produktu(8 str), Ekonomia
CYKL ŻYCIA RODZINY, pedagogika
Cykl życia systemu informatycznego, WSB Bydgoszcz, Informatyka wykłady
cykl zycia produktu(1), Inż + seminarium
więcej podobnych podstron