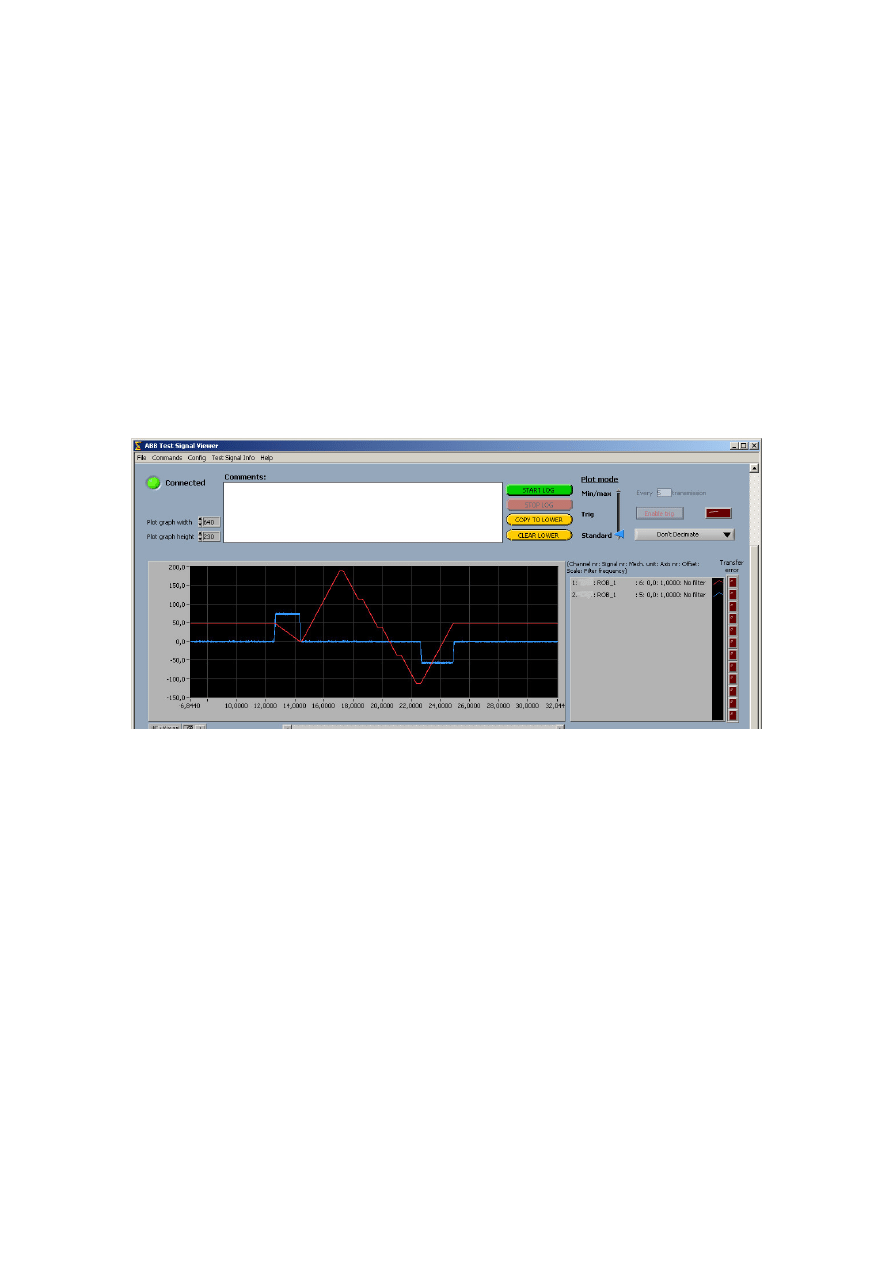
ABB Test signal viewer
Version 1.3
Getting started
This section describes the basic functionality of the ABB Test Signal Viewer-
software.
Configuration
In the
Config menu, choose Remote Server Settings. Enter IP address of the
remote machine (the robot) in the IP Address field. The port number should
always be 4011.
Connection
In the
Commands menu, choose Connect. The green Connected light is lit
when connection works.
Define Test Signals
In the
Commands menu, choose Define Test Signal.
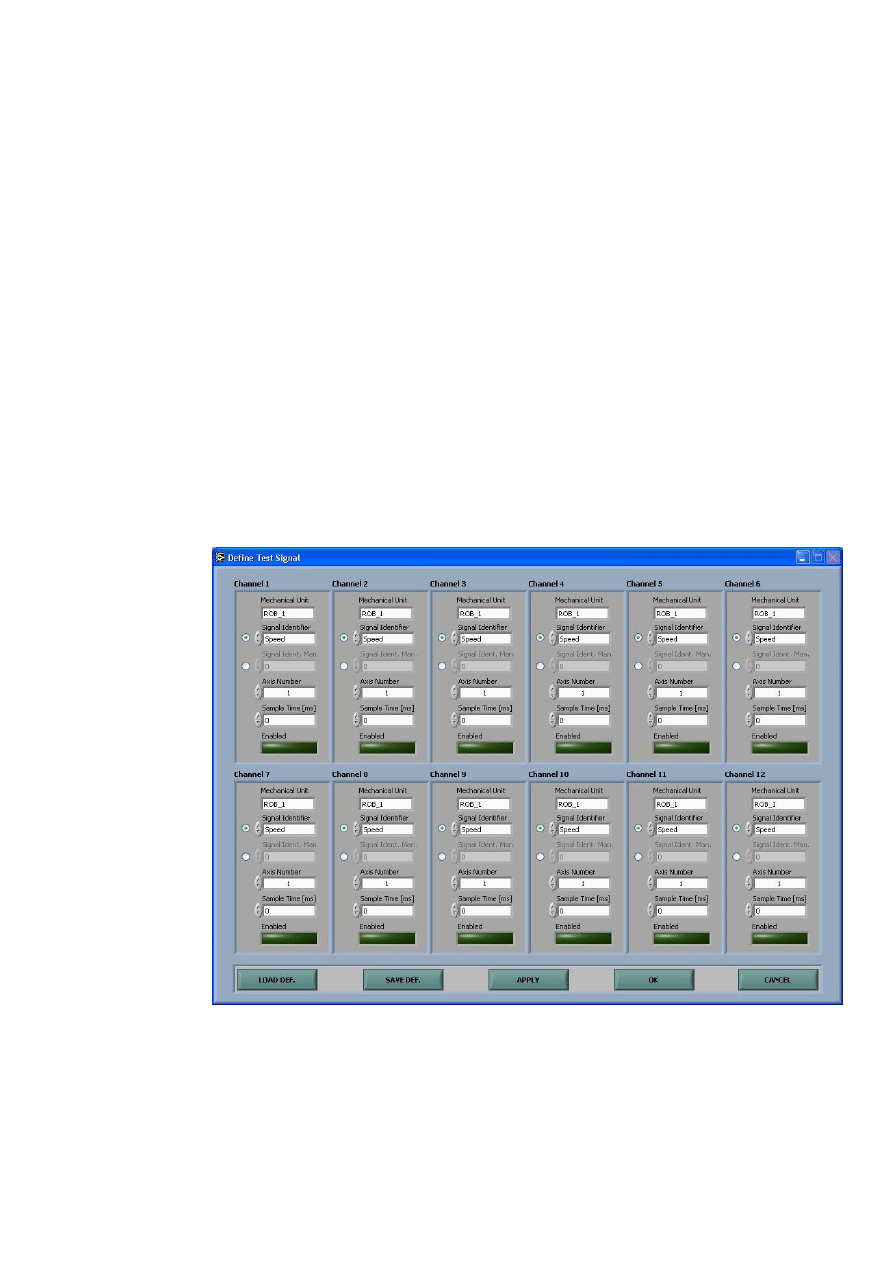
The define Test Signal window allows the operator to define 12
Individual channels. Each channel setup consists of six parameters.
Enter name of Mechanical Unit.
Note! Only digital_input_1 and 2 are available on all Mechanical Units.
Other signals only on external axes (TCP-robots are locked).
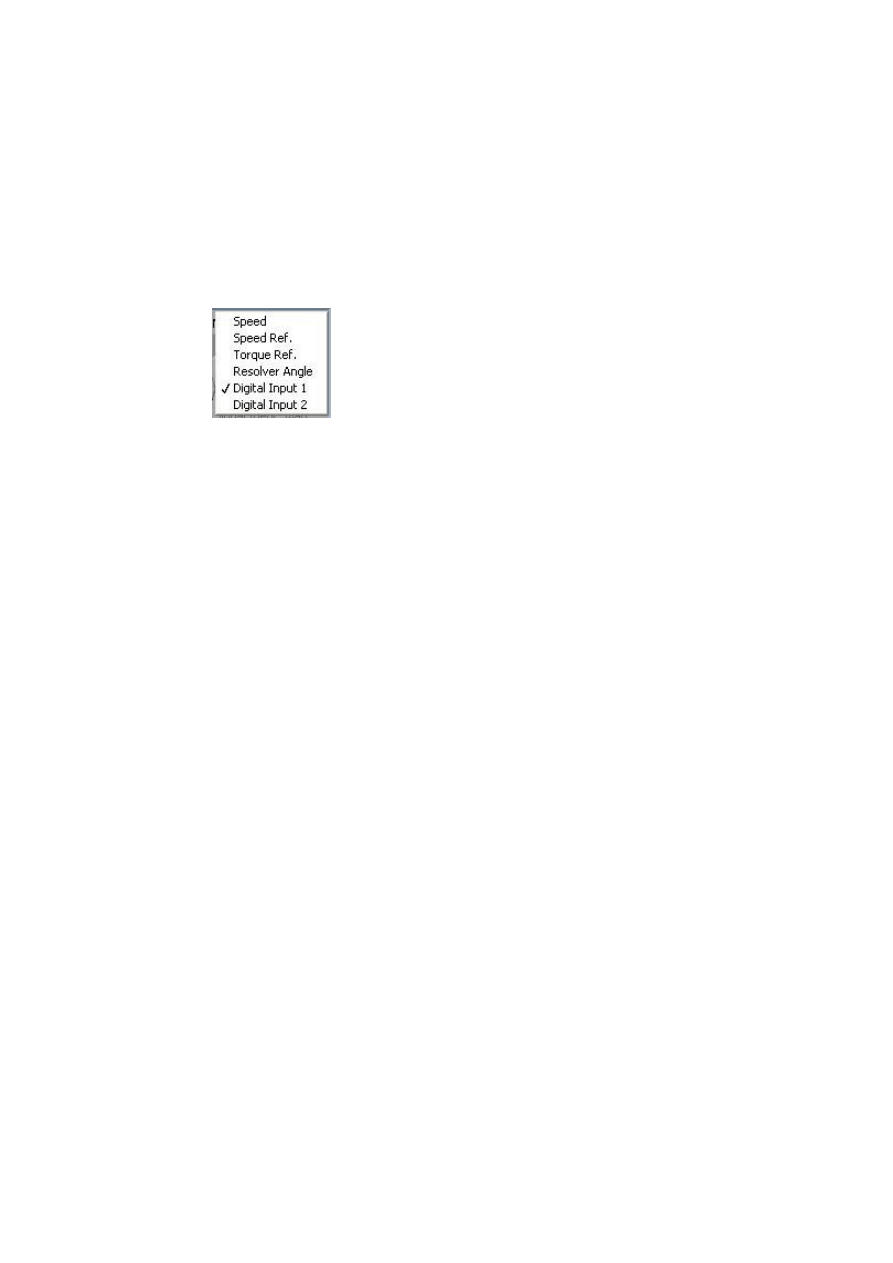
Select Signal identifier in list (see below) or by entering code manually.
The radio button to the left must be changed first.
Select Axis number (1-6).
Enter sample time in ms (0,00 corresponds to fastest sampling rate, i.e.
0.504ms). The actual sample time is adjusted to the nearest multiple of the
fastest rate.
Note: The sample time affects only how the signals are handled in the
controller. In the ABB Test Signal Viewer all data is padded to correspond to
the fastest possible sampling rate.
Enabled button shows if the signal should be enabled or not. Light green light
indicates that the signal should be enabled and a dark green light indicates
that the signal should not be enabled when the
Apply or OK button is pressed.
The operator can set the Enabled status by pressing the button.
The operator can store the current setup by pressing the
Save Def. button and
select a name for the definition file.
A stored definition file can be loaded by pressing the
Load Def. button.
By pressing
Apply all enabled channels will be defined but the Define Test
Signal window will stay active.
When all desired channels have been defined, press
OK and the program will
return to Main window.
By pressing the
Cancel button the program will exit to the Main Window
without defining any signals.
If the definition of a signal is not successful a warning message will appear
and the state of the signal will be set to disabled (dark green).
Data logging
When the desired channels have been defined data logging can be started by
pressing
Choose which channels to log and press OK to begin the logging.
Basic plot handling
Both plot areas can be manipulated using the tool below each area:
The buttons marked X and Y each adjusts the axis interval to the present
signal sizes. It is also possible to manually set the interval ends by marking
the number and type the desired value. The button can be locked in pressed
position by clicking the handle to the left of the button. When the button is
locked the axis interval is automatically adjusted and it is not possible to
change values manually.
Stop logging
Logging is stopped by pressing
Using the lower plot area
After logging in standard plot mode,
the button
can be used to copy the current plot of the upper
plot area to the lower where it can be examined in detail by using the different
zooming and scaling tools, especially the line following function. The lower
plot area is also useful for comparing two different events since it can be used
to store an interesting plot and start another in the upper area. The lower plot
area is cleared by pressing the button
Change data logging speed
The interval in which the samples are logged can be changed in the list in the
upper right corner of the window.
Removing defined test signals
One or all test signal channels can be removed using
Remove One Test
Signal and Remove All Test Signals in the Command menu respectively.
Parameter settings
A number of settings can be made for each channel using Set Offset, Scale
and Low pass Filter in the
Config menu.
Offset moves the zero level of the signal up or down according to the value
set.
Scale multiplies the signal with the value set.
Low pass Filter Freq. defines the cut frequency of the low pass filter.
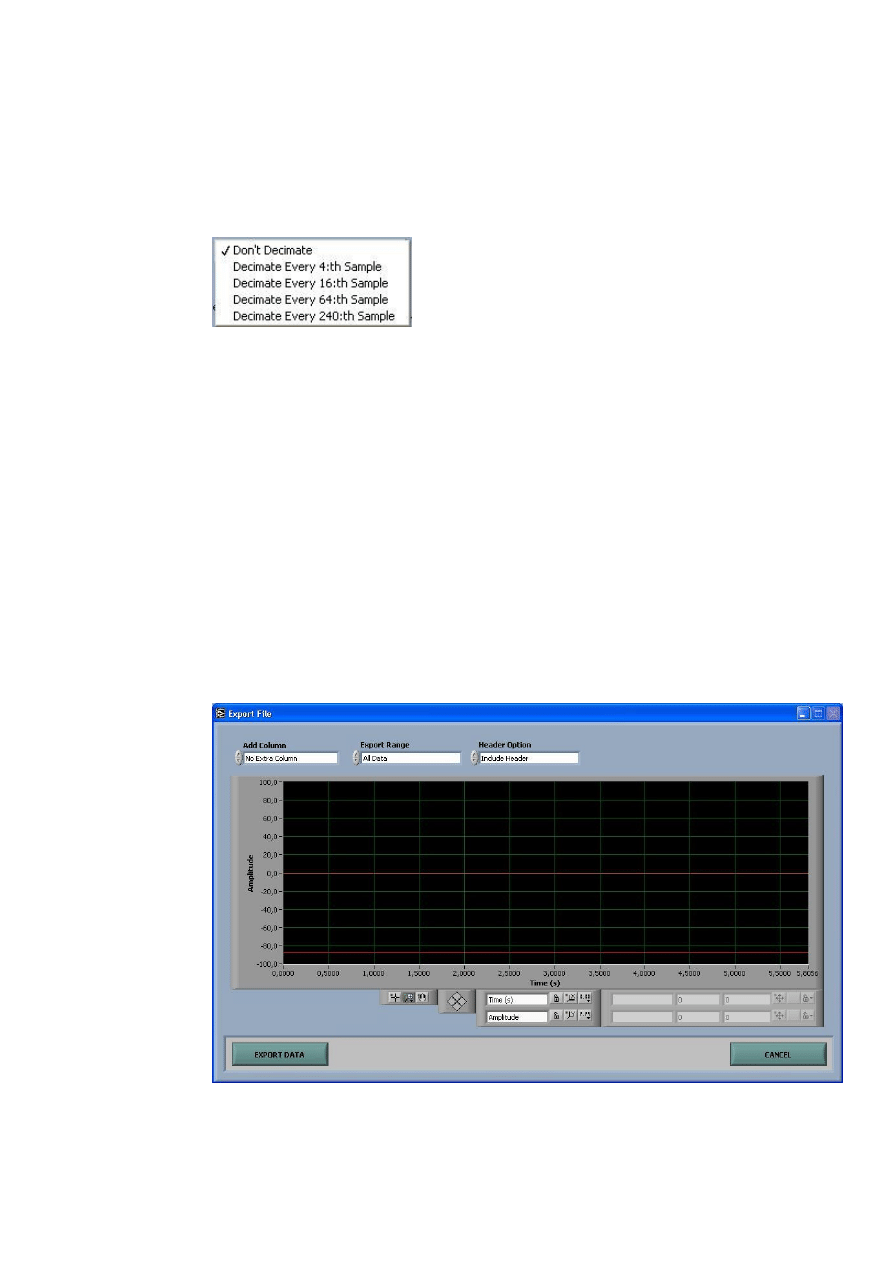
Export data

After the logging has been stopped, the present buffer or a part of it can be
exported to a text file by choosing Export Log in the
File menu.
The Export File window shows the present buffer data in a graph and allows
the operator to select data interval and also some export file configuration
options.
Add Column control lets the operator add an extra column in the export file
with either time or sample number information. By default no extra column is
added.
Export Range control has three options: All Data, Between Cursors and
Visible in Graph. A short description of each setting follows:
All Data – All data in buffer is saved.
Between Cursors – The data between the two cursors is saved
Visible in Graph – Only data currently visible in the graph is stored.
Note! Cursors are only visible when Between Cursors option is selected.
Header Option allows the operator to select if a text header with signal
information should be included or not in the export file. By default a header is
included.
Export Data starts the export of data to file.
Cancel button exits the Export File window and returns to the Main window.
Reference manual
This chapter contains a description of all the choices in the menus and guides
to some of the features that are not described in the program overview above.
All necessary settings, for instance choice of plot-mode, must be made
before the logging is started.
Menu functions
Menu: File
Open...
Loads data that has previously been saved in .dat-format. The signals can
then be studied using the plot-handling tools of the program.
Save Signals...
Saves data in .dat-format which can be reloaded into the plot window. This
format can not be used to export data usable in other programs.

Page setup...
Allows normal configuration of printer and print format.
Print window...
Prints the main window on an available printer. Cannot be used during
logging of data.
Export log
Creates a file in text-format with data from the logged channels arranged in
columns.
Exit
Quits Test Signal Viewer.
Menu: Commands
Connect
Establishes a connection with the remote server defined in Remote Server
Settings.
Disconnect
Disables the connection with the remote server.
Define Test Signals
Defines the test signal, mechanical unit and axis that are to be assigned to a
certain channel.
Enumerate All Test Signals
Lists the test signals that are already defined. If the desired signals are
among them they can be assigned to a channel by marking them here.
Remove One Test Signal
Removes the test signal from the specified channel.
Remove All Test Signals
Removes all test signals.
Menu: Config
Remote Server Settings
Defines the IP-address of the remote server.
Set Offset, Scale and Low pass Filter
Offset moves the zero level of the signal up or down according to the value
set.
Scale multiplies the signal with the value set.
Low pass Filter Freq. defines the cut frequency of the low pass filter.
Set Trig
Defines the properties of the trigger, i.e. which channel, the level and the
slope to trig from. It is also possible to set a post trig time, i.e. the time from
the trig to the actual stop.
Show Samples on x-axis
When marked, the x-axes in the plot windows are samples.
Menu: Test Signal Info
General information about the defined channels.
Menu: Help
About Test Signal Viewer
Information about the software.
Plot handling
Window size
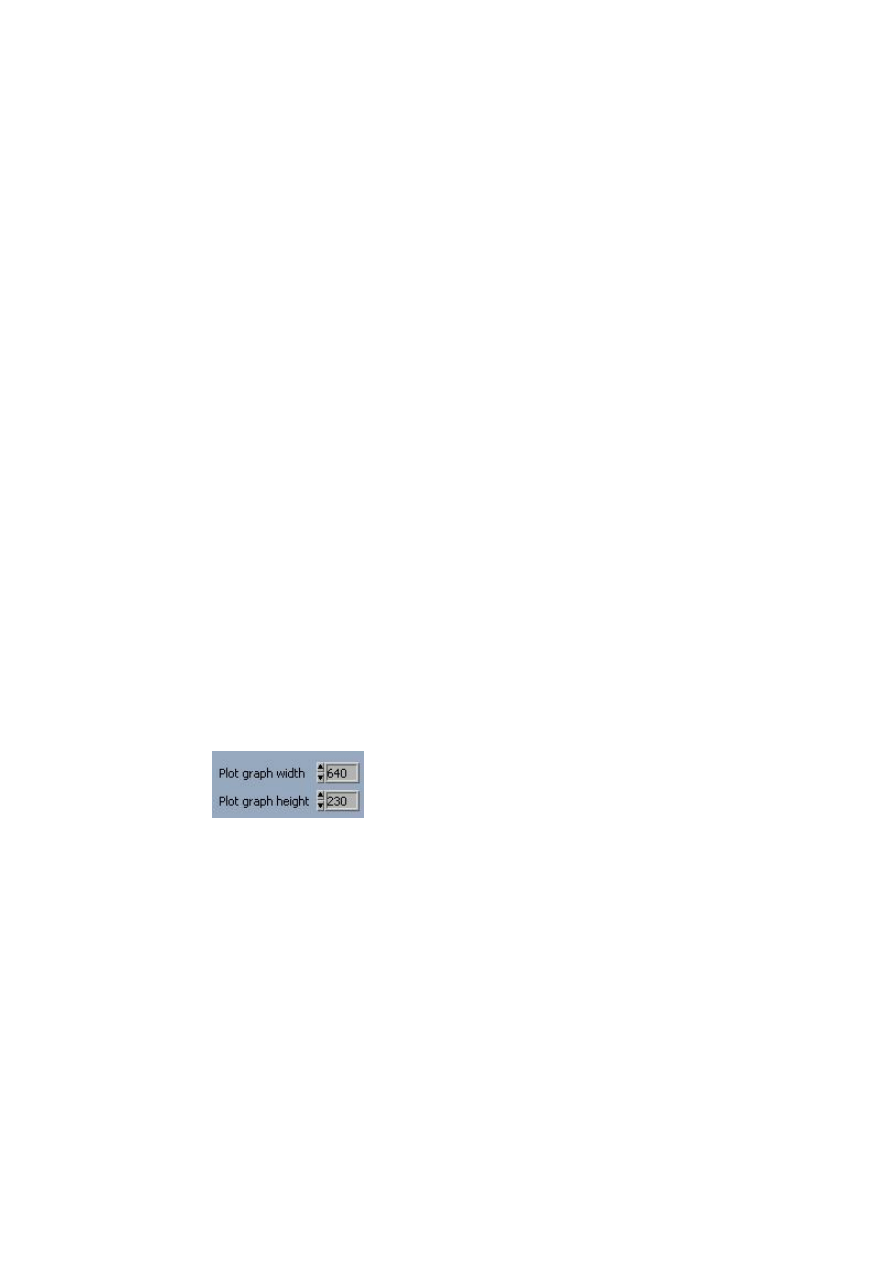
The size of the upper plot area can be changed using the
Plot width and the
Plot height buttons in the upper left part of the window. The choice affects
both areas, keeping them equally sized.
Zooming
There are a number of tools available for zooming and magnification of
certain parts of the plot. The tools are the same for the two plot areas but it is
only the upper plot area that has a scroll bar, making it possible to study the
entire plot in the magnified view. The lower plot area has a plot following
function that is described in detail below.
The different magnification choices are shown and described here:
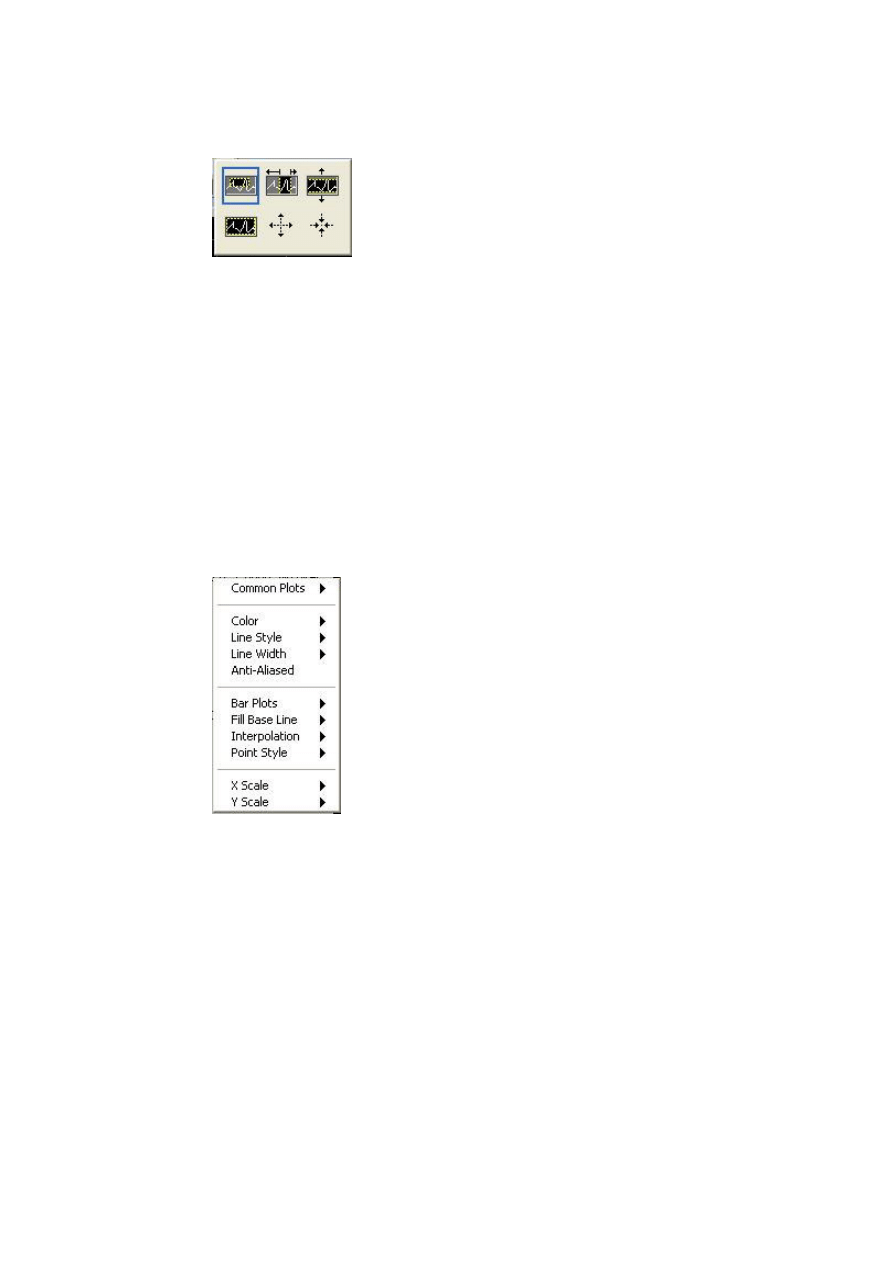
1. Magnification of a desired part of the plot.
2. Magnification of a desired vertical part of the plot.
3. Magnification of a desired horizontal part of the plot.
4. Return to the previous magnification level.
5. Zoom in.
6. Zoom out.
The hand symbol below the magnification glass is used to move the plot in
the window. The plus-symbol can be used to move the hair-cross of the line-
following function (see below).
Line manipulation
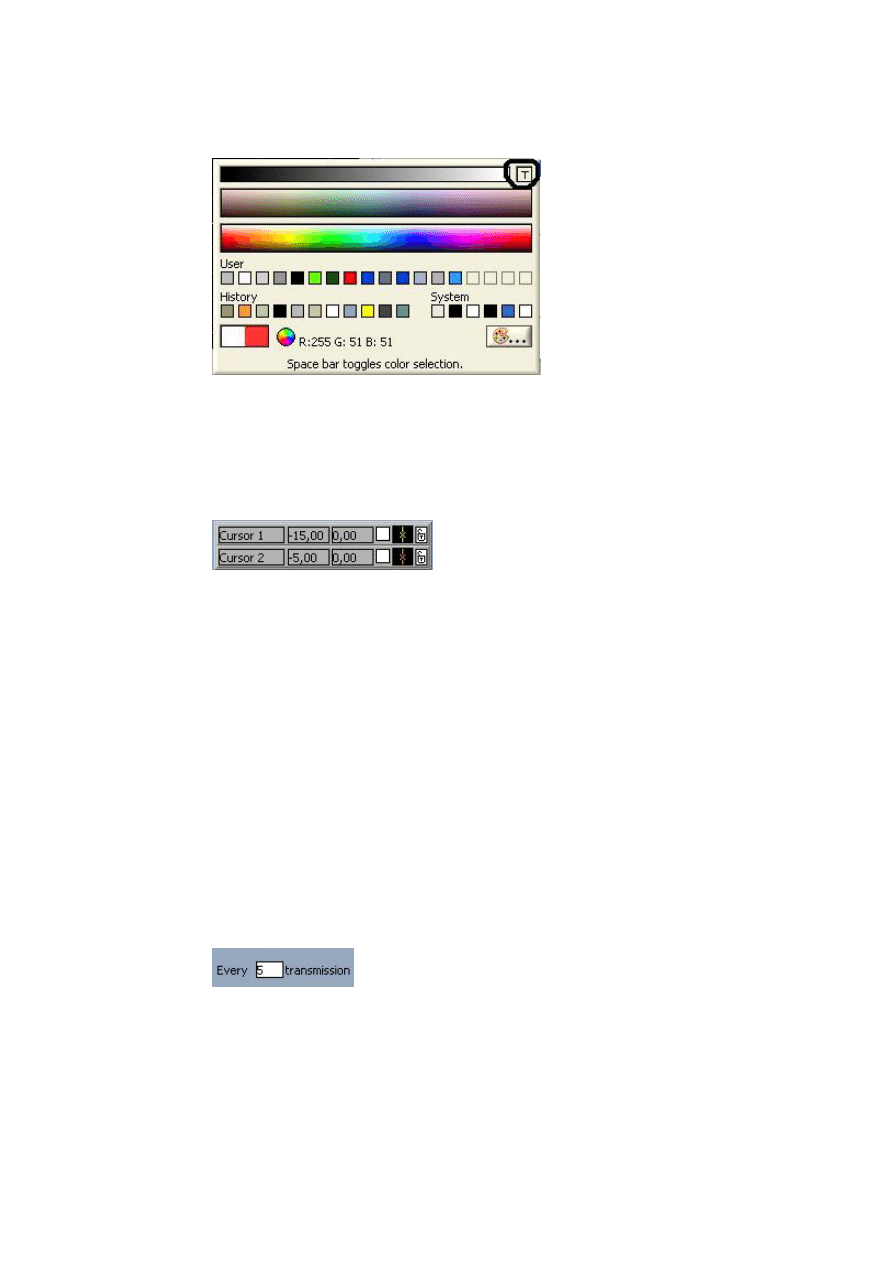
By clicking somewhere on one of the channel identification lines right of the
plot a line manipulation menu appears. This can be used to change the visual
appearance of the channel, including line width and line colour. One
especially useful feature is the possibility to temporarily hide one channel by
assigning a transparent colour, T, in the colour palette.
The line can be made visible again by giving it another colour.
Line following function
This function is only available in the lower plot area and can be used to locate
the coordinates of a certain point. Two cursors are available and the function
is activated by clicking this area in the bottom of the window:
Clicking the padlock symbol allows the user to determine whether the cursor
should be locked to a plot or to be free, and which channel it should be
associated with. The hair cross symbol left of the padlock is used to determine
the visual appearance of the cursor. Clicking one of the white boxes activates
that cursor, making it possible to move it with the left/right-arrows to the
right. Both cursors can be active simultaneously and they can be deactivated
by clicking the box again. The values of the x- and y-coordinates are
displayed in the two boxes in the middle and it is also possible to move to a
desired point by typing a value in the box.
The up/down-arrows to the right can be used to change which channel the
active cursor is associated with, moving up or down the list of channels in the
padlock menu.
Plot Min & Max
This function uses the lower plot area to plot the highest and lowest value
within an interval set using the button:
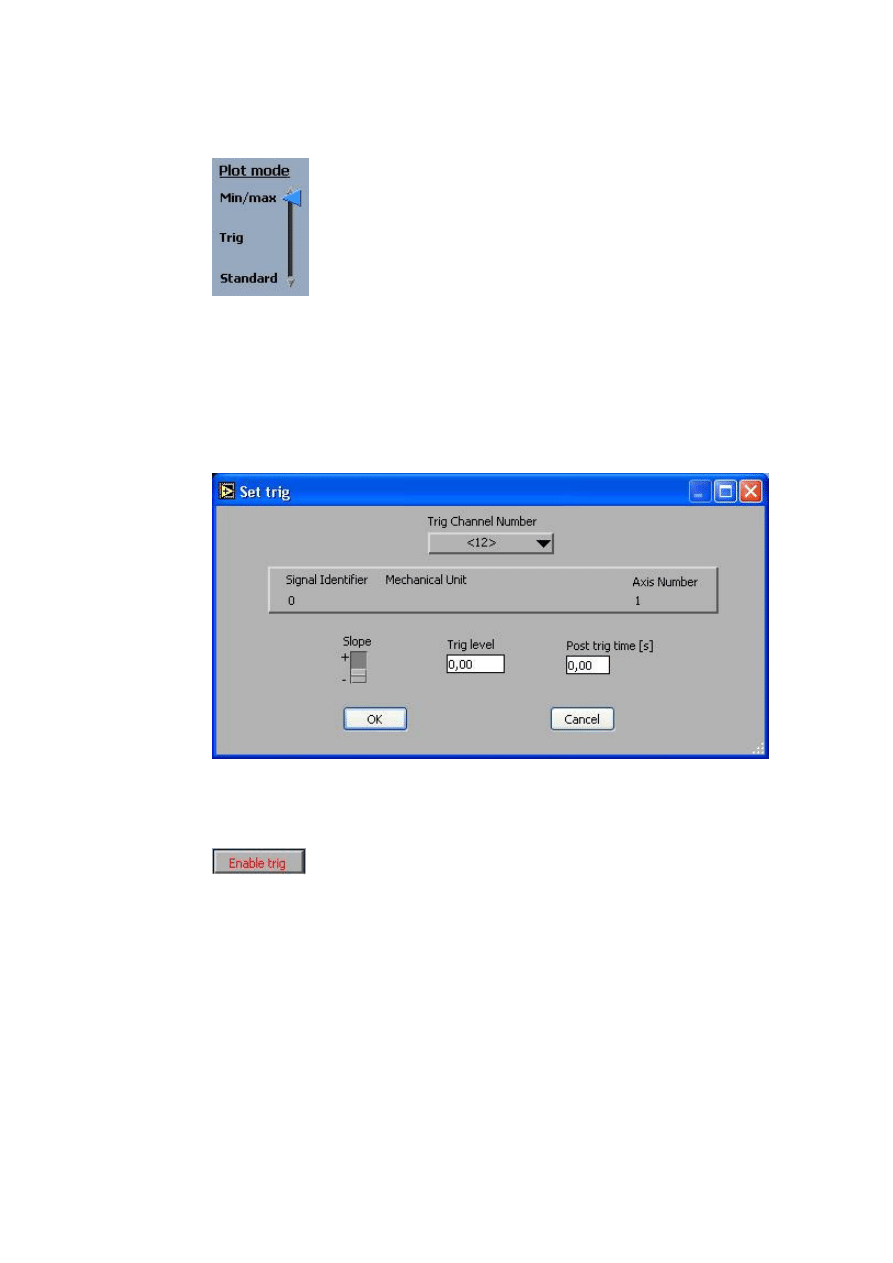
Remember to set the Plot mode-handle in Min/max position before
starting the log, as shown below.
Trig function
Using the trig-function it is possible to stop the logging a desired time after a
certain event has occurred. This might be useful if a specific behaviour is to
be observed.
Set Trig in the
Config menu is used to define the properties of the trig, i.e.
which channel, slope and level to trig on and a possible post trig time.
After the properties have been set, pressing the button marked
Enable trig
activates the trig function and will change its label to
Disable trig. When
activated, the logging is stopped when the conditions defined in the Set Trig
window are met. The trig can be deactivated by pressing the button again.
After the trigged stop, the data of the upper plot data is copied to the lower
plot area.
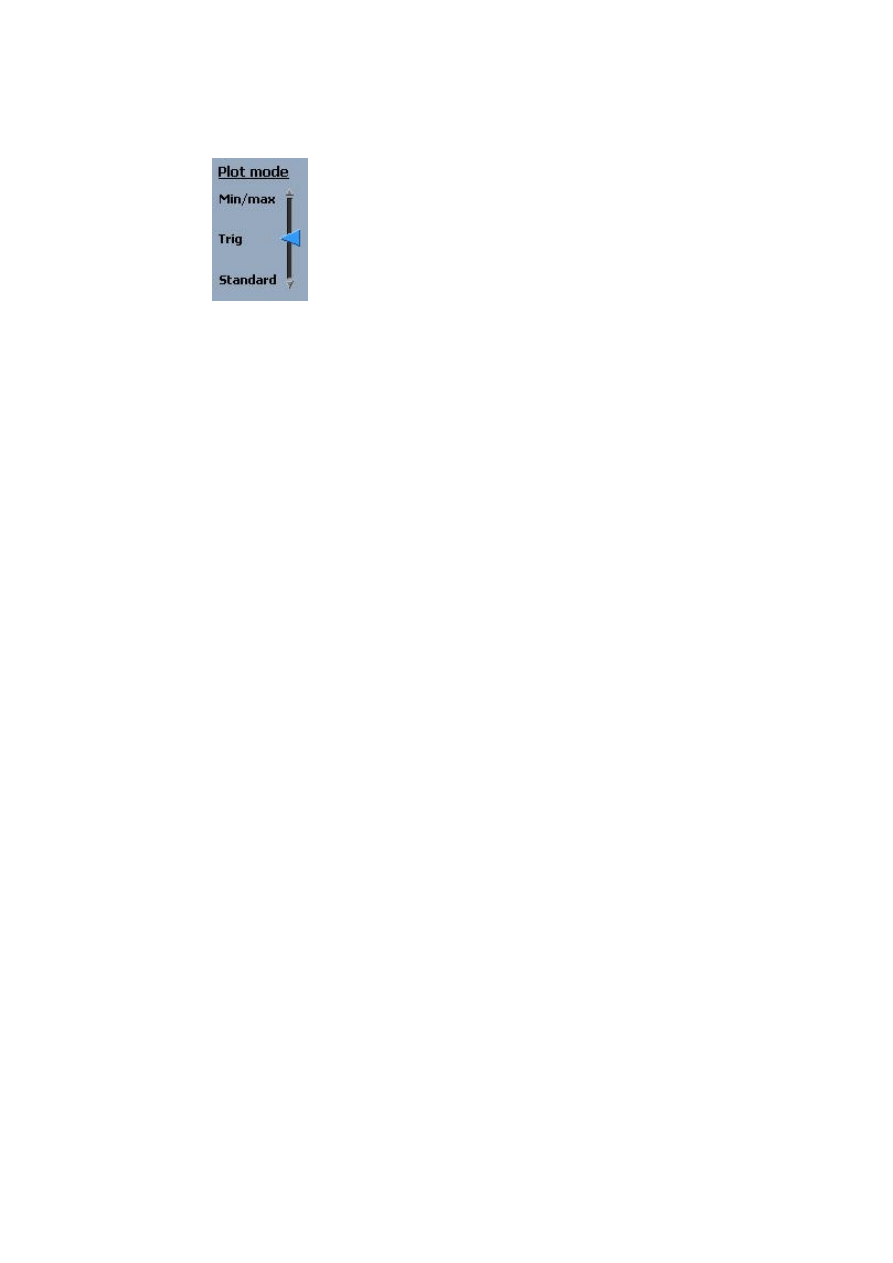
Before starting a logg where the trig is to be used, remember to set the
Plot mode-handle in trig-mode, as shown below.
Comments
In the white area in the upper part of the screen it is possible to add
information about the present plots before printing it.
Wyszukiwarka
Podobne podstrony:
Constant darkness is a circadian metabolic signal
Differential Signals, Rules to Live By
Novus PC Viewer 1 0
differential signals
(ebook pdf) Mathematics Statistical Signal Processing WLBIFTIJHHO6AMO5Z3SDWWHJDIBJQVMSGHGBTHI
seamaster mpzzm signals
pisanie 16 Transition signals
ARRL QST Magazine Clean up Signals with Band Pass Filters (part 1) (1998) WW
Impressive Signals From Demark
Add a signal strength display to an FM receiver IC
HTC ExtUSB headset pinout and signals @ pinouts
1Introduction Signal Processing Haslerid 19014 (2)
Distress Signals(1)
Signal Generator
MetaStock Trading System Commodity Channel Index CCI Buy and Sell Signals
Marconi TF1066B1 FM Signal Generator Datasheet
3 Analyze and Save a Signal pl Nieznany
Intercast Internet kostenlos ueber TV Signal
9 Signal Filtering
więcej podobnych podstron