
Torrefied versus conventional pellet production – A comparative study
on energy and emission balance based on pilot-plant data and EU
sustainability criteria
D. Agar
, J. Gil
, D. Sanchez
, I. Echeverria
, M. Wihersaari
Department of Chemistry, University of Jyväskylä, P.O. Box 35, 40014 Jyväskylä, Finland
Process Chemistry Centre, Åbo Akademi University, Piispankatu 8, FI-20500 Turku, Finland
National Renewable Energy Centre (CENER), C/Ciudad de la Innovación 7, 31621 Sarriguren, Navarra, Spain
Department of Chemical Engineering, Åbo Akademi University, P.O. Box 311, 65101 Vaasa, Finland
h i g h l i g h t s
Presents pilot-scale torrefaction data using rotary-drum reactor.
CO
2
emissions and energy balance of torrefied vs. conventional pellet production.
EU sustainability criteria methodology (RED) used in calculations.
Torrefied pellets CO
2
emissions 45 g MJ
1
with 77% emission savings in co-firing.
Torrefied and conventional pellets generate similar CO
2
emissions.
a r t i c l e
i n f o
Article history:
Received 6 February 2014
Received in revised form 1 August 2014
Accepted 4 August 2014
Available online 4 September 2014
Keywords:
Torrefaction
Environmental impact
Emissions
Wood pellets
Co-firing
RED
a b s t r a c t
Torrefaction is an emerging technology which enables greater co-firing rates of biomass with coal. To
date however there has been a lack of real production data from pilot-scale torrefaction plants. Without
such data any environmental benefits of torrefied pellet production are difficult to quantify.
In this study data on consumable inputs from a semi-industrial torrefaction plant and the physical
properties of produced pellets are used to analyse energy input and air emissions of torrefied pellet pro-
duction and product transport. EU sustainability criteria are used to compare CO
2
-equivalent emissions
from torrefied and conventional pellet production starting from harvesting of logging residues to end use
of co-firing the pellets with coal. A production scenario is examined in which raw material supply and
production takes place in Finland with co-firing in Spain. The influence of transport distance (by lorry,
rail and ship) on environmental impact is analysed for European and representative North American pro-
duction sites.
Results indicate about 4.5 GJ of energy is consumed for each tonne of torrefied pellets compared to
3.3 GJ for conventional pellets; representing 23% and 21% of the energy content of the pellets respec-
tively. If electricity from renewable sources can be used, the fossil fuel fraction of input energy can be
reduced to 37% and 41% respectively. Production and use of both pellet types in co-firing have similar
environmental impact generating CO
2
-equivalent emissions from electricity in the range 43–45 g MJ
1
.
An emission savings of 77% can be realised by co-firing torrefied pellets with fossil coal. Pellet production
amounts correspond to 4.3 and 4.2 MJ generated electricity for each kilogram of feedstock (dry mass) and
co-firing ratios (energy basis) in the range of 1.4–1.8%.
If only one mode of product transport is used torrefied pellet production and co-firing is found to gen-
erate fewer emissions than its conventional counterpart when transport distance is more than 400 km
(lorry), 1850 km (rail) and 25,500 km (ship).
Ó 2014 Elsevier Ltd. All rights reserved.
http://dx.doi.org/10.1016/j.apenergy.2014.08.017
0306-2619/Ó 2014 Elsevier Ltd. All rights reserved.
⇑
Corresponding author at: Department of Chemistry, University of Jyväskylä, P.O.
Box 35, 40014 Jyväskylä, Finland.
E-mail address:
(D. Agar).
Applied Energy 138 (2015) 621–630
Contents lists available at
Applied Energy
j o u r n a l h o m e p a g e : w w w . e l s e v i e r . c o m / l o c a t e / a p e n e r g y

1. Introduction
The use of solid (renewable) biomass fuels is a growing trend by
which heat and power production can be made more sustainable.
Fossil coal however continues to be a widely used fuel in the
energy sector because of economics, existing power plant design
and infrastructure. Direct co-firing of biomass with coal has poten-
tial in significantly reducing net carbon dioxide emissions. Direct
co-firing assumes the fuel is mixed with coal upstream of coal
feeders. The fuel mix is pulverised in existing coal mills and for-
warded to the burners. This is recognised as the simplest method
of co-firing and also is seen as the cheapest option in terms of cap-
ital investment
. With untreated biomass co-firing is practically
limited to 5–10% (energy basis) due to unfavourable properties of
biomass; poor energy density, high moisture content and fibrous
nature
.
Wood pellets made from by-products of the wood processing
industry have been used in co-firing. Their production in Europe
is a well-established industry with inland production at some
12 million tonnes in 2010. Large amounts of wood pellets are
already imported from North America to meet growing European
demand. Based on recent estimates a 5% replacement of coal
(energy basis) with wood pellets at European coal plants would
require an equivalent annual production of 33 million tonnes
.
1.1. Torrefaction
Recently, there has been great interest in torrefaction which is a
roasting process carried out in the absence of oxygen. After torre-
faction woody and agro biomass have properties a step closer to
fossil coal. Improved properties include a higher calorific value,
lower equilibrium moisture content
and improved friability.
Additionally, pellets made of torrefied biomass – herein referred
to as torrefied pellets – have a greater volumetric energy density
than those of untreated feedstock. The process and expected
environmental benefits of torrefied biomass have been described
elsewhere
and available experimental data on some key prop-
erties for co-firing applications have been compiled
.
If torrefaction technology is widely adopted it will bring
changes in the way biomass resources are utilised. For example,
high-quality wood feedstock may find better use in torrefied pellet
production than conventional. Consequently greater amount of
pellets and therefore biomass could end up at coal power plants
due to the enabling of higher co-firing rates.
Several different torrefaction reactor technologies are under
development at pilot-scale plants throughout Europe and America
but at present there is a lack of semi-industrial production data
about torrefied pellets. Without production data on consumable
inputs and heat and mass balances, the environmental impact of
Nomenclature
A
annual logging residue harvest area (ha a
1
)
E
total CO
2
-equivalent emissions from the production of
the fuel before energy conversion (g)
EC
el
total CO
2
-equivalent emissions from the final energy
commodity, that is electricity (g MJ
1
)
EC
F(el)
total CO
2
-equivalent emissions from the fossil fuel com-
parator for electricity, 198 (g MJ
1
)
e
ec
emissions from the extraction or cultivation of raw
materials (g)
e
l
annualised emissions from carbon stock changes caused
by land use change (g)
e
p
emissions from processing (g)
e
td
emissions from transport and distribution (g)
e
u
emissions from the fuel in use (g)
e
sca
emission savings from soil carbon accumulation (g)
e
ccs
emission savings from carbon capture and geological
storage (g)
e
ccr
emission savings from carbon capture and replacement
(g)
f
CH4
methane formation from feedstock (kg t
1
)
f
loss
dry matter loss (%)
G
useful energy gain (unitless)
K
annual pulverisation energy use at product moisture
content (kW h a
1
)
k
specific pulverisation energy at product moisture con-
tent (kW h t
1
)
L
FI
maximum allowed lorry load in Finland (t)
L
ES
maximum allowed lorry load in Spain (t)
l
feed
lorry transport distance of feedstock (km)
l
prod
lorry transport distance of product (km)
l
ship
shipping distance of product (km)
M
feed
moisture content of feedstock, logging residue chips (%)
M
prod
moisture content of product (%)
m
feed
annual feedstock use (t a
1
)
m
feed,d
annual feedstock use, dry basis (t a
1
)
m
torr,d
additional feedstock mass through torrefaction, dry ba-
sis (t a
1
)
N
res,d
dry mass distribution of logging residues (t ha
1
)
annual production capacity at product moisture content
(t a
1
)
annual thermal output of produced fuel (MJ)
input
total primary energy input from production of fuel
(kJ t
1
)
output
thermal energy output of produced fuel (kJ t
1
)
gr,prod,d
gross calorific value of product at constant volume on
dry basis (MJ kg
1
)
net,res,d
net calorific value of logging residue chips on dry basis
(MJ kg
1
)
net,prod,M
net calorific value of product at constant pressure at
moisture content M (MJ kg
1
)
Renewable Energy Directive of the European Union
l
diesel consumption lorry (L t
1
km
1
)
rail
diesel consumption shipping (L t
1
km
1
)
res
diesel consumption, road-side chain (L ha
1
)
ship
diesel consumption shipping (L t
1
km
1
)
el
CO
2
-equivalent emission savings from electricity gener-
ated from solid biofuel
annual volume of feedstock (m
3
a
1
)
w(H)
d
hydrogen content in dry fuel (%)
w(N)
d
nitrogen content in dry fuel (%)
w(O)
d
oxygen content in dry fuel (%)
annual net electricity generation (MJ a
1
)
el
upgrading electricity consumption (kW h a
1
)
H2O
upgrading water consumption (m
3
a
1
)
ng
upgrading natural gas consumption (kW h a
1
)
N2
upgrading nitrogen consumption (kg a
1
)
logging residues potential (m
3
ha
1
)
E
energy yield of torrefaction (%)
m
mass yield of torrefaction (%)
el
electrical efficiency, defined as the annual electricity
produced divided by annual fuel input
feed
bulk density of logging residue chips (kg m
3
)
prod
bulk density of product (kg m
3
)
energy density of product (GJ m
3
)
622
D. Agar et al. / Applied Energy 138 (2015) 621–630

the technology can only be estimated based on the properties of
torrefied materials found in laboratory studies
which in no
way reflect the technical feasibility of reactors.
1.2. Feedstock supply in Europe
Even a conservative estimate of blending 20% torrefied biomass
with coal in European plants would translate to an annual produc-
tion of over 100 million tonnes. Inland feedstock demand would
necessarily lead to greater utilisation of other biomass resources.
Understandably torrefaction has raised concerns that biomass
resources outside of Europe may be utilised in order to realise
emission reductions within the Union. For example, torrefied pellet
production could take place in South America or Africa where
feedstock is cheaper, more plentiful and wages lower. However,
this would not comply with the other objective of EU energy
policy; to secure inland sources of energy.
1.3. Logging residues
Extractable logging residues (tree tops and branches) exist in
large volumes in Finland having an estimated annual volume
(2000) of at least 10 million cubic metres
– or about four
million tonnes per year. This figure is based on the assumption that
residues amount to 15% of stem wood mass for coniferous trees
and 10% for deciduous
. Logging residues are already widely har-
vested and used in Nordic countries at grate-fired and fluidised-
bed power plants both of which are designed for heterogeneous
wet solid fuels but this feedstock has also been shown to be a suit-
able raw material for pellet production
. Additionally, studies
suggest that the utilisation of residues from Nordic forests is more
environmentally beneficial than leaving them on the forest floor
and can lead to maximum benefit when offsetting fossil coal use
at power plants
1.4. Environmental impact assessment
The aim of this environmental impact assessment is to estimate
two quantities: the use of energy input for an operation known as
primary energy use and the amount of generated CO
2
-equivalent air
emissions. The Renewable Energy Directive (RED) provides
sustainability criteria by which alternate production methods can
be compared based on their CO
2
-equivalent air emissions to the
environment
. The use of these criteria for determination of
emissions from two different products from the same raw material
negates the need of analysing the entire life-cycle of both products.
Rather it simplifies the comparison by focusing on relative differ-
ences between two products. This is sensible for well-established
industries such as the wood pellet industry. In any case direct com-
parison of results in literature is not always possible due to differ-
ences in chosen system boundaries. As a newly emerging
technology torrefied pellet production has not been treated with
RED criteria based on real production data.
1.5. Environmental impact of wood pellets and logging residue chips
Environmental impact assessment has previously been carried
out on conventional wood pellets
. Magelli et al. find that pri-
mary energy input for Canadian wood pellets produced in British
Columbia and delivered to Sweden is 7.2 GJ per tonne and that
CO
2
-equivalent emissions from their production and transport is
29 g MJ
1
. These figures assume feedstock material is used as a fuel
in the drying process. Over one third of input energy from Cana-
dian pellets stems from transatlantic shipping via the Panama
Canal to Stockholm and in total 39% of the energy content of these
pellets is consumed in their manufacture and transport
. If the
same pellets were used domestically the energy input could be
reduced to 4.6 GJ per tonne. Based on RED criteria and these values
the use of the pellets for strictly heating in Sweden would realise
an emissions saving of about 60% compared to coal (assuming a
boiler efficiency of 80%).
For comparison Nordic production (Sweden) of logging residue
chips is found to have an energy input range of only 0.4–0.5 GJ per
tonne
. Additionally chip production from loose (non-bundled)
residue collection required the lowest primary energy input (21–
27 kJ MJ
1
) of several studied production scenarios and generated
the least amount of CO
2
-equivalent air emissions (1.5–1.9 g MJ
1
).
The above values assume that the fuel’s full net calorific value
(LHV) can be realised in combustion
. This is often not the case
since residue chips have greater moisture content because they are
not typically dried like the feedstock used to make wood pellets.
When considering the difference between wood pellets and log-
ging residue chip production it is noted that the pellet production
study takes into account emissions and energy input from the final
felling of timber from which pellet feedstock is derived (including
the hauling of stem wood a distance of 110 km) whereas the above
residue chip production does not include this operation
1.6. Impact of torrefied pellet production from logging residues
The impact of using biomass in different co-firing pathways in
Alberta, Canada, has been studied. Two pathways of interest here
are those of conventional and torrefied pellets produced from log-
ging residues. In their work, Kabir and Kumar considered in-
province harvest, production and end use of these two pellet types
and evaluated impacts from the entire life cycle of the pathway.
They found that the total CO
2
-equivalent air emissions from direct
co-firing in electricity production were 68 and 47 g MJ
1
for
conventional and torrefied pellets respectively
. They also
calculate a net energy ratio (NER) of 1.6 and 1.1 for these two fuels
– indicating that the power generated over the lifetime of the path-
way is greater than the non-renewable primary energy input of the
fuel. Despite a modest product transport distance (500 km) their
results indicate that torrefaction as an upgrading process has a clear
beneficial impact. Although the Kabir and Kumar study is a recent
one (2011) their results depend on torrefied pellet properties and
production technologies which they acquired from an early proprie-
tary report on torrefaction
. More recent peer-reviewed studies
on torrefied pellet properties however have indicated that ideal
torrefied pellet properties are somewhat compromised due to the
limitations imposed by semi-industrial production. For example,
certain key properties such as the increase in calorific value, equilib-
rium moisture content, ability to pelletise and volumetric energy
density have been shown to be less favourable in produced torrefied
pellets
. Environmental performance of a fuel is strongly
dependent on these properties.
1.7. Purpose and scope of study
In this study data on consumable inputs from a semi-industrial
torrefaction plant and the physical properties of produced pellets
are used to analyse energy input and air emissions of torrefied
pellet production and product transport. EU sustainability criteria
are used to compare CO
2
-equivalent emissions from torrefied and
conventional pellet production starting from the harvest of logging
residues to end use in combustion. Pellet production utilises
Nordic logging residues as feedstock. In this scenario, pellets are
produced in the far north of the EU and transported to the south
where they are co-fired with coal for the production of electricity.
The production scenario considered herein is of interest because
it conforms to EU energy policy objectives by keeping production
of biofuels within the Union and by realising reductions in net
D. Agar et al. / Applied Energy 138 (2015) 621–630
623
carbon dioxide emissions from the energy sector. Moreover, the
transport distance used in this intra-European scenario is close to
the maximum within the present day EU.
By comparing the environmental impact of production of these
two pellet types the following research questions can be answered:
What is the environmental impact of torrefied pellet production
and use compared to that of conventional wood pellet production?
What magnitude of net emission savings can be expected from off-
setting fossil coal use with these fuels? Does the higher energy
density of torrefied pellets result in significant energy and emis-
sion savings via transport? How does product transport distance
by lorry, rail and ship affect total emissions in quantitative terms?
The economics of producing torrefied pellets will depend on a
number of technical and economic factors that are not addressed
in the present study but the consumable inputs of scaled-up pro-
duction are presented.
2. Methodology
The Spanish National Renewable Energy Centre (CENER) oper-
ates a Second Generation Biofuels centre (CB2G) which includes
a pilot-scale torrefaction facility. The facility, located in Aoiz, has
the capacity to process up to 500 kg h
1
of biomass feedstock
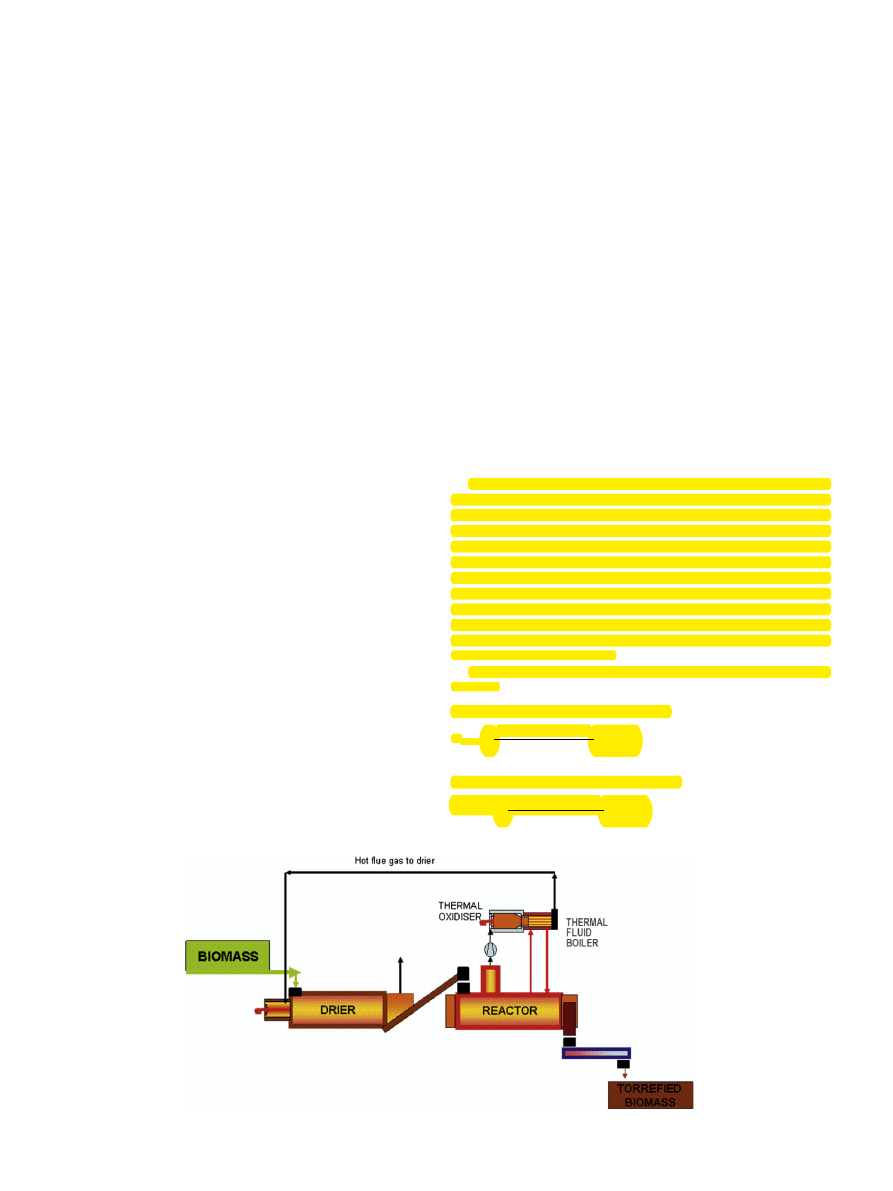
. CENER’s proposed torrefaction concept is shown in
.
The torrefaction process concept is heat integrated. The com-
bustible vapours generated in the torrefaction reactor are treated
in a thermal oxidiser taking advantage of energy in an attached
boiler to heat up the thermal fluid. To optimise reactor throughput,
it is convenient to dry the biomass before torrefaction. Flue gases
from the boiler at temperatures higher than 300 °C are fed to the
drier. Additional fuel could be necessary for drying, depending on
biomass moisture content and target torrefaction degree.
The core of the process equipment is the torrefaction reactor. It
is a cylindrical horizontal reactor with an agitator shaft and
attached elements of special design procuring axial transport char-
acteristic for all kind of biomass, radial product homogenisation
inside the reactor and excellent heat transfer conditions. The reac-
tor is capable of transporting biomass with low bulk density values
(from 50 kg m
3
and upwards) and high amounts of fines and dust
material, up to 89% in amount of fines (63.15 mm) and up to 62%
in dust content (<250
l
m) has been tested successfully. Reactor
heating is carried out indirectly through the hot reactor walls,
the actively heated shaft tube and the actively heated internal shaft
elements using thermal oil as heat transfer fluid.
The torrefaction reactor scale-up to industrial size is based on a
reactor model developed at CENER. The main features of the model
include:
Perfectly-mixed reactors are modelled in series. Product output
from one stage forms input of the next stage.
Torrefaction process is according to the kinetic model of Di Blasi
and Lanzetta
.
Kinetic parameters are obtained by thermogravimetric analysis
of studied feedstock.
Feedstock intra-particle temperature profiles are neglected (i.e.
particles are isothermal).
Heat of reaction is a function of reaction temperature (correla-
tions developed from pilot test energy balance).
Gas–solid heat transfer is neglected.
Mass and energy balance equations are solved for each stage.
The model calculates: conversion, temperature profile, gas tem-
perature and heat demand of the reactor.
Reactor heat losses are measured at pilot scale and extrapolated
to industrial scale based on correlation of the reactor
manufacturer.
A general mass and energy balance spreadsheet has been devel-
oped for process integration of drying, torrefaction and valorisation
of torrefaction gases. Modelling has been verified by pilot testing at
200–400 kg h
1
production rate. Data on torrefied pellet properties
and amount of consumable inputs have been obtained from
production data from the CENER CB2G pilot facility.
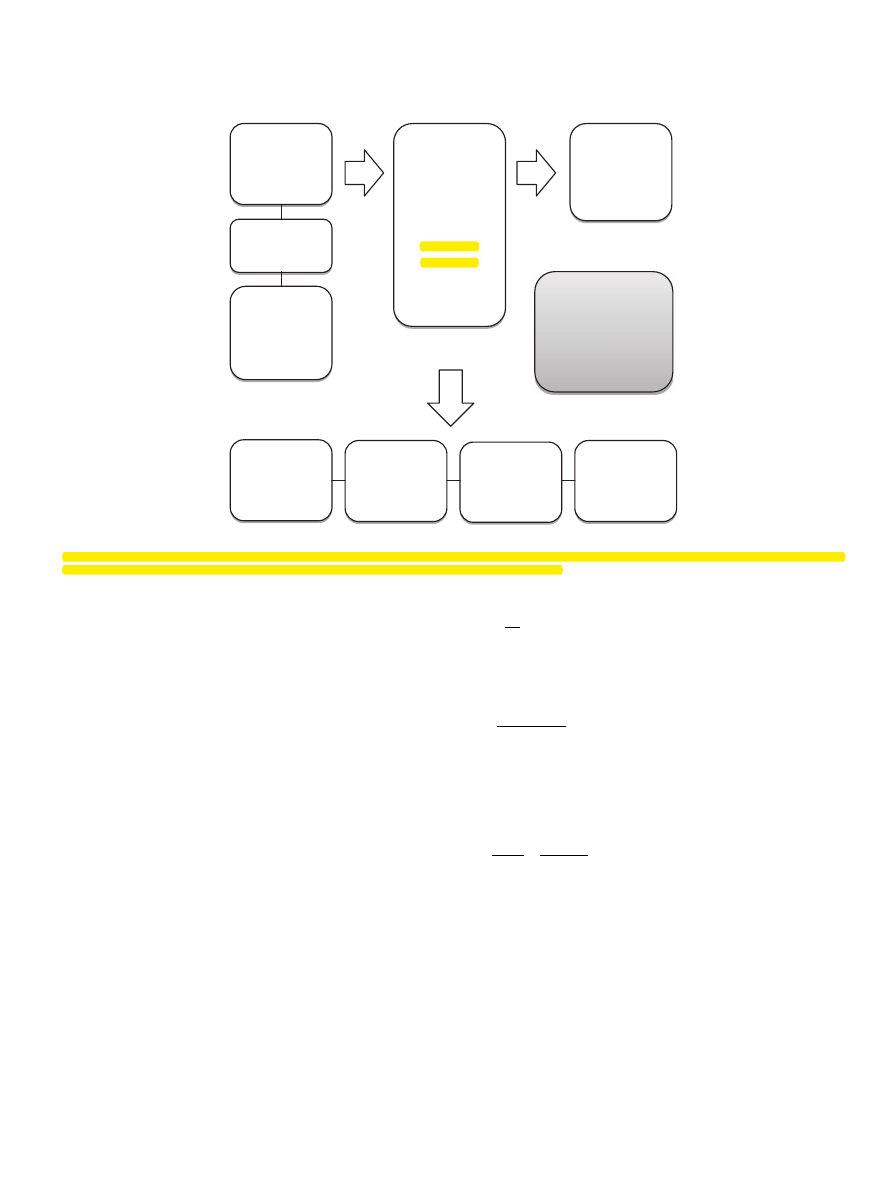
describes the thermal balance of scaled-up industrial pro-
duction (40,000 tonnes annually) of a torrefaction plant based on
the CENER concept and pilot-scale data. Thermal input and output
values are shown in
for annual plant operation of approxi-
mately 7724 h. The thermal efficiency of the process is equal to
the thermal output of the torrefied feedstock (28,485 kW) divided
by the sum of thermal inputs (33,224 kW). The thermal efficiency
of the process is 86%. Among other influencing factors, the thermal
efficiency of torrefaction depends directly on the net calorific value
of the product and inversely on the moisture content of feedstock.
Thermal losses stem from flue gas, product cooling, radiative heat
loss and ash amount to 14%.
The mass and energy yields of torrefaction are defined as
follows:
Mass yield of torrefaction ðdry basisÞ
Y
m
¼
mass of product
mass of feedstock
dry basis
Energy yield of torrefaction ðdry basisÞ
Y
E
¼ Y
m
GCV of product
GCV of feedstock
dry basis
WATER
VAPOUR
COOLING
Fig. 1. Schematic diagram of the torrefaction process concept under development at the Spanish National Renewable Energy Centre (CENER).
624
D. Agar et al. / Applied Energy 138 (2015) 621–630
Using these relations the mass and energy yields (dry basis) for the
system shown in
are 80% and 90% respectively.
Other inputs to the torrefaction process (not shown in
include nitrogen gas, used in purging conveying lines to minimise
ignition risks, air for drying and electricity used in process control,
conveying feedstock and pelletisation.
2.1. Energy and CO
2
-equivalent emission balance methodology
The Renewable Energy Directive 28/2009/EC (RED) contains a
sustainability scheme which covers biofuels used in transport
and bio-liquids used in other sectors such as electricity, heating
and cooling
. Since the time of its publishing the EU Commis-
sion has produced a report on a subsequent sustainability scheme
for the use of solid and gaseous biomass in electricity, heating and
cooling. A future directive on sustainability within this topic is
expected to be of this form and methodology. Therefore, this meth-
odology was chosen for use in the calculations of CO
2
-equivalent
emission balance herein. Annex I of the report (which parallels
Annex V of RED) contains the following three equations for the cal-
culation of emissions from the production of solid biomass fuels
Eq.
is used to calculate the total emissions E from the
production of the solid biomass fuel before energy conversion. This
is simply the sum of the emissions from harvesting (e
ec
), land-use
changes (e
l
), processing (e
p
), transport (e
td
) and utilisation (e
u
) with
emission savings from any soil carbon accumulation (e
sca
) or
carbon capture (e
ccs
and e
ccr
) subtracted.
E ¼ e
ec
þ e
l
þ e
p
þ e
td
þ e
u
e
sca
e
ccs
e
ccr
ð1Þ
The total emissions from the final energy commodity EC
el
(in this
case electricity) are found by dividing Eq.
by the efficiency of
electrical generation
g
el
at the plant where the fuel is combusted.
EC
el
¼
E
g
el
ð2Þ
The use of the biofuel results in an emission savings S
el
when com-
pared to the use of fossil fuel. The extent of this savings is found by
using Eq.
in which the fossil fuel comparator EC
F(el)
is used.
S
el
¼
EC
FðelÞ
EC
el
EC
FðelÞ
ð3Þ
When comparing the production of two or more fuels, the concept
of useful energy gain G is helpful. This value, found using Eq.
, is
the ratio of the thermal energy output q
output
extracted from the
produced fuel to q
input
the energy used in its production. This
relation is a function of q
net,prod,M
net calorific value of the fuel.
G ¼
q
output
q
input
¼
q
net;prod;M
q
input
ð4Þ
2.2. The production scenario
The scenario used for this study compares the energy and CO
2
-
equivalent emission balance from the production of conventional
pellets to that of torrefied pellets. Both pellet types are produced
from the same feedstock; logging residues from final timber
harvest. The system considered starts from the logging residue
harvesting operation and ends with the direct co-firing of pellets
with fossil coal – the final felling operation is outside the system
boundary.
outlines the stages of the scenario including
geographical location considered.
Case 1 considers that both fuels are produced in the vicinity of
Riistina, Finland. This site was chosen because plans for a commer-
cial plant in the same area were announced in the Finnish media in
February 2012 with a completion date in 2015
. The fuels are
Input
Output
Losses
Drying &
Torrefaction
40 000 t a
-1
Y
m
= 80%
Y
E
= 90%
Natural gas
155 kW
Biomass
combustion
4 271 kW
1 788 kg h
-1
48.3 % H
2
O
Feedstock
28 798 kW
12 058 kg h
-1
48.3 % H
2
O
Flue gas
78°C
1 789 kW
96 137 kg h
-1
Ash
2 kW
Torreied
feedstock
28 485 kW
5 179 kg h
-1
3.8 % H
2
O
Product
cooling
640 kW
Radiative
heat losses
992 kW
Input: 33 224
kW
Output: 28 485 kW
Losses: 3 423 kW
Thermal
Eficiency: 86%
Fig. 2. The thermal balance of scaled-up industrial torrefaction plant for annual production of 40,000 tonnes torrefied biomass. Based on inputs and outputs the thermal
efficiency of the process is 86%. Thermal losses stem from flue gases, product cooling, radiative loss and ash.
D. Agar et al. / Applied Energy 138 (2015) 621–630
625
then transported by lorry, shipped to the western Spanish port of
Coruña (from the Finnish port of Kotka). Co-firing of the fuels takes
place at the Meirama Central coal power plant which has a maxi-
mum electrical power output of 563 MW but an average annual
(1998–2007) electrical production of 12,433 TJ
. Case 2
includes the same production as in Case 1 but a production site
in western Canada which is representative of a long-distance trans-
port distance for pellets being the same as those used in another
relevant study
.
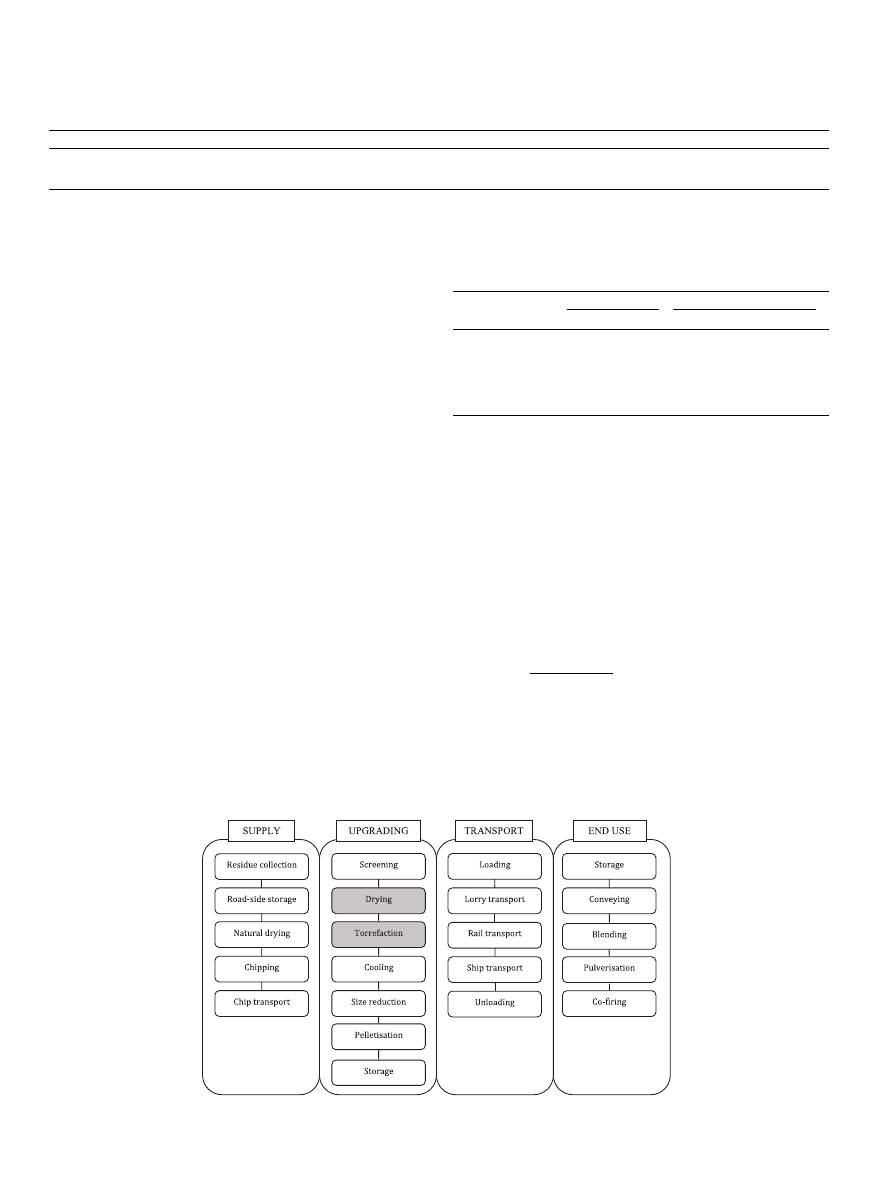
The production scenario is divided into four stages: Supply,
Upgrading, Transport and End Use. These are labelled and depicted
in
as the larger cells, within which separate operations are
described. The first two stages take place in Finland and the last
stage takes place in Spain. The second stage is based on road-side
storage and chipping of seasoned final harvest logging residues. In
terms of modelling this scenario, it is only in the Upgrading stage
that operations for the two types of fuel production differ; torrefac-
tion is absent from conventional pellet production. Transport of
feedstock is included in the Supply stage so that product transport
emissions and energy can be evaluated separately.
To determine energy and emission balance of each stage, oper-
ations are described in terms of their consumable inputs and
resulting outputs which are firstly identified. For example, the col-
lection of logging residues from a timber harvest area requires an
input of diesel fuel for the forwarders. By knowing the amount of
diesel used, the energy input and generated emissions from this
operation can be found by use of an energy and emission factor
which is specific for diesel. Outputs are by-products of an opera-
tion which may contribute to emission balance. An example of
an output is methane emissions produced as a result of non-inten-
tional anaerobic decomposition of piled logging residues at the
roadside.
contains the energy and CO
2
-equivalent emission fac-
tors used in the calculations. The total energy and emission balance
for each of the four stages in
can be found by summing up all
the contributing values from each operation.
2.3. Calculations
The input variables used for the calculation of mass and energy
balances of the four production stages for the two compared fuels
are given in
. Some input values are also given with a range
which reflects the variance of data found in cited literature.
The set of relations used to calculate physical quantities are
given below. These quantities are either necessary for determina-
tion of energy and emission balance or are of interest when com-
paring the production of two fuels. The dry mass distribution of
logging residues N
res,d
depends on residue potential Y and bulk
density
q
res
chipped material with M
res
moisture content.
N
res;d
¼ Y
q
res
1 ðM
res
=
100Þ
1000
ð5Þ
In conventional pellet production the dry mass of feedstock is con-
served in the final product.
In order to produce the same tonnage of torrefied pellets at
moisture content M
prod
however additional feedstock m
torr,d
is
required because of mass loss during torrefaction (
). The
Table 1
Production and transportation overview of two conventional and torrefied pellet production cases considered in this study.
Case
Supply
Production site
Lorry (km)
Rail (km)
Ship (km)
Shipping port
Receiving port
End use
1
Final harvest logging residues
Riistina, Finland
178
0
3361
Kotka
Coruña, Spain
Co-firing at Meirama Central
2
Prince George, Canada
0
781
15,500
Vancouver
Fig. 3. The four stages of the pellet production and supply chain are represented by the larger cells. Separate stage operations are depicted in the order they occur. Drying and
torrefaction operations are described in
. The final felling operation of forest at the site from which logging residues are collected is outside the system boundary.
Table 2
Energy and CO
2
-equivalent emission factors of production scenarios inputs and
outputs. Energy and emission factors are taken from Official Journal of the European
Union except for water and nitrogen values which are from Ecoinvent Database. N.A.
indicates Not Applicable.
Energy factor
CO
2
-equivalent emission factor
Input/output (unit)
Symbol
Value (kJ)
Symbol
Value (g)
Diesel (L)
D
diesel
41,597
C
diesel
3143
Electricity (kW h)
D
el
9819
C
el
465
Natural gas (kW h)
D
ng
4061
C
ng
243
Utility water (m
3
)
D
H2O
5337
C
H2O
263
Nitrogen gas (kg)
D
N2
9189
C
N2
436
Methane (kg)
N.A.
N.A.
C
CH4
25,000
626
D. Agar et al. / Applied Energy 138 (2015) 621–630

annual feedstock use on dry basis for annual production amount P
of torrefied pellets is then
m
feed;d
¼ P 1
M
prod
100
þ m
torr;d
ð6Þ
The required harvest area A of land to supply the total annual
production of pellets is then
A ¼
m
feed;d
N
res;d
ð7Þ
The total feedstock volume can be found from (wet) annual feed-
stock use m
feed
and bulk density of logging residue chips
q
feed
.
V ¼
m
feed
q
feed
ð8Þ
The net calorific value of produced pellets (Eq.
) is found as a
function of moisture content M in addition to the content of hydro-
gen w(H)
d
, oxygen w(O)
d
and nitrogen w(N)
d
in the dry fuel. This
relation is found in annex C of the European standard for determi-
nation of calorific value
q
net;prod;M
¼ fq
gr;prod;d
212:2 wðHÞ
d
0:8 ½wðOÞ
d
þ wðNÞ
d
g ð1 0:01MÞ 24:43 M
ð9Þ
The annual thermal output Q of fuel is equal to the product of
annual production amount P and the net calorific value.
Q ¼ Pq
net;prod;M
ð10Þ
The energy density (Eq.
) represents how much energy is
contained within a cubic metre of space. Calculated
r
values only
have meaning when bulk density
q
value corresponds to the same
level of moisture and hence specific net calorific value (Eq.
r
¼
q
q
net;prod;M
ð11Þ
The annual energy use K for grinding the fuel to a powder with coal
depends on the fuel’s specific pulverisation energy requirements k
which in practice is influenced by moisture content, scale of mill
and its design. This is electrical energy used at the power plant.
K ¼ k P
ð12Þ
Finally, the annual net electricity generated at the power plant
through combustion of produced fuel is the product of the annual
thermal output of fuel and the efficiency of electrical generation.
W ¼ Q
g
el
ð13Þ
2.4. Assumptions
The main assumptions made in the production scenario are
summarised below.
Logging residues are suitable for production of quality pellets
The final felling operation at the site from which logging
residues are collected is outside the system boundary depicted
in
.
Annual dry mass loss from feedstock is estimated to be 1.6%.
Table 3
Input values (and range) used in determining emission and energy balance of production cases of conventional and torrefied pellets. Symbols in the table refer to (a) based on
scaled-up production data from CENER pilot-plant (b) calculated value (c) country-specific lorry load restriction and (d) estimated value (e) determined using Google Maps
(
).
Symbol
Units
Conventional pellets
Torrefied pellets
Value
Range
Ref.
Value
Range
Ref.
Y
m
3
ha
1
100
70–130
100
70–130
q
res
kg m
3
325
250–400
325
250–400
M
res
%
55
50–60
55
50–60
q
net,res,d
MJ kg
1
18.5
18.5–20.0
18.5
18.5–20.0
r
res
L ha
1
152
106–198
152
106-198
f
CH4
kg t
1
0.01
d
0.01
d
f
loss
%
1.6
1.6
m
feed,d
t a
1
42,150
b
55,288
a
P
t a
1
40,000
a
40,000
a
M
feed
%
48.3
d
48.3
d
q
gr,prod,d
MJ kg
1
17.5
16.9–18.0
d
20.7
a
w(H)
d
%
6.1
6.00
a
w(O)
d
%
41
39.5
a
w(N)
d
%
0.5
0.18
a
V
feed
m
3
a
1
250,854
b
329,045
b
A
ha
2882
b
3780
b
q
prod
kg m
3
625
560–690
680
a
x
el
kW h a
1
5.88 10
6
8.64 10
6
a
x
ng
kW h a
1
0
1.20 10
6
a
x
N2
kg a
1
0
2.55 10
6
a
x
H2O
m
3
a
1
0
5000
a
L
FI
t
60
c
60
c
L
ES
t
40
c
40
c
r
l
L t
1
km
1
0.0760
0.0433–0.108
0.0760
0.0433–0.108
l
feed
km
25
d
25
d
l
prod
km
178
e
178
e
r
rail
L t
1
km
1
0.01683
0.01683
r
ship
L t
1
km
1
1.20 10
3
1.20 10
3
l
ship
km
3361
3361
g
el
%
29.1
29.1
M
prod
%
10
7–12
3.8
2.2–8.7
a
q
net,prod,M
MJ kg
1
15.5
b
19.8
b
r
GJ m
3
10.1
b
13.5
b
V
prod
m
3
a
1
61,538
b
58,824
b
k
kW h t
1
50
241–840
d
15
52–150
d
D. Agar et al. / Applied Energy 138 (2015) 621–630
627
Some methane formation from feedstock is assumed
No additives are used in pelletisation of both pellet types.
Limited natural drying of forest residues takes place and the
average moisture content of feedstock is the same as that deliv-
ered to large power plants in Finland
.
The average supply distance from harvest to pellet production
site is 25 km.
Lorries used for feedstock delivery travel empty one way.
There are no empty lorry loads in pellet transport.
Wet feedstock is combusted and used for drying before torre-
faction (
For both pellet types electricity is used for size reduction and
pelletisation.
Loading and unloading operations of products are not taken into
account.
There are no carbon stock changes from land where residues are
harvested (e
l
= 0).
Associated emissions from other co-firing operations at power
plant not taken into account (e
u
= 0).
The cut-to-length Nordic logging method is not utilised in Can-
ada but Case 2 assumes that similar residue amounts would be
available.
The efficiency of electrical generation at power plant is not fuel
dependent.
Electricity used for pulverising fuels at power plant comes from
the external electrical grid.
The energy required for pulverisation is estimated as 50 and
15 kW h t
1
for wood and torrefied pellets respectively.
The last stated assumption above requires justification. At pres-
ent industrial-scale energy requirements for pulverising wood and
torrefied pellets is not well documented. Energy requirements
depend on the target particle size for effective combustion. Suc-
cessful combustion in pulverised-fuel systems requires fuel with
a large surface-to-volume ratio but also a minimum amount of lar-
ger particles to achieve high combustion efficiency
Differences in fuel volatility mean that optimal particle size for
torrefied biomass is not the same for coals. Suitable particle size for
most coal types which includes high-grade ones is 70% of particles
passing through a sieve opening of about 75
l
m with all other par-
ticles passing through a 300
l
m sieve opening
. The equivalent
particle size for torrefied biomass enabling effective combustion
will be larger than that of coal. Recent co-firing trials with Bulga
coal in 0.5 MW boilers indicate that combustion efficiency remains
constant or increases slightly with a co-firing rate of 30% to 70%
torrefied pellets
. Furthermore the measured particle mass
fraction distribution from these trials showed a gradation to a lar-
ger fraction of larger particle as coal fraction decreased in the fuel
blends.
Energy consumption (electrical) for coal pulverisation has a
reported range of 7–36 kW h t
1
while the range for (non-torr-
efied) biomass begins at 40 kW h t
1
. Based on laboratory-scale
milling experiments carried out on both untreated and torrefied
wood and logging residues, grinding of the torrefied materials
requires 11–32% of the energy needed compared to untreated
material
. At industrial scales the relative differences in required
energy are likely to remain. Therefore an estimate of 50 and
15 kW h t
1
for the pulverisation energy requirement of wood
and torrefied pellets respectively has been used. Based on recent
work
the former value for wood pellets appears justified at
particle sizes below 2 mm.
With the assumptions made in this production scenario, the
total emissions from the production of the solid biomass fuels
before
energy
conversion
(Eq.
)
can
be
simplified
as
E ¼ e
ec
þ e
p
þ e
td
. This has been calculated using the factors given
in
and the following relations:
Emission from harvesting
e
ec
¼ ðr
res
AÞC
diesel
þ ðf
CH4
m
feed;d
ÞC
CH4
ð14Þ
Emissions from processing
e
p
¼ ðx
el
þ k PÞC
el
þ ðx
ng
C
ng
Þ þ ðx
N2
C
N2
Þ þ ðx
H2O
C
H2O
Þ
ð15Þ
Emissions from transportation
e
ec
¼ br
l
ðm
feed
l
feed
þ P l
prod
ÞcC
diesel
ð16Þ
3. Results and discussion
3.1. CO
2
-equivalent emissions
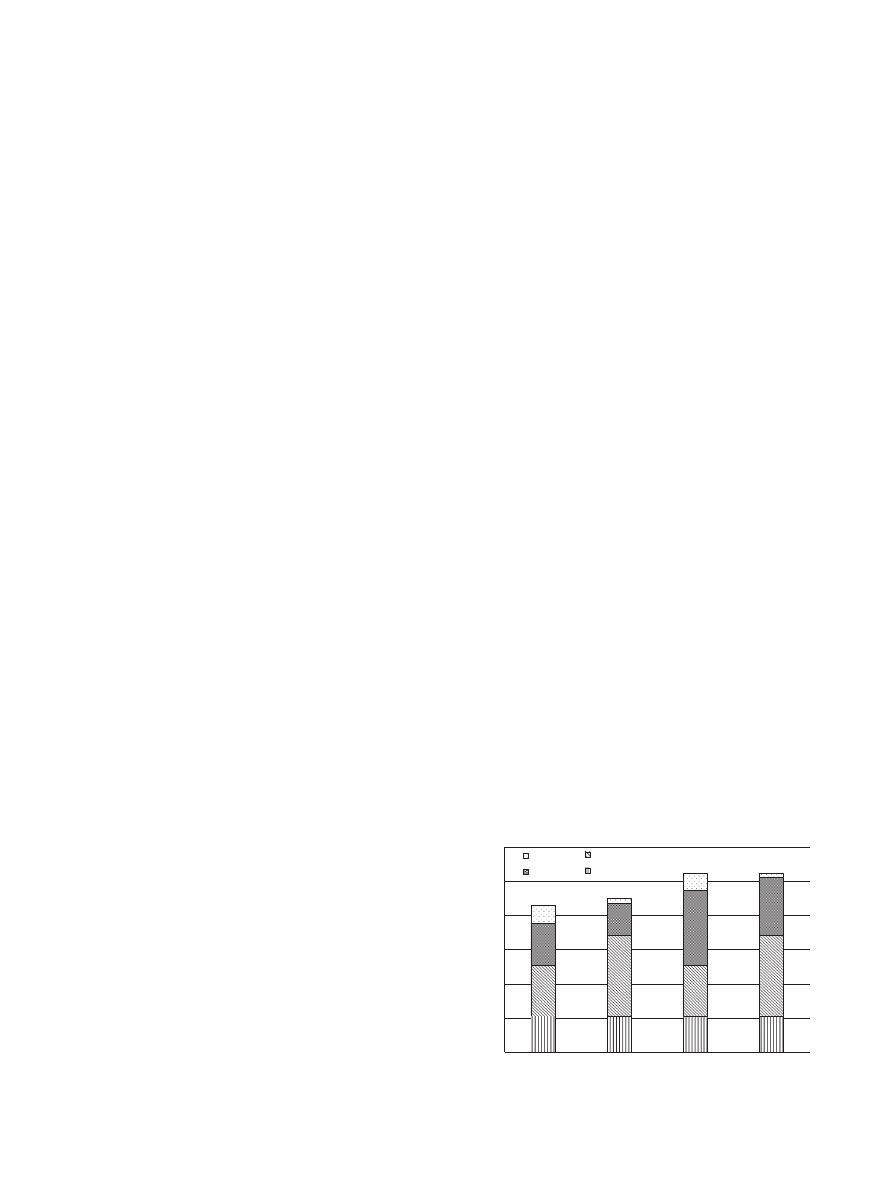
The total CO
2
-equivalent emissions per unit of produced elec-
tricity (Eq.
) for Case 1 and 2 are presented in
showing
the contributions from each stage. The fossil fuel comparator value
for electricity from coal is 198 g MJ
1
. Production and use of
both pellet types have a similar environmental impact generating
CO
2
-equivalent emissions in the range 43–45 g MJ
1
. This range
agrees well with the value found by Kabir and Kumar (47 g MJ
1
)
for torrefied pellets made from logging residues
despite the
fact that lifecycle emissions from the production plant themselves
have not been considered herein.
The emission savings (Eq.
) from the use of pellets in co-firing
are approximately 78% for conventional pellets and 77% for torr-
efied pellets for production in Finland while savings are 74% for
both pellet types in the case of production in Canada. The total
annual emissions of CO
2
-equivalent for Case 1 (Eq.
) are 7746 t
and 10,366 t for conventional and torrefied production. The emis-
sions per tonne of product from each production stage (
are: 46.8, 68.4, 55.2, 23.3 kg t
1
(conventional pellets) and 61.4,
136, 55.2, 6.98 kg t
1
(torrefied pellets).
CO
2
-equivalent emissions from torrefied pellet production
exceed those of conventional pellet production in both of the cases
considered. Torrefied pellets have greater Supply and Upgrading
stage emissions but lower Transport and End Use emissions.
3.2. Uncertainty in logging residue potential
Error bars have not been used in
but it is noted that the
range of values given in
variables for inputs of logging
residues potential (Y), bulk density of residue chips (
q
res
) and
moisture content of chips (M
feed
) contribute to the Supply stage
10.7
10.4
10.7
15.1
23.5
15.1
23.5
12.2
9.6
21.8
17.0
5.2
1.2
5.2
1.2
0
10
20
30
40
50
60
Conv. Pellets (FI)
Torrefied Pellets (FI) Conv. Pellets (CA) Torrefied Pellets (CA)
CO2-equivalent emissions (g/MJ elec)
End Use
Transport
Producon
Supply
43
45
52
52
10.4
Fig. 4. The total emissions from the final energy commodity (Eq.
) from the
considered production and supply scenario of conventional and torrefied pellets in
case of production in Finland (FI) and Canada (CA). The fossil fuel comparator value
for electricity from coal is 198 g MJ
1
.
628
D. Agar et al. / Applied Energy 138 (2015) 621–630

emissions and thereby affect the total emissions by ±4 g MJ
1
or
roughly ±2% of the emission savings.
3.3. Primary energy use
Based on the calculated primary energy input for Case 1 approx-
imately 3.3 GJ of energy is consumed for each tonne of conven-
tional pellets produced and co-fired. The corresponding value for
torrefied pellets is 4.5 GJ. This contributes to a useful energy gain
G (Eq.
) of 4.7 for conventional pellets and 4.4 for torrefied
pellets; or inversely 21% and 23% of the energy content of the
pellets respectively goes into producing and utilising them. The
greater G value of the former indicates that it gives a better
payback of energy investment – generating more energy output
for a given energy input. The primary energy input of conventional
pellet production in Finland (Case 1) and torrefied pellet produc-
tion in Canada (Case 2) can also be compared (see
3.4. Harvest area, net electricity generation and co-firing ratio
After taking into account dry mass losses, annual feedstock use
(dry basis) for production is 42,150 t for conventional pellets
compared to 55,288 t for torrefied; 31% greater amount for the
torrefied product. This amount of feedstock corresponds to an
annual harvest area A (Eq.
) of 2882 and 3780 ha for the two
product types.
The calculated annual net electricity generation (Eq.
) from
combustion of the two fuels is 180 and 230 TJ for conventional and
torrefied pellets. Considering annual feedstock use above this
equates to roughly 4.3 and 4.2 MJ generated electricity for each
kilogram of feedstock (dry mass) for conventional and for torrefied
pellets respectively.
Based on Meirama power plant’s average electrical production
the co-firing of produced pellets corresponds to co-firing ratios
(energy basis) of 1.45% for conventional pellets and 1.85% for torr-
efied pellets. These values are well below feasible direct co-firing
limits for plants designed to burn pulverised coal without addi-
tional infrastructure investments
.
3.5. Fossil fuel content of pellets
If the electricity used in the pellet production stage and in pul-
verisation at the power plant would come from strictly renewable
sources then for each tonne of produced pellets the fossil-fuel con-
tent (diesel and natural gas) of energy input could be reduced to
41% and 37% for conventional and torrefied pellets respectively –
fossil fuel input represents 8.7% and 8.4% of the energy content
of the pellets.
3.6. Minimum transport distance
Through torrefaction the calorific value of the feedstock is
improved which leads to a greater volumetric energy density of
pellets. Considering only one mode of transport, how large does
the product transport distance need to be in order for total gener-
ated CO
2
-equivalent emissions of torrefied pellets to be lower than
that of conventional pellets? This depends on the type of transport.
shows equations for the total emissions EC
el
of the two pellet
types as a function of lorry transport distance of product (assuming
no other modes of transport). The vertical axis intercept represents
sum of emissions from Supply, Upgrading and End Use stage. The
intersection of the two lines (401 km) represents the point of equal
emissions. At a distance greater than this, the total emissions of
torrefied pellet production and use are less than that of conven-
tional pellets. Similar equations can be found for the two other
modes for which the points of intersection occur at 1844 km (rail)
and 25,650 km (ship).
4. Conclusions
Torrefaction is an emerging technology which enables greater
co-firing rates of biomass with coal. Data on consumable inputs
from a semi-industrial torrefaction plant and the physical proper-
ties of produced pellets have been used to analyse energy input
and air emissions of torrefied pellet production and end use in
co-firing.
19%
44%
22%
15%
Supply
Producon
Transport
End Use
16%
56%
25%
3%
Supply
Producon
Transport
End Use
Conventional Pellets (FI)
Fossil fuel content: 41.1%
Torreied Pellets (CA)
Fossil fuel content: 33.5%
Fig. 5. Division of primary energy use per tonne product in pellet production and use from conventional pellets in Finland (FI) and torrefied pellets in Canada (CA) used in co-
firing in Spain. Total primary energy inputs are 3.3 GJ t
1
(conventional) and 5.1 GJ t
1
(torrefied).
y = 0.0529x + 30.718
y = 0.0414x + 35.368
20
25
30
35
40
45
50
55
60
0 100
200
300
400
500
600
EC
el
(g MJ
-1
)
Product transport distance (km)
Convenonal Pellets
Torrefied Pellets
Linear (Convenonal Pellets)
Linear (Torrefied Pellets)
Fig. 6. Total generated CO
2
-equivalent emissions from final energy commodity
(EC
el
) from conventional and torrefied pellet production as a function of lorry
transport distance of product. Assuming only lorry transport, total emissions for
torrefied pellet production and use are less at transport distances greater than
401 km.
D. Agar et al. / Applied Energy 138 (2015) 621–630
629

Using sustainability criteria of the Renewable Energy Directive,
emissions from the final energy commodity (electricity) are
45 g MJ
1
for torrefied pellets and 43 g MJ
1
conventional pellets.
Co-firing with either of these fuels would result in emission sav-
ings of 77% and 78% respectively compared to the emissions from
fossil coal.
Torrefied pellet production generates similar CO
2
-equivalent
emissions as conventional pellets for the studied intra-European
production scenario. Due to the improved fuel properties of torr-
efied pellets however use of this fuel would enable higher rates
of direct co-firing and hence greater volumes of biomass to be
combusted. Consequently, greater biomass utilisation would
enable further large CO
2
-equivalent emission reductions from the
energy sector. Results from research on industrial-scale size reduc-
tion (pulverisation) and combustion using torrefied pellets is desir-
able in future in order to better evaluate the environmental impact
of co-firing with this fuel.
Acknowledgements
The study presented in this paper is the result of collaboration
between the University of Jyväskylä (JYU) and the Spanish National
Renewable Energy Centre (CENER). First contact between Finnish
and Spanish authors was made possible through the BIOCLUS Pro-
ject funded by the EU Seventh Framework Programme (FP7). A
two-month collaboration between author organisations was
funded in part by the JYU International Research Mobility Grant.
The Finnish authors wish to thank personnel of the Biomass Energy
Department at CENER for their kind hospitality during this period.
The CB2G infrastructure at CENER has been co-funded through the
ERDF Funds, the Ministry of Economy and Competitiveness and the
Government of Navarra. The Fortum Foundation and the Johan
Gadolin Scholarship are also acknowledged for financial support
in this study.
References
.
[2] Wilén C, Jukola P, Järvinen T, Sipilä K, Verhoeff F, Kiel J. Wood torrefaction –
pilot tests and utilisation prospects. Espoo, VTT technology report 122; 2013.
p. 73.
.
.
[8]
.
[9]
[10] Directive 2009/28/EC of the European Parliament and of the Council. Official
journal of the European Union; 2009.
[14] Bergman PCA. Combined torrefaction and pelletisation – the TOP process.
ECN-C-05-073. Petten, NL: Energy Research Centre of the Netherlands; 2005.
[16] Celaya J, Goni I, Gil J, Echeverría I. New pilot plant for biomass torrefaction.
Biomass Energy Department, CENER – National Renewable Energy Centre. In:
18th European biomass conference and exhibition; 2010. p. 1544–9.
.
[18] European Commission Report. On sustainability requirements for the use of
solid and gaseous biomass sources in electricity, heating and cooling, SEC
(2010) 65 & SEC (2010) 66; 2010.
[19] Nurminen F. Environmental impacts of torrefied wood pellet production – case
Rislog and Pursiala pilot plant, Mikkeli, Miktech Oy report 7; 2013. p. 73.
[20] Hakkila P. Developing technologies for large-scale production of forest chips,
Sipoo, Wood Energy Technology Programme, VTT Technology report 6; 2004.
p. 84.
[21] Alakangas E. Properties of wood fuels used in Finland – BIOSOUTH project
report, Jyväskylä; 2005. p. 90.
[24] EN 14918:2009 Solid biofuels – determination of calorific value.
[25]
.
[26] Nylund NO, Erkkila K. Heavy-duty truck emissions and fuel consumption. In:
DEER conference, Chicago; 2005.
[27] Michaelowa A, Krause K. International maritime transport and climate policy.
Intereconomics May/June; 2000.
[28] International Port-to-port shipping distances. <
>.
.
.
El-Wakil MM. Powerplant technology. International ed. Singapore: McGraw-
Hill Inc.; 1984. p. 128–40
.
[33] Anttila M. Biohiilipellettien ja hiilen jauhatus- ja yhteispolttokokeet 0.5 MW:n
pölypolttolaitteistossa, Biohiiliseminaari (Wood Torrefaction Workshop),
Espoo, Finland, November; 2012.
.
630
D. Agar et al. / Applied Energy 138 (2015) 621–630
Document Outline
- Torrefied versus conventional pellet production – A comparative study on energy and emission balance based on pilot-plant data and EU sustainability criteria
Wyszukiwarka
Podobne podstrony:
Ekonomia środowiska 8, Inżynieria Środowiska, Ekonomia Środowiska
Zmiany systemu oceny betonowej kostki brukowej zgodnie ze standardami europejskimi
Ekonomia środowiska 2
ekonomia srodowiska id 155757 Nieznany
Ekonomia środowiska 9, Inżynieria Środowiska, Ekonomia Środowiska
Ekonomia środowiska 2, Inżynieria Środowiska, Ekonomia Środowiska
Pytania dodatkowe na zajęcia laboratoryjne z KSPD, Obsługa przyrządów pomiarowych ze standardem SCPI
Obsługa sygnałów zgodna ze standardem Posix cz 2
Książka red Ewy Domagały Zyśk Uczen ze specjalnymi potrzebami edukacyjnymi w środowisku rówieśniczy
Obsługa sygnałów zgodna ze standardem Posix
zagadnienia ekonomia srodowiska i zasobo naturalnych, Ekonomia, Ekonomia stacjonarna I stopień, I ro
Integrowanie strategii ZZL ze stratgią organizacji, Ekonomia, Zarządzanie Zasobami Ludzkimi
sciaga z ochrony2, Skrypty, UR - materiały ze studiów, I semsetr, Ochrona środowiska
prognozowanie-pytania, Czesc mam nadzieje, ze wczoraj dostalas ekonomike
EKONOMIA ŚRODOWISKA 1kolo
Praca samodzielna, materiały ekonomia UWM, ekonomia środowiska
Ekonomika srodowiska wyklad 07.03.05, administracja, II ROK, III Semestr, rok II, sem IV, Ekonomika
10 Montaż i demontaż uchwytów w podsufitówce ze standardu na GTI
więcej podobnych podstron