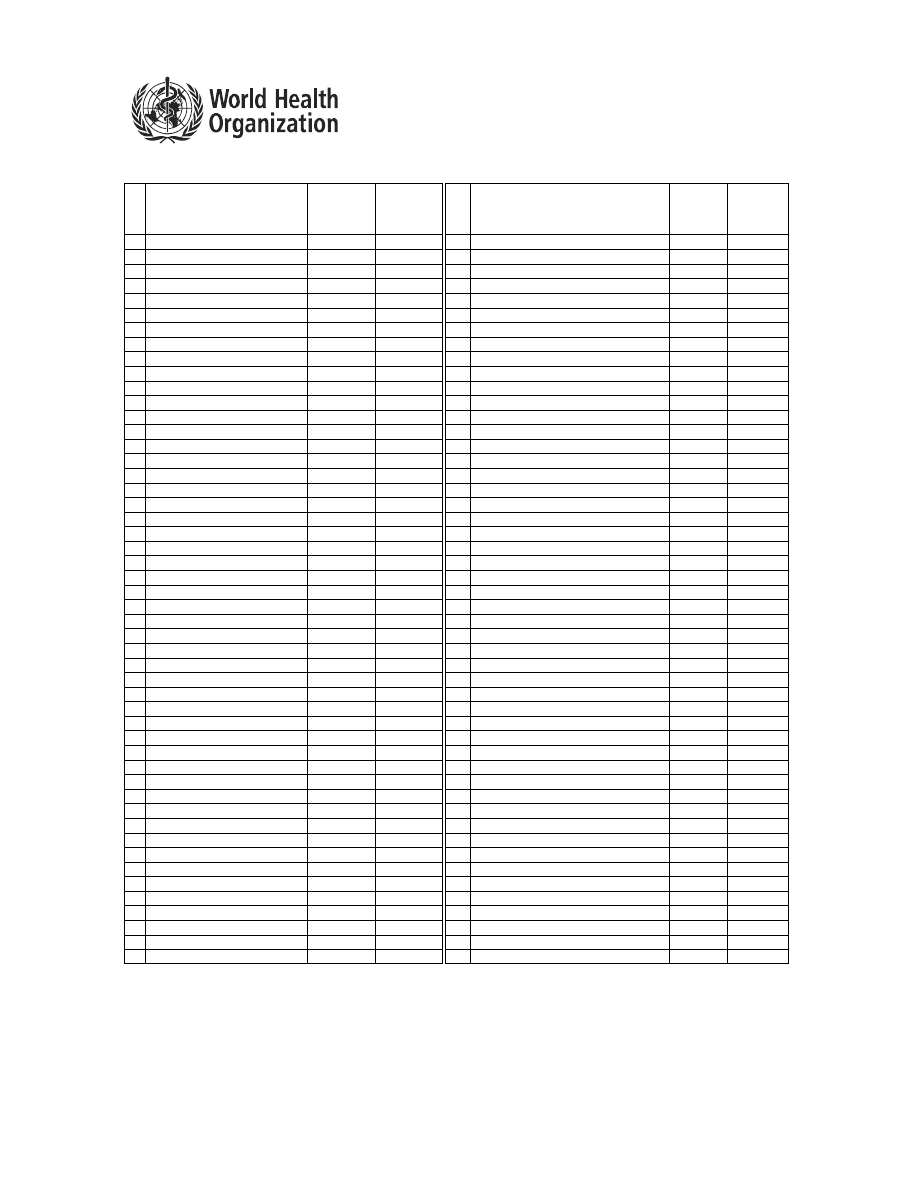
Gender distribution of blood donors, by country
1
No.
Country
% of
donations by
male donors
% of
donations by
female
donors
No.
Country
% of
donations
by male
donors
% of
donations
by female
donors
1 Afghanistan
77.8%
22.2%
51 Mauritania
77.3%
22.7%
2 Albania
68.0%
32.0%
52 Mauritius
79.4%
20.6%
3 Armenia
55.8%
44.2%
53 Micronesia (Federated States of)
22.0%
78.0%
4 Australia
50.1%
49.9%
54 Mongolia
45.4%
54.6%
5 Austria
68.2%
31.8%
55 Montenegro
89.0%
11.0%
6 Azerbaijan
40.2%
59.8%
56 Morocco
61.0%
39.0%
7 Bahrain
95.1%
4.9%
57 Myanmar
73.8%
26.2%
8 Belgium
56.3%
43.7%
58 Namibia
52.0%
48.0%
9 Benin
78.8%
21.2%
59 Nepal
83.7%
16.3%
10 Bhutan
68.2%
31.8%
60 New Zealand
48.4%
51.6%
11 Bosnia and Herzegovina
84.6%
15.4%
61 Niger
80.0%
20.0%
12 Botswana
57.0%
43.0%
62 Nigeria
79.2%
20.8%
13 Brunei Darussalam
83.3%
16.7%
63 Oman
92.9%
7.1%
14 Bulgaria
73.7%
26.3%
64 Palau
80.0%
20.0%
15 Burkina Faso
76.7%
23.3%
65 Papua New Guinea
80.7%
19.3%
16 Cambodia
83.0%
17.0%
66 Poland
77.9%
22.1%
17 Cape Verde
72.2%
27.8%
67 Portugal
49.5%
50.5%
18 Central African Republic
94.0%
6.0%
68 Qatar
96.3%
3.7%
19 Comoros
79.6%
20.4%
69 Republic of Korea
74.3%
25.7%
20 Cook Islands
63.6%
36.4%
70 Republic of Moldova
29.0%
71.0%
21 Côte d'Ivoire
83.4%
16.6%
71 Romania
65.8%
34.2%
22 Croatia
82.8%
17.2%
72 Samoa
95.1%
4.9%
23 Democratic Republic of the Congo
66.4%
33.6%
73 Sao Tome and Principe
91.5%
8.5%
24 Egypt
75.0%
25.0%
74 Senegal
75.0%
25.0%
25 Eritrea
72.3%
27.7%
75 Serbia
74.0%
26.0%
26 Estonia
47.5%
52.5%
76 Seychelles
84.2%
15.8%
27 Ethiopia
84.5%
15.5%
77 Sierra Leone
66.4%
33.6%
28 Fiji
80.0%
20.0%
78 Singapore
65.1%
34.9%
29 Finland
50.7%
49.3%
79 Slovenia
64.0%
36.0%
30 France
53.4%
46.6%
80 Somalia
100.0%
0.0%
31 Gabon
25.0%
75.0%
81 South Africa
61.4%
38.6%
32 Georgia
42.8%
57.2%
82 Sri Lanka
82.8%
17.2%
33 Guinea
80.0%
20.0%
83 Swaziland
43.0%
57.0%
34 Iceland
78.3%
21.7%
84 Switzerland
59.8%
40.2%
35 India
94.0%
6.0%
85 Tajikistan
67.0%
33.0%
36 Iran (Islamic Republic of)
93.4%
6.6%
86 Thailand
48.4%
51.6%
37 Ireland
58.9%
41.1%
87 the former Yugoslav Republic of Macedonia
79.9%
20.1%
38 Israel
72.0%
28.0%
88 Timor-Leste
63.6%
36.4%
39 Japan
69.1%
30.9%
89 Togo
82.7%
17.3%
40 Jordan
97.1%
2.9%
90 Tonga
70.6%
29.4%
41 Kenya
72.1%
27.9%
91 Tuvalu
89.5%
10.5%
42 Kiribati
91.0%
9.0%
92 United Arab Emirates
95.2%
4.8%
43 Kuwait
92.0%
8.0%
93 United Kingdom
51.0%
49.0%
44 Kyrgyzstan
65.0%
35.0%
94 United States of America
49.9%
50.1%
45 Lao People's Democratic Republic
70.0%
30.0%
95 Uzbekistan
62.8%
37.2%
46 Luxembourg
50.4%
49.6%
96 Vanuatu
76.3%
23.7%
47 Malawi
85.9%
14.1%
97 Viet Nam
51.1%
48.9%
48 Malaysia
75.5%
24.5%
98 Yemen
97.5%
2.5%
49 Maldives
99.3%
0.7%
99 Zambia
70.0%
30.0%
50 Mali
91.2%
8.8%
100 Zimbabwe
45.1%
54.9%
1
Source: Data reported by WHO Global Database on Blood Safety, 2008 (updated: June 2011)
Wyszukiwarka
Podobne podstrony:
Blood Lead Level Distribution by Age Group in Japanese
Blood Lead Level Distribution by Age Group in Japanese
2011 04 28 Myślenie genderowe może być szkodliwe
2011 12 15 Koniec genderowego apartheidu Palikocie ucz się
2011 2 KOSZE
higiena dla studentów 2011 dr I Kosinska
Plan pracy na 2011 pps
W 8 Hormony 2010 2011
wm 2011 zad 2
Zawal serca 20 11 2011
PRK 23 10 2011 org
PIW 4z 2011
pmp wykład podmioty 2011 2012
perswazja wykład2 2011 Zasady skutecznej perswazji Petty & Cacioppo
więcej podobnych podstron