
15
15-1
Projects
Key Concept
This section includes suggestions for a final project in the intro-
ductory statistics course. One fantastic advantage of this course is that it deals
with skills and concepts that can be applied immediately to the real world. After
only one fun semester, students are able to conduct their own studies. Some of the
suggested topics can be addressed by actually conducting experiments, whereas
others might be observational studies that require research of results already
available. For example, testing the effectiveness of air bags by actually crashing
cars is strongly discouraged, but destructive taste tests of chocolate chip cookies
can be an easy and somewhat enjoyable experiment. Here is a suggested format,
followed by a list of suggested topics.
Group Project vs. Individual Project
Topics can be assigned to individuals,
but group projects are particularly effective because they help develop the
interpersonal skills that are so necessary in today’s working environment. One
study showed that the “inability to get along with others” is the main reason for
firing employees, so a group project can be very helpful in preparing students for
their future work environments.
Oral Report
A 10- to 15-minute-long class presentation should involve all
group members in a coordinated effort to clearly describe the important
components of the study. Students typically have some reluctance to speak in
public, so a brief oral report can be very helpful in building the confidence that
they so well deserve. The oral report is an activity that helps students to be better
prepared for future professional activities.
Projects,
Procedures,
Perspectives
5014_TriolaE/S_CH15pp758-766 11/22/05 6:20 AM Page 758

15-1
Projects
759
Written Report
The main objective of the project is not to produce a written
document equivalent to a term paper, but a brief written report should be submitted,
and it should include the following components:
1.
List of data collected along with a description of how the data were obtained.
2.
Description of the method of analysis
3.
Relevant graphs and or statistics, including STATDISK, Minitab, Excel, or
TI-83 84 Plus displays
4.
Statement of conclusions
5.
Reasons why the results might not be correct, along with a description of
ways in which the study could be improved, given sufficient time and money
Large Classes or Online Classes: Posters or PowerPoint
Some classes are
too large for individual projects or group projects with three or four or five students
per group. Some online classes are not able to meet as a group. For such cases,
reports of individual or small group projects can be presented through posters
similar to those found at conference poster sessions. Posters summarizing
important elements of a project can be submitted to professors for evaluation.
PowerPoint presentations can also be used.
Survey
A survey can be an excellent source of data. See the accompanying
sample survey that provides opportunities for many interesting projects that
address questions such as these:
1.
When people “randomly” select digits (as in Question 2), are the results actu-
ally random?
2.
Do the last four digits of social security numbers appear to be random?
3.
Do males and females carry different amounts of change?
4.
Do males and females have different numbers of credit cards?
5.
Is there a difference in pulse rates between those who exercise and those who
do not?
6.
Is there a difference in pulse rates between those who smoke and those who
do not?
7.
Is there a relationship between exercise and smoking?
8.
Is there a relationship between eye color and exercise?
9.
Is there a relationship between exercise and the number of hours worked each
week?
10.
Is there a correlation between height and pulse rate?
>
>
5014_TriolaE/S_CH15pp758-766 11/22/05 6:20 AM Page 759

760
Chapter 15
Projects, Procedures, Perspectives
Project Topics
The preceding survey questions are a source of good project
ideas. Also see the “Cooperative Group Activities” listed near the end of each
chapter. The following list gives additional project suggestions.
1.
Graph from a newspaper or magazine redrawn to better describe the data
2.
Newspaper article about a survey rewritten to better inform the reader
3.
Using coin toss to get better survey results from sensitive question
4.
Ages of student cars compared to faculty staff cars
5.
Proportion of foreign cars driven by students compared to the proportion of
foreign cars driven by faculty
6.
Car ages in the parking lot of a discount store compared to car ages in the
parking lot of an upscale department store
7.
Are husbands older than their wives?
8.
Are husband wife age differences the same for young married couples as for
older married couples?
9.
Analysis of the ages of books in the college library
>
>
Survey
1.
Female
Male
2. Randomly select four digits and enter them here:
3. Eye color:
4. Enter your height in inches:
5. What is the total value of all coins now in your possession?
6. How many keys are in your possession at this time?
7. How many credit cards are in your possession at this time?
8. Enter the last four digits of your social security number:
9. Record your pulse rate by counting the number of heartbeats for 1 minute:
10. Do you exercise vigorously (such as running, swimming, cycling, tennis, bas-
ketball, etc.) for at least 20 minutes at least twice a week?
Yes
No
11. How many credit hours of courses are you taking this semester?
12. Are you currently employed?
Yes
No
If yes, how many hours do you work each week?
13. During the past 12 months, have you been the driver of a car that was involved
in a crash?
Yes
No
14. Do you smoke?
Yes
No
15.
Left-handed
Right-handed
Ambidextrous
5014_TriolaE/S_CH15pp758-766 11/22/05 6:20 AM Page 760

15-1
Projects
761
10.
How do the ages of books in the college library compare with those in the
library of a nearby college?
11.
Comparison of the ages of science books and English books in the college library
12.
Estimate the hours that students study each week
13.
Is there a relationship between hours studied and grades earned?
14.
Is there a relationship between hours worked and grades earned?
15.
A study of reported heights compared to measured heights
16.
A study of the accuracy of wristwatches
17.
Is there a relationship between taste and cost of different brands of chocolate
chip cookies?
18.
Is there a relationship between taste and cost of different brands of peanut butter?
19.
Is there a relationship between taste and cost of different brands of cola?
20.
Is there a relationship between salaries of professional baseball (or basketball
or football) players and their season achievements?
21.
Rates versus weights: Is there a relationship between car fuel-consumption
rates and car weights? If so, what is it?
22.
Is there a relationship between the lengths of men’s (or women’s) feet and
their heights?
23.
Are there differences in taste between ordinary tap water and different brands
of bottled water?
24.
Were auto fatality rates affected by laws requiring the use of seat belts?
25.
Were auto fatality rates affected when the national speed limit of 55 mi h was
eliminated?
26.
Were auto fatality rates affected by the presence of air bags?
27.
Is there a difference in taste between Coke and Pepsi?
28.
Is there a relationship between student grade-point averages and the amount
of television watched? If so, what is it?
29.
Is there a relationship between the selling price of a home and its living area
(in square feet), lot size (in acres), number of rooms, number of baths, and the
annual tax bill?
30.
Is there a relationship between the height of a person and the height of his or
her navel?
31.
Is there support for the theory that the ratio of a person’s height to his or her
navel height is the Golden Ratio of about 1.6:1?
32.
A comparison of the numbers of keys carried by males and females
33.
A comparison of the numbers of credit cards carried by males and females
34.
Are murderers now younger than they were in the past?
35.
Do people who exercise vigorously tend to have lower pulse rates than those
who do not?
36.
Do people who exercise vigorously tend to have reaction times that are differ-
ent from those of people who do not?
>
5014_TriolaE/S_CH15pp758-766 11/22/05 6:20 AM Page 761

762
Chapter 15
Projects, Procedures, Perspectives
37.
Do people who smoke tend to have higher pulse rates than those who do not?
38.
For people who don’t exercise, how is pulse rate affected by climbing a flight
of stairs?
39.
Do statistics students tend to have pulse rates that are different from those of
people not studying statistics?
40.
A comparison of GPAs of statistics students with those of students not taking
statistics
41.
Do left-handed people tend to be involved in more car crashes?
42.
Do men have more car crashes than women?
43.
Do young drivers have more car crashes than older drivers?
44.
Are drivers who get tickets more likely to be involved in crashes?
45.
Do smokers tend to be involved in more car crashes?
46.
Do people with higher pulse rates tend to be involved in more fewer car
crashes?
47.
A comparison of reaction times measured with right and left hands
48.
Are the proportions of male and female smokers equal?
49.
Do statistics students tend to smoke more (or less) than the general population?
50.
Are people more likely to smoke if their parents smoked?
51.
Evidence to support refute the belief that smoking tends to stunt growth
52.
Does a sports team have an advantage by playing at home instead of away?
53.
Analysis of service times (in seconds) for a car drive-up window at a bank
54.
A comparison of service times for car drive-up windows at two different banks
55.
Analysis of times that McDonald’s’ patrons are seated at a table
56.
Analysis of times that McDonald’s’ patrons wait in line
57.
Analysis of times cars require for refueling
58.
Is the state lottery a wise investment?
59.
Comparison of casino games: craps versus roulette
60.
Starting with $1, is it easier to win a million dollars by playing casino craps or
by playing a state lottery?
61.
Bold versus cautious strategies of gambling: When gambling with $100, does it
make any difference if you bet $1 at a time or if you bet the whole $100 at once?
62.
Designing and analyzing results from a test for extrasensory perception
63.
Analyzing paired data consisting of heights of fathers (or mothers) and
heights of their first sons (or daughters)
64.
Gender differences in preferences of dinner partners among the options of
Brad Pitt, Tiger Woods, the President, Nicole Kidman, Cameron Diaz, Julia
Roberts, and the Pope
65.
Gender differences in preferences of activities among the options of dinner,
movie, watching television, reading a book, golf, tennis, swimming, attending
a baseball game, attending a football game
>
>
5014_TriolaE/S_CH15pp758-766 11/22/05 6:20 AM Page 762

15-2
Procedures
763
66.
Is there support for the theory that cereals with high sugar content are placed
on shelves at eye level with children?
67.
Is there support for the claim that the mean body temperature is less than 98.6
o
F?
68.
Is there a relationship between smoking and drinking coffee?
69.
Is there a relationship between course grades and time spent playing video
games?
70.
Is there support for the theory that a Friday is unlucky if it falls on the 13th
day of a month?
15-2
Procedures
Key Concept
This section describes a general procedure for conducting a sta-
tistical analysis of data. The data can be collected through experiments or obser-
vational studies. It is absolutely essential to critique the method used to collect the
data, because a poor method of data collection destroys the usefulness of the data.
Look carefully for bias in the way data are collected, as well as bias on the part of
the person or group collecting the data. Many of the procedures in this book are
based on the assumption that we are working with a simple random sample, mean-
ing that every possible sample of the same size has the same chance of being se-
lected. If a sample is self-selected (voluntary response), it is worthless for making
inferences about a population.
Exploring, Comparing, Describing
After collecting data, first consider
exploring, describing, and comparing data sets using the basic tools included in
Chapters 2 and 3. Be sure to address the following:
1.
Center: Find the mean and median, which are measures of center that are rep-
resentative or average values giving us an indication of where the middle of
the data set is located.
2.
Variation: Find the range and standard deviation, which are measures of the
amount that the sample values vary among themselves.
3.
Distribution: Construct a histogram to see the nature or shape of the distribu-
tion of the data. Also construct a normal quantile plot and determine if the
data are from a population having a normal distribution.
4.
Outliers: Identify any sample values that lie very far away from the vast ma-
jority of the other sample values. If there are outliers, try to determine whether
they are errors that should be corrected. If the outliers are correct values,
study their effects by repeating the analysis with the outliers excluded.
5.
Time: Determine if the population is stable or if its characteristics are chang-
ing over time.
Inferences: Estimating Parameters and Hypothesis Testing
When
trying to use sample data for making inferences about a population, it is often
difficult to choose the particular procedure that should be applied. This text
5014_TriolaE/S_CH15pp758-766 11/22/05 6:20 AM Page 763
764
Chapter 15
Projects, Procedures, Perspectives
includes a wide variety of procedures that apply to many different circumstances.
Here are some key questions that should be answered:
●
What is the level of measurement (nominal, ordinal, interval, ratio) of the
data?
●
Does the study involve one, two, or more populations?
●
Is there a claim to be tested or a parameter to be estimated?
●
What is the relevant parameter (mean, standard deviation, proportion)?
●
Is the population standard deviation known? (The answer is almost always
“no.”)
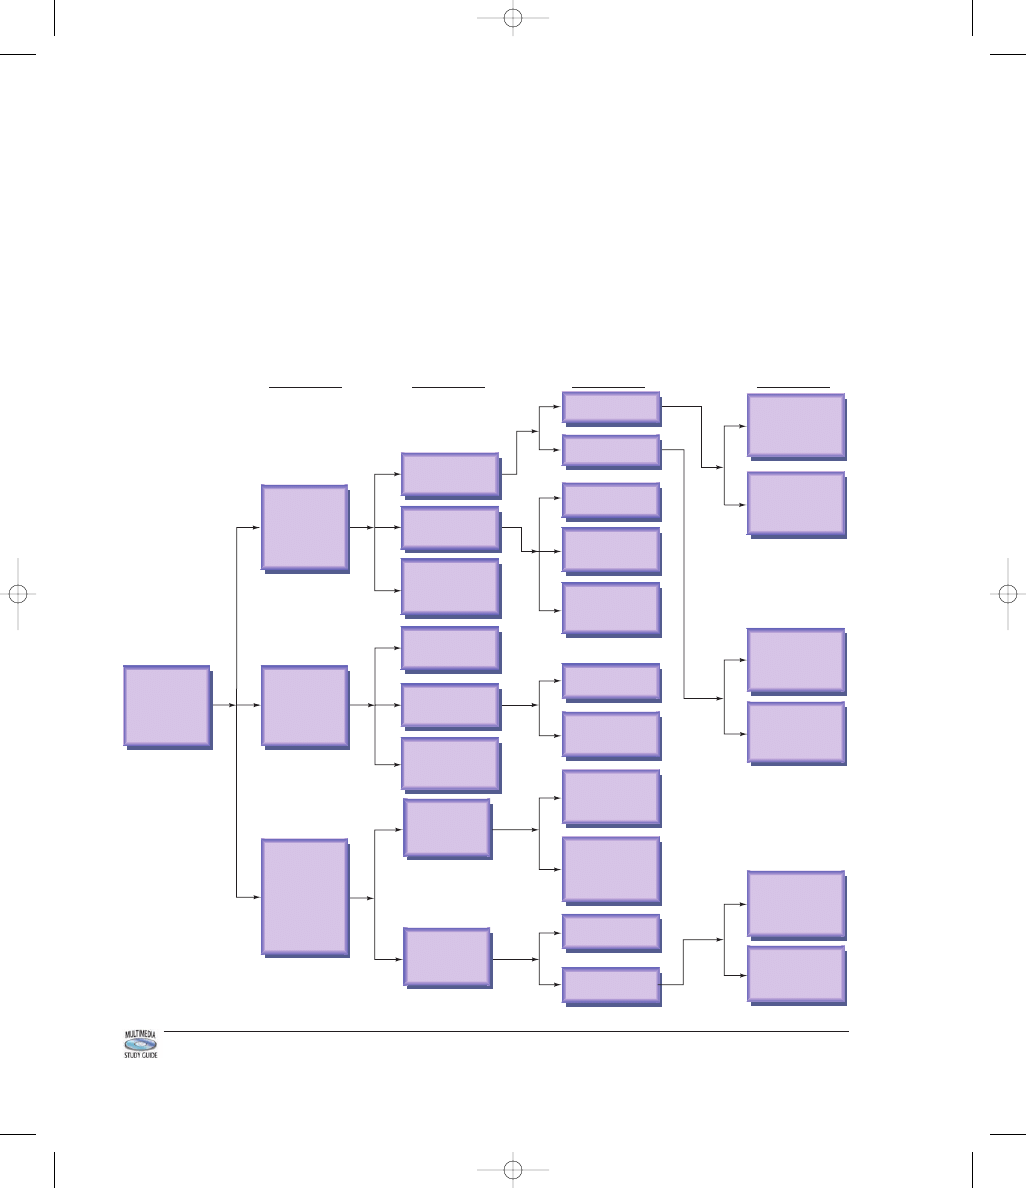
Two Populations
More Than
Two Populations:
13-5
One Population:
13-2
Contingency Table
(multiple rows,
columns):
11-3
Two Populations:
9-2
One Population
Matched Pairs:
13-3
Independent:
13-4
Means:
9-3
,
9-4
Variances:
9-5
Multinomial
(one row):
11-2
Hypothesis
Testing:
8-3
,
13-2
Proportions
Correlation
,
Regression:
Chap. 10
,
13-6
Frequency
Counts for
Categories
One Population
Two Populations
Variance
Mean
More Than
Two Populations:
Chap. 12
,
13-5
Estimating
Proportion with
Confidence
Interval:
7-2
Hypothesis
Testing:
8-6
Estimating
with Confidence
Interval:
7-5
Hypothesis
Testing
8-4
,
8-5
Estimating
with Confidence
Interval:
7-3
,
7-4
Claim or
Parameter
Inference
Number of
Populations
Level of
Measurement
What is the
level of
measurement
of the data?
1- 2
Ordinal
(such as data
consisting
of ranks)
Nominal
(data consisting
of proportions
or frequency
counts for
different
categories)
Interval
or Ratio
(such as
heights
,
weights)
Figure 15-1
Selecting the Appropriate Procedure
5014_TriolaE/S_CH15pp758-766 1/19/07 11:10 AM Page 764

15-3
Perspectives
765
●
Is there reason to believe that the population is normally distributed?
●
What is the basic question or issue that you want to address?
In Figure 15-1 we list the major methods included in this book, along with a scheme
for determining which of those methods should be used. To use Figure 15-1, start at
the extreme left side of the figure and begin by identifying the level of measurement
of the data. Proceed to follow the path suggested by the level of measurement, the
number of populations, and the claim or parameter being considered.
Note: This figure applies to a fixed population. If the data are from a process
that may change over time, construct a control chart (see Chapter 14) to determine
whether the process is statistically stable. This figure applies to process data only
if the process is statistically stable.
Figure 15-1 can be used for statistical methods presented in this book, but there
may be other methods that might be more suitable for a particular statistical analy-
sis. Consult your friendly professional statistician for help with other methods.
15-3
Perspectives
Key Concept
No single introductory statistics course can transform anyone
into an expert statistician. The introductory course has a limited scope and does
not include many important topics. Know that professional help is available from
expert statisticians, and this introductory statistics course will help you in discus-
sions with one of these experts.
Successful completion of an introductory statistics course results in benefits that
extend far beyond the attainment of credit toward a college degree. You will have
improved job marketability. You will be better prepared to critically analyze reports
in the media and professional journals. You will understand the basic concepts of
probability and chance. You will know that in attempting to gain insight into a set of
data, it is important to investigate measures of center (such as mean and median),
measures of variation (such as range and standard deviation), the nature of the distri-
bution (via a frequency distribution or graph), the presence of outliers, and whether
the population is stable or is changing over time. You will know and understand the
importance of estimating population parameters (such as a mean, standard devia-
tion, and proportion), as well as testing claims made about population parameters.
Throughout this text we have emphasized the importance of good sampling.
You should recognize that a bad sample may be beyond repair by even the most
expert statisticians using the most sophisticated techniques. There are many mail,
magazine, and telephone call-in surveys that allow respondents to be “self-
selected.” The results of such surveys are generally worthless when judged ac-
cording to the criteria of sound statistical methodology. Keep this in mind when
you encounter voluntary response (self-selected) surveys, so that you don’t let
them affect your beliefs and decisions. You should also recognize, however, that
many surveys and polls obtain very good results, even though the sample sizes
might seem to be relatively small. Although many people refuse to believe it, a na-
tionwide survey of only 1200 voters can provide good results if the sampling is
carefully planned and executed.
5014_TriolaE/S_CH15pp758-766 11/22/05 6:20 AM Page 765

766
Chapter 15
Projects, Procedures, Perspectives
Throughout this text we have emphasized the interpretation of results. A final
conclusion to “reject the null hypothesis” is basically worthless to all of those
other people who lacked the vision and wisdom to take a statistics course. Com-
puters and calculators are quite good at yielding results, but such results typically
require the careful interpretation that breathes life into an otherwise meaningless
result. We should recognize that a result is not automatically valid simply because
it was computer-generated. Computers don’t think, and they are quite capable of
providing results that are quite ridiculous when considered in the context of the
real world. We should always apply the most important and indispensable tool in
all of statistics: common sense!
The Role of Statistics in Education
There was once a time that a person was
considered to be educated if he or she could simply read. But we now live in a time
that demands so much more. Today, an educated person is capable of critical
thinking. An educated person is capable of learning, instead of just doing. An
educated person has intellectual curiosity. An educated person can communicate
effectively both orally and in writing. An educated person can relate to all other
people, including those from different cultures, as well as those who might not be
so educated. The introductory statistics course can provide so much more than the
mere attainment of technical skills. Successful completion of the introductory
statistics course can enable students to grow as individuals and professionals so
that they can make substantial progress toward becoming productive professionals,
responsible citizens, and people who are truly educated.
5014_TriolaE/S_CH15pp758-766 11/22/05 6:20 AM Page 766
Wyszukiwarka
Podobne podstrony:
Elementary Statistics 10e TriolaE S Creditspp855 856
Elementary Statistics 10e TriolaE S CH05pp198 243
Elementary Statistics 10e TriolaE S CH11pp588 633
Elementary Statistics 10e TriolaE S CH02pp040 073
Elementary Statistics 10e TriolaES FMppi xxxv
Elementary Statistics 10e 5014 TriolaE2FS AppC
Elementary Statistics 10e 5014 TriolaE2FS AppA
Elementary Statistics 10e 5014 TriolaE2FS AppD
Elementary Statistics 10e 5014 TriolaE S Index
Elementary Statistics 10e 5014 Triola Pullout Card
Elementary Statistics 10e 5014 TriolaE2FS AppB
Elementary Statistics 10e 5014 TriolaE2FS APP opener
Elementary Statistics 10e 5014 Triola endpapers
Elementary Statistics 10e 5014 TriolaE MultiM FMppi xxxv ds
elements of statistical learning sol2
Wyk 02 Pneumatyczne elementy
więcej podobnych podstron