5014_Triola_endpapers 11/23/05 10:53 AM Page 2
complement of event A
null hypothesis
alternative hypothesis
a
alpha; probability of a type I error or the
area of the critical region
b
beta; probability of a type II error
r
sample linear correlation coefficient
r
rho; population linear correlation coefficient
coefficient of determination
multiple coefficient of determination
Spearman’s rank correlation coefficient
point estimate of the slope of the regression
line
point estimate of the y-intercept of the
regression line
predicted value of y
d
difference between two matched values
mean of the differences d found from
matched sample data
standard deviation of the differences d
found from matched sample data
standard error of estimate
T
rank sum; used in the Wilcoxon signed-
ranks test
H
Kruskal-Wallis test statistic
R
sum of the ranks for a sample; used in the
Wilcoxon rank-sum test
expected mean rank; used in the Wilcoxon
rank-sum test
expected standard deviation of ranks; used
in the Wilcoxon rank-sum test
G
number of runs in runs test for randomness
expected mean number of runs; used in runs
test for randomness
expected standard deviation for the number
of runs; used in runs test for randomness
mean of the population of all possible sam-
ple means
standard deviation of the population of all
possible sample means
E
margin of error of the estimate of a popula-
tion parameter, or expected value
quartiles
c,
deciles
c,
percentiles
x
data value
P
99
P
2
,
P
1
,
D
9
D
2
,
D
1
,
Q
3
Q
2
,
Q
1
,
x
s
x
x
m
x
s
G
m
G
s
R
m
R
s
e
s
d
d
yˆ
b
0
b
1
r
s
R
2
r
2
H
1
H
0
A
Symbol Table
5014_Triola_endpapers 11/23/05 10:53 AM Page 3
f
frequency with which a value occurs
S
capital sigma; summation
S
x
sum of the values
sum of the squares of the values
square of the sum of all values
S
xy
sum of the products of each x value multi-
plied by the corresponding y value
n
number of values in a sample
n!
n factorial
N
number of values in a finite population; also
used as the size of all samples combined
k
number of samples or populations or cate-
gories
mean of the values in a sample
mean of the sample ranges
m
mu; mean of all values in a population
s
standard deviation of a set of sample values
s
lowercase sigma; standard deviation of all val-
ues in a population
variance of a set of sample values
variance of all values in a population
z
standard score
critical value of z
t
t distribution
critical value of t
df
number of degrees of freedom
F
F distribution
chi-square distribution
right-tailed critical value of chi-square
left-tailed critical value of chi-square
p
probability of an event or the population pro-
portion
q
probability or proportion equal to 1 2 p
sample proportion
sample proportion equal to
proportion obtained by pooling two samples
proportion or probability equal to
P(A)
probability of event A
P(A
0 B) probability of event A, assuming event B has
occurred
number of permutations of n items selected r
at a time
number of combinations of n items selected r
at a time
n
C
r
n
P
r
1 2 p
q
p
1 2 pˆ
qˆ
pˆ
x
2
L
x
2
R
x
2
t
a
>2
z
a
>2
s
2
s
2
R
x
(Sx)
2
S
x
2
Symbol Table
5014_Triola_endpapers 11/23/05 10:53 AM Page 4
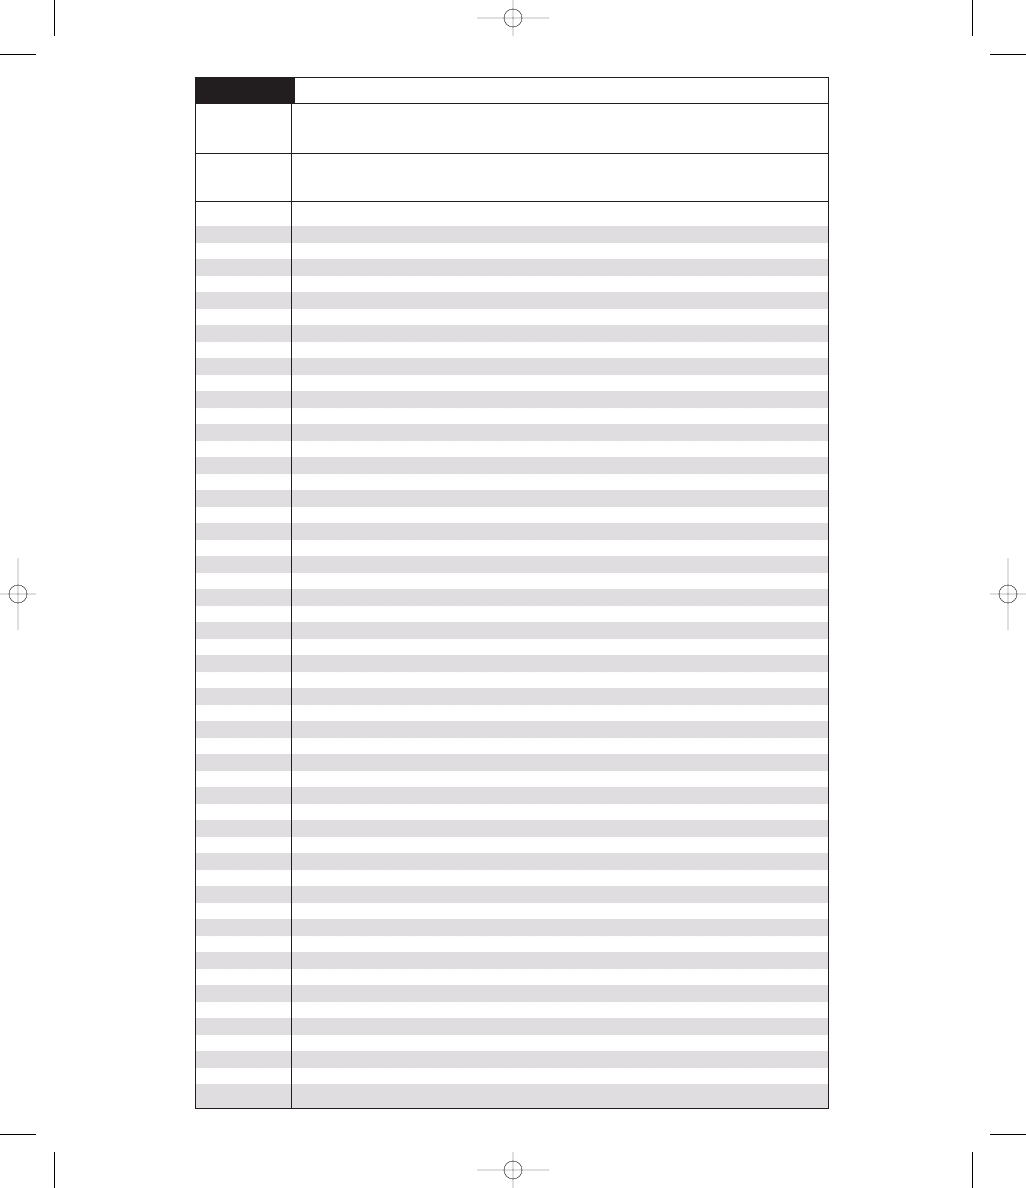
T
ABLE
A-3
t Distribution: Critical t Values
Area in One Tail
0.005
0.01
0.025
0.05
0.10
Degrees of
Area in Two Tails
Freedom
0.01
0.02
0.05
0.10
0.20
1
63.657
31.821
12.706
6.314
3.078
2
9.925
6.965
4.303
2.920
1.886
3
5.841
4.541
3.182
2.353
1.638
4
4.604
3.747
2.776
2.132
1.533
5
4.032
3.365
2.571
2.015
1.476
6
3.707
3.143
2.447
1.943
1.440
7
3.499
2.998
2.365
1.895
1.415
8
3.355
2.896
2.306
1.860
1.397
9
3.250
2.821
2.262
1.833
1.383
10
3.169
2.764
2.228
1.812
1.372
11
3.106
2.718
2.201
1.796
1.363
12
3.055
2.681
2.179
1.782
1.356
13
3.012
2.650
2.160
1.771
1.350
14
2.977
2.624
2.145
1.761
1.345
15
2.947
2.602
2.131
1.753
1.341
16
2.921
2.583
2.120
1.746
1.337
17
2.898
2.567
2.110
1.740
1.333
18
2.878
2.552
2.101
1.734
1.330
19
2.861
2.539
2.093
1.729
1.328
20
2.845
2.528
2.086
1.725
1.325
21
2.831
2.518
2.080
1.721
1.323
22
2.819
2.508
2.074
1.717
1.321
23
2.807
2.500
2.069
1.714
1.319
24
2.797
2.492
2.064
1.711
1.318
25
2.787
2.485
2.060
1.708
1.316
26
2.779
2.479
2.056
1.706
1.315
27
2.771
2.473
2.052
1.703
1.314
28
2.763
2.467
2.048
1.701
1.313
29
2.756
2.462
2.045
1.699
1.311
30
2.750
2.457
2.042
1.697
1.310
31
2.744
2.453
2.040
1.696
1.309
32
2.738
2.449
2.037
1.694
1.309
34
2.728
2.441
2.032
1.691
1.307
36
2.719
2.434
2.028
1.688
1.306
38
2.712
2.429
2.024
1.686
1.304
40
2.704
2.423
2.021
1.684
1.303
45
2.690
2.412
2.014
1.679
1.301
50
2.678
2.403
2.009
1.676
1.299
55
2.668
2.396
2.004
1.673
1.297
60
2.660
2.390
2.000
1.671
1.296
65
2.654
2.385
1.997
1.669
1.295
70
2.648
2.381
1.994
1.667
1.294
75
2.643
2.377
1.992
1.665
1.293
80
2.639
2.374
1.990
1.664
1.292
90
2.632
2.368
1.987
1.662
1.291
100
2.626
2.364
1.984
1.660
1.290
200
2.601
2.345
1.972
1.653
1.286
300
2.592
2.339
1.968
1.650
1.284
400
2.588
2.336
1.966
1.649
1.284
500
2.586
2.334
1.965
1.648
1.283
750
2.582
2.331
1.963
1.647
1.283
1000
2.581
2.330
1.962
1.646
1.282
2000
2.578
2.328
1.961
1.646
1.282
Large
2.576
2.326
1.960
1.645
1.282
5014_Triola_endpapers 11/23/05 10:53 AM Page 5
0
z
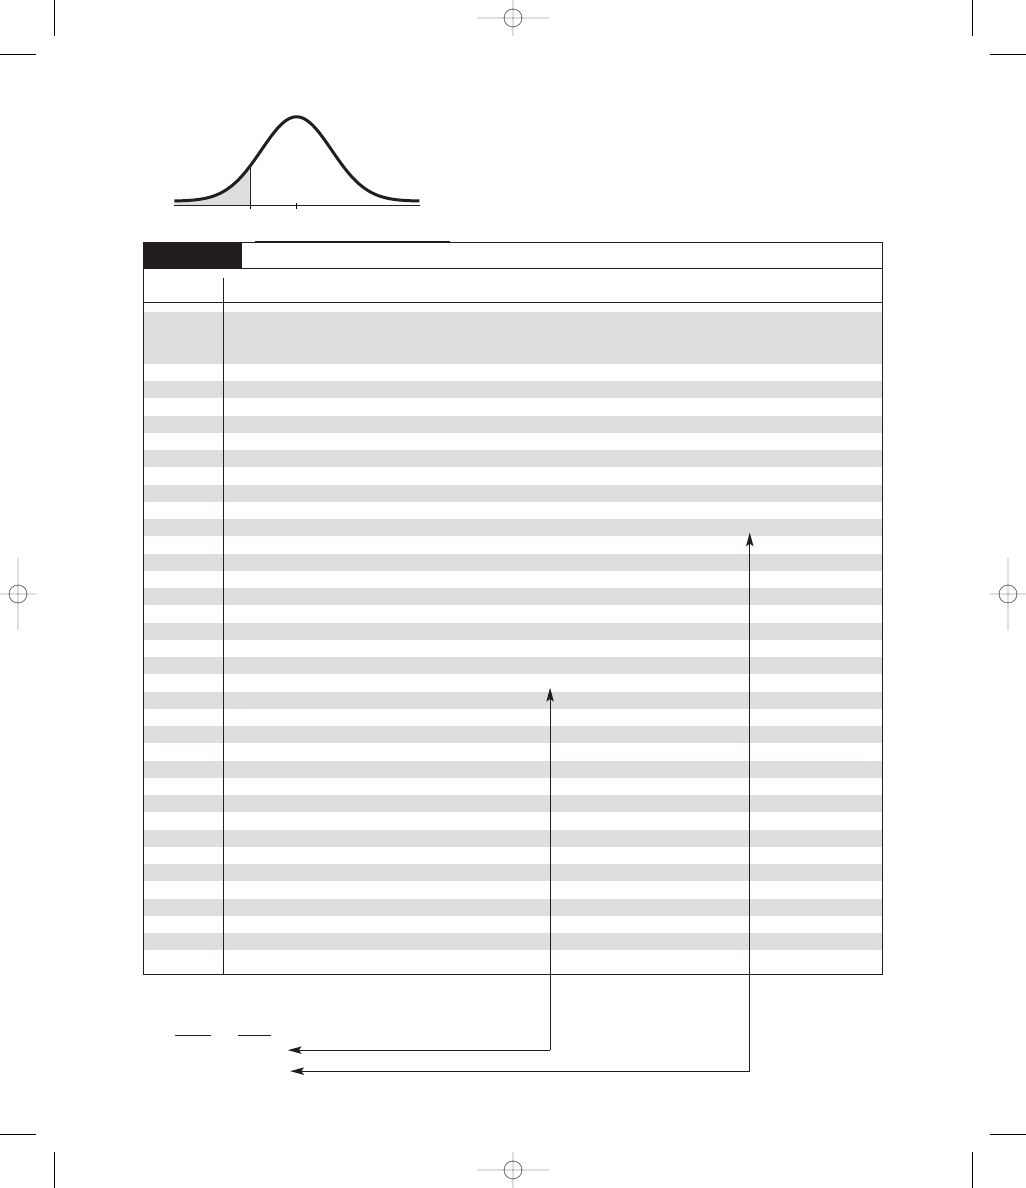
T
ABLE
A-2
Standard Normal (
z) Distribution: Cumulative Area from the LEFT
z
.00
.01
.02
.03
.04
.05
.06
.07
.08
.09
3.50
and
lower
.0001
3.4
.0003
.0003
.0003
.0003
.0003
.0003
.0003
.0003
.0003
.0002
3.3
.0005
.0005
.0005
.0004
.0004
.0004
.0004
.0004
.0004
.0003
3.2
.0007
.0007
.0006
.0006
.0006
.0006
.0006
.0005
.0005
.0005
3.1
.0010
.0009
.0009
.0009
.0008
.0008
.0008
.0008
.0007
.0007
3.0
.0013
.0013
.0013
.0012
.0012
.0011
.0011
.0011
.0010
.0010
2.9
.0019
.0018
.0018
.0017
.0016
.0016
.0015
.0015
.0014
.0014
2.8
.0026
.0025
.0024
.0023
.0023
.0022
.0021
.0021
.0020
.0019
2.7
.0035
.0034
.0033
.0032
.0031
.0030
.0029
.0028
.0027
.0026
2.6
.0047
.0045
.0044
.0043
.0041
.0040
.0039
.0038
.0037
.0036
2.5
.0062
.0060
.0059
.0057
.0055
.0054
.0052
.0051
.0049
.0048
2.4
.0082
.0080
.0078
.0075
.0073
.0071
.0069
.0068
.0066
.0064
2.3
.0107
.0104
.0102
.0099
.0096
.0094
.0091
.0089
.0087
.0084
2.2
.0139
.0136
.0132
.0129
.0125
.0122
.0119
.0116
.0113
.0110
2.1
.0179
.0174
.0170
.0166
.0162
.0158
.0154
.0150
.0146
.0143
2.0
.0228
.0222
.0217
.0212
.0207
.0202
.0197
.0192
.0188
.0183
1.9
.0287
.0281
.0274
.0268
.0262
.0256
.0250
.0244
.0239
.0233
1.8
.0359
.0351
.0344
.0336
.0329
.0322
.0314
.0307
.0301
.0294
1.7
.0446
.0436
.0427
.0418
.0409
.0401
.0392
.0384
.0375
.0367
1.6
.0548
.0537
.0526
.0516
.0505
.0495
.0485
.0475
.0465
.0455
1.5
.0668
.0655
.0643
.0630
.0618
.0606
.0594
.0582
.0571
.0559
1.4
.0808
.0793
.0778
.0764
.0749
.0735
.0721
.0708
.0694
.0681
1.3
.0968
.0951
.0934
.0918
.0901
.0885
.0869
.0853
.0838
.0823
1.2
.1151
.1131
.1112
.1093
.1075
.1056
.1038
.1020
.1003
.0985
1.1
.1357
.1335
.1314
.1292
.1271
.1251
.1230
.1210
.1190
.1170
1.0
.1587
.1562
.1539
.1515
.1492
.1469
.1446
.1423
.1401
.1379
0.9
.1841
.1814
.1788
.1762
.1736
.1711
.1685
.1660
.1635
.1611
0.8
.2119
.2090
.2061
.2033
.2005
.1977
.1949
.1922
.1894
.1867
0.7
.2420
.2389
.2358
.2327
.2296
.2266
.2236
.2206
.2177
.2148
0.6
.2743
.2709
.2676
.2643
.2611
.2578
.2546
.2514
.2483
.2451
0.5
.3085
.3050
.3015
.2981
.2946
.2912
.2877
.2843
.2810
.2776
0.4
.3446
.3409
.3372
.3336
.3300
.3264
.3228
.3192
.3156
.3121
0.3
.3821
.3783
.3745
.3707
.3669
.3632
.3594
.3557
.3520
.3483
0.2
.4207
.4168
.4129
.4090
.4052
.4013
.3974
.3936
.3897
.3859
0.1
.4602
.4562
.4522
.4483
.4443
.4404
.4364
.4325
.4286
.4247
0.0
.5000
.4960
.4920
.4880
.4840
.4801
.4761
.4721
.4681
.4641
NOTE: For values of z below
3.49, use 0.0001 for the area.
*Use these common values that result from interpolation:
z score
Area
1.645
0.0500
2.575
0.0050
*
*
NEGATIVE z Scores
5014_Triola_endpapers 12/08/05 2:39 PM Page 6
0
z
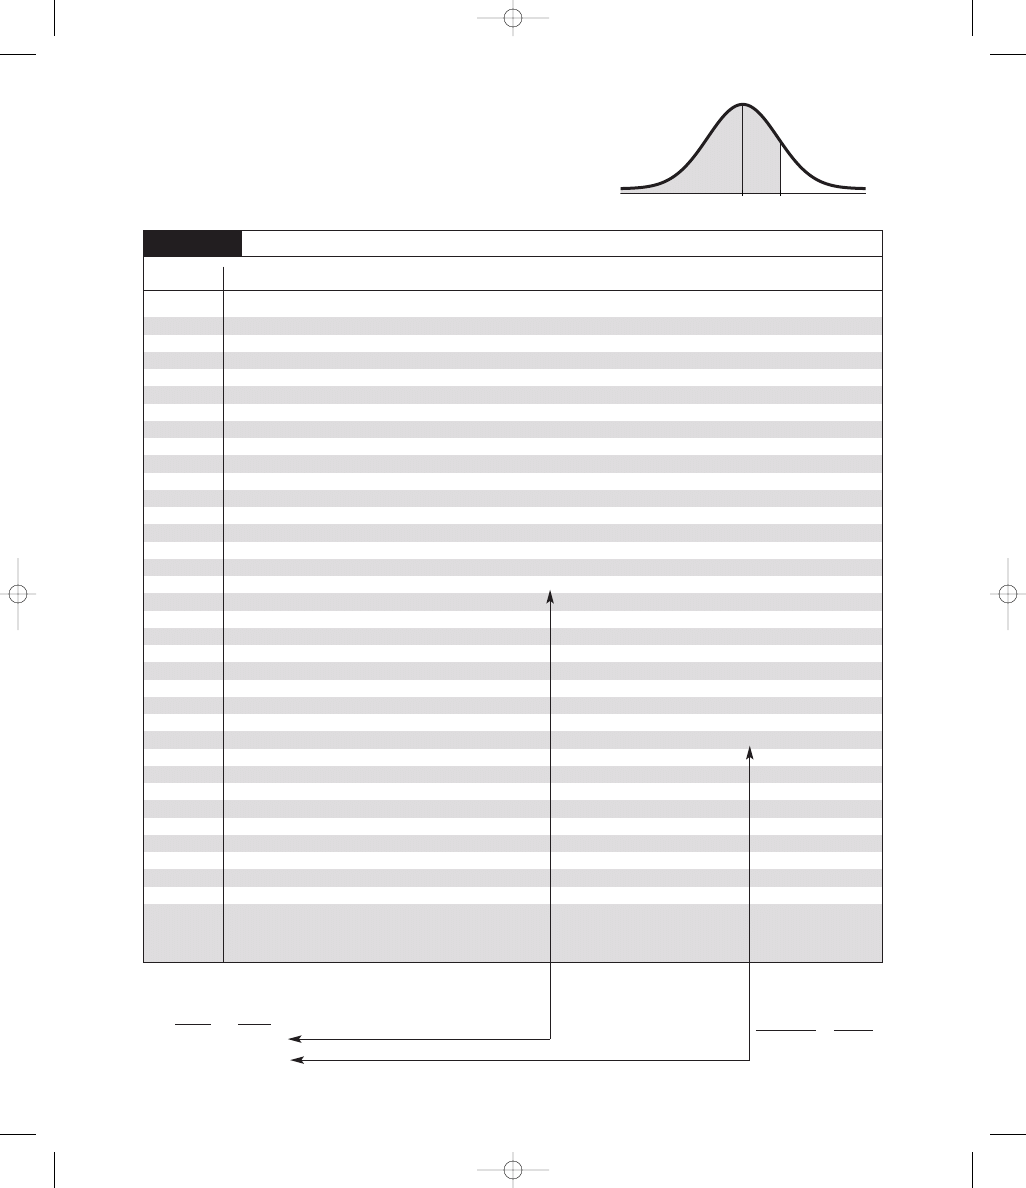
T
ABLE
A-2
(continued) Cumulative Area from the LEFT
z
.00
.01
.02
.03
.04
.05
.06
.07
.08
.09
0.0
.5000
.5040
.5080
.5120
.5160
.5199
.5239
.5279
.5319
.5359
0.1
.5398
.5438
.5478
.5517
.5557
.5596
.5636
.5675
.5714
.5753
0.2
.5793
.5832
.5871
.5910
.5948
.5987
.6026
.6064
.6103
.6141
0.3
.6179
.6217
.6255
.6293
.6331
.6368
.6406
.6443
.6480
.6517
0.4
.6554
.6591
.6628
.6664
.6700
.6736
.6772
.6808
.6844
.6879
0.5
.6915
.6950
.6985
.7019
.7054
.7088
.7123
.7157
.7190
.7224
0.6
.7257
.7291
.7324
.7357
.7389
.7422
.7454
.7486
.7517
.7549
0.7
.7580
.7611
.7642
.7673
.7704
.7734
.7764
.7794
.7823
.7852
0.8
.7881
.7910
.7939
.7967
.7995
.8023
.8051
.8078
.8106
.8133
0.9
.8159
.8186
.8212
.8238
.8264
.8289
.8315
.8340
.8365
.8389
1.0
.8413
.8438
.8461
.8485
.8508
.8531
.8554
.8577
.8599
.8621
1.1
.8643
.8665
.8686
.8708
.8729
.8749
.8770
.8790
.8810
.8830
1.2
.8849
.8869
.8888
.8907
.8925
.8944
.8962
.8980
.8997
.9015
1.3
.9032
.9049
.9066
.9082
.9099
.9115
.9131
.9147
.9162
.9177
1.4
.9192
.9207
.9222
.9236
.9251
.9265
.9279
.9292
.9306
.9319
1.5
.9332
.9345
.9357
.9370
.9382
.9394
.9406
.9418
.9429
.9441
1.6
.9452
.9463
.9474
.9484
.9495
.9505
.9515
.9525
.9535
.9545
1.7
.9554
.9564
.9573
.9582
.9591
.9599
.9608
.9616
.9625
.9633
1.8
.9641
.9649
.9656
.9664
.9671
.9678
.9686
.9693
.9699
.9706
1.9
.9713
.9719
.9726
.9732
.9738
.9744
.9750
.9756
.9761
.9767
2.0
.9772
.9778
.9783
.9788
.9793
.9798
.9803
.9808
.9812
.9817
2.1
.9821
.9826
.9830
.9834
.9838
.9842
.9846
.9850
.9854
.9857
2.2
.9861
.9864
.9868
.9871
.9875
.9878
.9881
.9884
.9887
.9890
2.3
.9893
.9896
.9898
.9901
.9904
.9906
.9909
.9911
.9913
.9916
2.4
.9918
.9920
.9922
.9925
.9927
.9929
.9931
.9932
.9934
.9936
2.5
.9938
.9940
.9941
.9943
.9945
.9946
.9948
.9949
.9951
.9952
2.6
.9953
.9955
.9956
.9957
.9959
.9960
.9961
.9962
.9963
.9964
2.7
.9965
.9966
.9967
.9968
.9969
.9970
.9971
.9972
.9973
.9974
2.8
.9974
.9975
.9976
.9977
.9977
.9978
.9979
.9979
.9980
.9981
2.9
.9981
.9982
.9982
.9983
.9984
.9984
.9985
.9985
.9986
.9986
3.0
.9987
.9987
.9987
.9988
.9988
.9989
.9989
.9989
.9990
.9990
3.1
.9990
.9991
.9991
.9991
.9992
.9992
.9992
.9992
.9993
.9993
3.2
.9993
.9993
.9994
.9994
.9994
.9994
.9994
.9995
.9995
.9995
3.3
.9995
.9995
.9995
.9996
.9996
.9996
.9996
.9996
.9996
.9997
3.4
.9997
.9997
.9997
.9997
.9997
.9997
.9997
.9997
.9997
.9998
3.50 .9999
and
up
NOTE: For values of z above 3.49, use 0.9999 for the area.
*Use these common values that result from interpolation:
z score
Area
1.645
0.9500
2.575
0.9950
*
*
POSITIVE z Scores
Common Critical Values
Confidence
Critical
Level
Value
0.90
1.645
0.95
1.96
0
0.99
2.575
5014_Triola_endpapers 12/08/05 2:39 PM Page 7
Wyszukiwarka
Podobne podstrony:
Elementary Statistics 10e 5014 TriolaE2FS AppC
Elementary Statistics 10e 5014 TriolaE2FS AppA
Elementary Statistics 10e 5014 TriolaE2FS AppD
Elementary Statistics 10e 5014 TriolaE S Index
Elementary Statistics 10e 5014 Triola Pullout Card
Elementary Statistics 10e 5014 TriolaE2FS AppB
Elementary Statistics 10e 5014 TriolaE2FS APP opener
Elementary Statistics 10e 5014 TriolaE MultiM FMppi xxxv ds
Elementary Statistics 10e TriolaE S Creditspp855 856
Elementary Statistics 10e TriolaE S CH15pp758 766
Elementary Statistics 10e TriolaE S CH05pp198 243
Elementary Statistics 10e TriolaE S CH11pp588 633
Elementary Statistics 10e TriolaE S CH02pp040 073
Elementary Statistics 10e TriolaES FMppi xxxv
elements of statistical learning sol2
Wyk 02 Pneumatyczne elementy
więcej podobnych podstron