Appendix A: Tables
Table A-1
Binomial Probabilities
Table A-2
Standard Normal Distribution
Table A-3
t Distribution
Table A-4
Chi-Square Distribution
Table A-5
F Distribution
Table A-6
Critical Values of the Pearson Correlation Coefficient r
Table A-7
Critical Values for the Sign Test
Table A-8
Critical Values of T for the Wilcoxon Signed-Ranks Test
Table A-9
Critical Values of Spearman’s Rank Correlation Coefficient r
s
Table A-10
Critical Values for Number of Runs G
sx
2
d
768
5014_TriolaE/S_AppA 11/23/05 6:37 AM Page 768
Appendix A
769
NOTE: 01 represents a positive probability less than 0.0005.
(continued)
T
ABLE
A-1
Binomial Probabilities
p
n
x
.01
.05
.10
.20
.30
.40
.50
.60
.70
.80
.90
.95
.99
x
2
0
.980
.902
.810
.640
.490
.360
.250
.160
.090
.040
.010
.002
0+
0
1
.020
.095
.180
.320
.420
.480
.500
.480
.420
.320
.180
.095
.020
1
2
01
.002
.010
.040
.090
.160
.250
.360
.490
.640
.810
.902
.980
2
3
0
.970
.857
.729
.512
.343
.216
.125
.064
.027
.008
.001
0+
0+
0
1
.029
.135
.243
.384
.441
.432
.375
.288
.189
.096
.027
.007
0+
1
2
01
.007
.027
.096
.189
.288
.375
.432
.441
.384
.243
.135
.029
2
3
01
01
.001
.008
.027
.064
.125
.216
.343
.512
.729
.857
.970
3
4
0
.961
.815
.656
.410
.240
.130
.062
.026
.008
.002
01
01
01
0
1
.039
.171
.292
.410
.412
.346
.250
.154
.076
.026
.004
01
01
1
2
.001
.014
.049
.154
.265
.346
.375
.346
.265
.154
.049
.014
.001
2
3
01
01
.004
.026
.076
.154
.250
.346
.412
.410
.292
.171
.039
3
4
01
01
01
.002
.008
.026
.062
.130
.240
.410
.656
.815
.961
4
5
0
.951
.774
.590
.328
.168
.078
.031
.010
.002
01
01
01
01
0
1
.048
.204
.328
.410
.360
.259
.156
.077
.028
.006
01
01
01
1
2
.001
.021
.073
.205
.309
.346
.312
.230
.132
.051
.008
.001
01
2
3
01
.001
.008
.051
.132
.230
.312
.346
.309
.205
.073
.021
.001
3
4
01
01
01
.006
.028
.077
.156
.259
.360
.410
.328
.204
.048
4
5
01
01
01
01
.002
.010
.031
.078
.168
.328
.590
.774
.951
5
6
0
.941
.735
.531
.262
.118
.047
.016
.004
.001
01
01
01
01
0
1
.057
.232
.354
.393
.303
.187
.094
.037
.010
.002
01
01
01
1
2
.001
.031
.098
.246
.324
.311
.234
.138
.060
.015
.001
01
01
2
3
01
.002
.015
.082
.185
.276
.312
.276
.185
.082
.015
.002
01
3
4
01
01
.001
.015
.060
.138
.234
.311
.324
.246
.098
.031
.001
4
5
01
01
01
.002
.010
.037
.094
.187
.303
.393
.354
.232
.057
5
6
01
01
01
01
.001
.004
.016
.047
.118
.262
.531
.735
.941
6
7
0
.932
.698
.478
.210
.082
.028
.008
.002
01
01
01
01
01
0
1
.066
.257
.372
.367
.247
.131
.055
.017
.004
01
01
01
01
1
2
.002
.041
.124
.275
.318
.261
.164
.077
.025
.004
01
01
01
2
3
01
.004
.023
.115
.227
.290
.273
.194
.097
.029
.003
01
01
3
4
01
01
.003
.029
.097
.194
.273
.290
.227
.115
.023
.004
01
4
5
01
01
01
.004
.025
.077
.164
.261
.318
.275
.124
.041
.002
5
6
01
01
01
01
.004
.017
.055
.131
.247
.367
.372
.257
.066
6
7
01
01
01
01
01
.002
.008
.028
.082
.210
.478
.698
.932
7
8
0
.923
.663
.430
.168
.058
.017
.004
.001
01
01
01
01
01
0
1
.075
.279
.383
.336
.198
.090
.031
.008
.001
01
01
01
01
1
2
.003
.051
.149
.294
.296
.209
.109
.041
.010
.001
01
01
01
2
3
01
.005
.033
.147
.254
.279
.219
.124
.047
.009
01
01
01
3
4
01
01
.005
.046
.136
.232
.273
.232
.136
.046
.005
01
01
4
5
01
01
01
.009
.047
.124
.219
.279
.254
.147
.033
.005
01
5
6
01
01
01
.001
.010
.041
.109
.209
.296
.294
.149
.051
.003
6
7
01
01
01
01
.001
.008
.031
.090
.198
.336
.383
.279
.075
7
8
01
01
01
01
01
.001
.004
.017
.058
.168
.430
.663
.923
8
5014_TriolaE/S_AppA 11/23/05 6:37 AM Page 769

T
ABLE
A-1
Binomial Probabilities (continued)
p
n
x
.01
.05
.10
.20
.30
.40
.50
.60
.70
.80
.90
.95
.99
x
9
0
.914
.630
.387
.134
.040
.010
.002
01
01
01
01
01
01
0
1
.083
.299
.387
.302
.156
.060
.018
.004
01
01
01
01
01
1
2
.003
.063
.172
.302
.267
.161
.070
.021
.004
01
01
01
01
2
3
01
.008
.045
.176
.267
.251
.164
.074
.021
.003
01
01
01
3
4
01
.001
.007
.066
.172
.251
.246
.167
.074
.017
.001
01
01
4
5
01
01
.001
.017
.074
.167
.246
.251
.172
.066
.007
.001
01
5
6
01
01
01
.003
.021
.074
.164
.251
.267
.176
.045
.008
01
6
7
01
01
01
01
.004
.021
.070
.161
.267
.302
.172
.063
.003
7
8
01
01
01
01
01
.004
.018
.060
.156
.302
.387
.299
.083
8
9
01
01
01
01
01
01
.002
.010
.040
.134
.387
.630
.914
9
10
0
.904
.599
.349
.107
.028
.006
.001
01
01
01
01
01
01
0
1
.091
.315
.387
.268
.121
.040
.010
.002
01
01
01
01
01
1
2
.004
.075
.194
.302
.233
.121
.044
.011
.001
01
01
01
01
2
3
01
.010
.057
.201
.267
.215
.117
.042
.009
.001
01
01
01
3
4
01
.001
.011
.088
.200
.251
.205
.111
.037
.006
01
01
01
4
5
01
01
.001
.026
.103
.201
.246
.201
.103
.026
.001
01
01
5
6
01
01
01
.006
.037
.111
.205
.251
.200
.088
.011
.001
01
6
7
01
01
01
.001
.009
.042
.117
.215
.267
.201
.057
.010
01
7
8
01
01
01
01
.001
.011
.044
.121
.233
.302
.194
.075
.004
8
9
01
01
01
01
01
.002
.010
.040
.121
.268
.387
.315
.091
9
10
01
01
01
01
01
01
.001
.006
.028
.107
.349
.599
.904
10
11
0
.895
.569
.314
.086
.020
.004
01
01
01
01
01
01
01
0
1
.099
.329
.384
.236
.093
.027
.005
.001
01
01
01
01
01
1
2
.005
.087
.213
.295
.200
.089
.027
.005
.001
01
01
01
01
2
3
01
.014
.071
.221
.257
.177
.081
.023
.004
01
01
01
01
3
4
01
.001
.016
.111
.220
.236
.161
.070
.017
.002
01
01
01
4
5
01
01
.002
.039
.132
.221
.226
.147
.057
.010
01
01
01
5
6
01
01
01
.010
.057
.147
.226
.221
.132
.039
.002
01
01
6
7
01
01
01
.002
.017
.070
.161
.236
.220
.111
.016
.001
01
7
8
01
01
01
01
.004
.023
.081
.177
.257
.221
.071
.014
01
8
9
01
01
01
01
.001
.005
.027
.089
.200
.295
.213
.087
.005
9
10
01
01
01
01
01
.001
.005
.027
.093
.236
.384
.329
.099
10
11
01
01
01
01
01
01
01
.004
.020
.086
.314
.569
.895
11
12
0
.886
.540
.282
.069
.014
.002
01
01
01
01
01
01
01
0
1
.107
.341
.377
.206
.071
.017
.003
01
01
01
01
01
01
1
2
.006
.099
.230
.283
.168
.064
.016
.002
01
01
01
01
01
2
3
01
.017
.085
.236
.240
.142
.054
.012
.001
01
01
01
01
3
4
01
.002
.021
.133
.231
.213
.121
.042
.008
.001
01
01
01
4
5
01
01
.004
.053
.158
.227
.193
.101
.029
.003
01
01
01
5
6
01
01
01
.016
.079
.177
.226
.177
.079
.016
01
01
01
6
7
01
01
01
.003
.029
.101
.193
.227
.158
.053
.004
01
01
7
8
01
01
01
.001
.008
.042
.121
.213
.231
.133
.021
.002
01
8
9
01
01
01
01
.001
.012
.054
.142
.240
.236
.085
.017
01
9
10
01
01
01
01
01
.002
.016
.064
.168
.283
.230
.099
.006
10
11
01
01
01
01
01
01
.003
.017
.071
.206
.377
.341
.107
11
12
01
01
01
01
01
01
01
.002
.014
.069
.282
.540
.886
12
(continued)
NOTE: 01 represents a positive probability less than 0.0005.
5014_TriolaE/S_AppA 11/23/05 6:37 AM Page 770
T
ABLE
A-1
Binomial Probabilities (continued )
p
n
x
.01
.05
.10
.20
.30
.40
.50
.60
.70
.80
.90
.95
.99
x
13
0
.878
.513
.254
.055
.010
.001
01
01
01
01
01
01
01
0
1
.115
.351
.367
.179
.054
.011
.002
01
01
01
01
01
01
1
2
.007
.111
.245
.268
.139
.045
.010
.001
01
01
01
01
01
2
3
01
.021
.100
.246
.218
.111
.035
.006
.001
01
01
01
01
3
4
01
.003
.028
.154
.234
.184
.087
.024
.003
01
01
01
01
4
5
01
01
.006
.069
.180
.221
.157
.066
.014
.001
01
01
01
5
6
01
01
.001
.023
.103
.197
.209
.131
.044
.006
01
01
01
6
7
01
01
01
.006
.044
.131
.209
.197
.103
.023
.001
01
01
7
8
01
01
01
.001
.014
.066
.157
.221
.180
.069
.006
01
01
8
9
01
01
01
01
.003
.024
.087
.184
.234
.154
.028
.003
01
9
10
01
01
01
01
.001
.006
.035
.111
.218
.246
.100
.021
01
10
11
01
01
01
01
01
.001
.010
.045
.139
.268
.245
.111
.007
11
12
01
01
01
01
01
01
.002
.011
.054
.179
.367
.351
.115
12
13
01
01
01
01
01
01
01
.001
.010
.055
.254
.513
.878
13
14
0
.869
.488
.229
.044
.007
.001
01
01
01
01
01
01
01
0
1
.123
.359
.356
.154
.041
.007
.001
01
01
01
01
01
01
1
2
.008
.123
.257
.250
.113
.032
.006
.001
01
01
01
01
01
2
3
01
.026
.114
.250
.194
.085
.022
.003
01
01
01
01
01
3
4
01
.004
.035
.172
.229
.155
.061
.014
.001
01
01
01
01
4
5
01
01
.008
.086
.196
.207
.122
.041
.007
01
01
01
01
5
6
01
01
.001
.032
.126
.207
.183
.092
.023
.002
01
01
01
6
7
01
01
01
.009
.062
.157
.209
.157
.062
.009
01
01
01
7
8
01
01
01
.002
.023
.092
.183
.207
.126
.032
.001
01
01
8
9
01
01
01
01
.007
.041
.122
.207
.196
.086
.008
01
01
9
10
01
01
01
01
.001
.014
.061
.155
.229
.172
.035
.004
01
10
11
01
01
01
01
01
.003
.022
.085
.194
.250
.114
.026
01
11
12
01
01
01
01
01
.001
.006
.032
.113
.250
.257
.123
.008
12
13
01
01
01
01
01
01
.001
.007
.041
.154
.356
.359
.123
13
14
01
01
01
01
01
01
01
.001
.007
.044
.229
.488
.869
14
15
0
.860
.463
.206
.035
.005
01
01
01
01
01
01
01
01
0
1
.130
.366
.343
.132
.031
.005
01
01
01
01
01
01
01
1
2
.009
.135
.267
.231
.092
.022
.003
01
01
01
01
01
01
2
3
01
.031
.129
.250
.170
.063
.014
.002
01
01
01
01
01
3
4
01
.005
.043
.188
.219
.127
.042
.007
.001
01
01
01
01
4
5
01
.001
.010
.103
.206
.186
.092
.024
.003
01
01
01
01
5
6
01
01
.002
.043
.147
.207
.153
.061
.012
.001
01
01
01
6
7
01
01
01
.014
.081
.177
.196
.118
.035
.003
01
01
01
7
8
01
01
01
.003
.035
.118
.196
.177
.081
.014
01
01
01
8
9
01
01
01
.001
.012
.061
.153
.207
.147
.043
.002
01
01
9
10
01
01
01
01
.003
.024
.092
.186
.206
.103
.010
.001
01
10
11
01
01
01
01
.001
.007
.042
.127
.219
.188
.043
.005
01
11
12
01
01
01
01
01
.002
.014
.063
.170
.250
.129
.031
01
12
13
01
01
01
01
01
01
.003
.022
.092
.231
.267
.135
.009
13
14
01
01
01
01
01
01
01
.005
.031
.132
.343
.366
.130
14
15
01
01
01
01
01
01
01
01
.005
.035
.206
.463
.860
15
NOTE: 0
1
represents a positive probability less than 0.0005.
From Frederick C. Mosteller, Robert E. K. Rourke, and George B. Thomas, Jr., Probability with Statistical Applications, 2nd ed., © 1970
Addison-Wesley Publishing Co., Reading, MA. Reprinted with permission.
5014_TriolaE/S_AppA 11/23/05 6:37 AM Page 771
772
A
PPENDIX
A
0
z
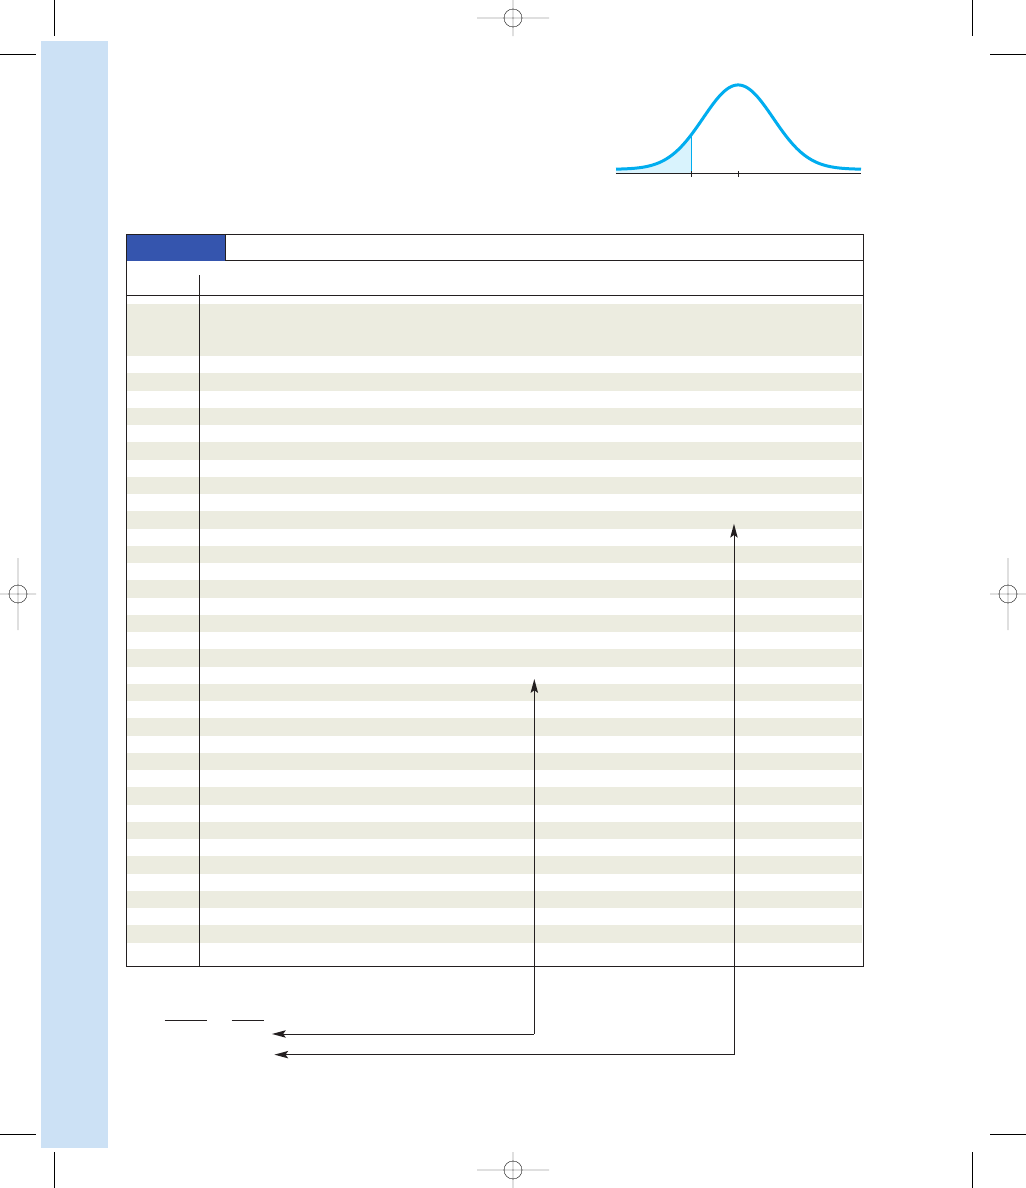
NEGATIVE z Scores
T
ABLE
A-2
Standard Normal (z) Distribution: Cumulative Area from the LEFT
z
.00
.01
.02
.03
.04
.05
.06
.07
.08
.09
2
3.50
and
lower
.0001
2
3.4
.0003
.0003
.0003
.0003
.0003
.0003
.0003
.0003
.0003
.0002
2
3.3
.0005
.0005
.0005
.0004
.0004
.0004
.0004
.0004
.0004
.0003
2
3.2
.0007
.0007
.0006
.0006
.0006
.0006
.0006
.0005
.0005
.0005
2
3.1
.0010
.0009
.0009
.0009
.0008
.0008
.0008
.0008
.0007
.0007
2
3.0
.0013
.0013
.0013
.0012
.0012
.0011
.0011
.0011
.0010
.0010
2
2.9
.0019
.0018
.0018
.0017
.0016
.0016
.0015
.0015
.0014
.0014
2
2.8
.0026
.0025
.0024
.0023
.0023
.0022
.0021
.0021
.0020
.0019
2
2.7
.0035
.0034
.0033
.0032
.0031
.0030
.0029
.0028
.0027
.0026
2
2.6
.0047
.0045
.0044
.0043
.0041
.0040
.0039
.0038
.0037
.0036
2
2.5
.0062
.0060
.0059
.0057
.0055
.0054
.0052
.0051
.0049
.0048
2
2.4
.0082
.0080
.0078
.0075
.0073
.0071
.0069
.0068
.0066
.0064
2
2.3
.0107
.0104
.0102
.0099
.0096
.0094
.0091
.0089
.0087
.0084
2
2.2
.0139
.0136
.0132
.0129
.0125
.0122
.0119
.0116
.0113
.0110
2
2.1
.0179
.0174
.0170
.0166
.0162
.0158
.0154
.0150
.0146
.0143
2
2.0
.0228
.0222
.0217
.0212
.0207
.0202
.0197
.0192
.0188
.0183
2
1.9
.0287
.0281
.0274
.0268
.0262
.0256
.0250
.0244
.0239
.0233
2
1.8
.0359
.0351
.0344
.0336
.0329
.0322
.0314
.0307
.0301
.0294
2
1.7
.0446
.0436
.0427
.0418
.0409
.0401
.0392
.0384
.0375
.0367
2
1.6
.0548
.0537
.0526
.0516
.0505
.0495
.0485
.0475
.0465
.0455
2
1.5
.0668
.0655
.0643
.0630
.0618
.0606
.0594
.0582
.0571
.0559
2
1.4
.0808
.0793
.0778
.0764
.0749
.0735
.0721
.0708
.0694
.0681
2
1.3
.0968
.0951
.0934
.0918
.0901
.0885
.0869
.0853
.0838
.0823
2
1.2
.1151
.1131
.1112
.1093
.1075
.1056
.1038
.1020
.1003
.0985
2
1.1
.1357
.1335
.1314
.1292
.1271
.1251
.1230
.1210
.1190
.1170
2
1.0
.1587
.1562
.1539
.1515
.1492
.1469
.1446
.1423
.1401
.1379
2
0.9
.1841
.1814
.1788
.1762
.1736
.1711
.1685
.1660
.1635
.1611
2
0.8
.2119
.2090
.2061
.2033
.2005
.1977
.1949
.1922
.1894
.1867
2
0.7
.2420
.2389
.2358
.2327
.2296
.2266
.2236
.2206
.2177
.2148
2
0.6
.2743
.2709
.2676
.2643
.2611
.2578
.2546
.2514
.2483
.2451
2
0.5
.3085
.3050
.3015
.2981
.2946
.2912
.2877
.2843
.2810
.2776
2
0.4
.3446
.3409
.3372
.3336
.3300
.3264
.3228
.3192
.3156
.3121
2
0.3
.3821
.3783
.3745
.3707
.3669
.3632
.3594
.3557
.3520
.3483
2
0.2
.4207
.4168
.4129
.4090
.4052
.4013
.3974
.3936
.3897
.3859
2
0.1
.4602
.4562
.4522
.4483
.4443
.4404
.4364
.4325
.4286
.4247
2
0.0
.5000
.4960
.4920
.4880
.4840
.4801
.4761
.4721
.4681
.4641
NOTE: For values of z below 23.49, use 0.0001 for the area.
*Use these common values that result from interpolation:
z score
Area
2
1.645
0.0500
2
2.575
0.0050
*
*
5014_TriolaE/S_AppA 11/23/05 6:37 AM Page 772
Appendix A
773
0
z
NOTE: For values of z above 3.49, use 0.9999 for the area.
*Use these common values that result from interpolation:
z score
Area
1.645
0.9500
2.575
0.9950
Common Critical Values
Confidence
Critical
Level
Value
0.90
1.645
0.95
1.96
0.99
2.575
POSITIVE z Scores
T
ABLE
A-2
(continued ) Cumulative Area from the LEFT
z
.00
.01
.02
.03
.04
.05
.06
.07
.08
.09
0.0
.5000
.5040
.5080
.5120
.5160
.5199
.5239
.5279
.5319
.5359
0.1
.5398
.5438
.5478
.5517
.5557
.5596
.5636
.5675
.5714
.5753
0.2
.5793
.5832
.5871
.5910
.5948
.5987
.6026
.6064
.6103
.6141
0.3
.6179
.6217
.6255
.6293
.6331
.6368
.6406
.6443
.6480
.6517
0.4
.6554
.6591
.6628
.6664
.6700
.6736
.6772
.6808
.6844
.6879
0.5
.6915
.6950
.6985
.7019
.7054
.7088
.7123
.7157
.7190
.7224
0.6
.7257
.7291
.7324
.7357
.7389
.7422
.7454
.7486
.7517
.7549
0.7
.7580
.7611
.7642
.7673
.7704
.7734
.7764
.7794
.7823
.7852
0.8
.7881
.7910
.7939
.7967
.7995
.8023
.8051
.8078
.8106
.8133
0.9
.8159
.8186
.8212
.8238
.8264
.8289
.8315
.8340
.8365
.8389
1.0
.8413
.8438
.8461
.8485
.8508
.8531
.8554
.8577
.8599
.8621
1.1
.8643
.8665
.8686
.8708
.8729
.8749
.8770
.8790
.8810
.8830
1.2
.8849
.8869
.8888
.8907
.8925
.8944
.8962
.8980
.8997
.9015
1.3
.9032
.9049
.9066
.9082
.9099
.9115
.9131
.9147
.9162
.9177
1.4
.9192
.9207
.9222
.9236
.9251
.9265
.9279
.9292
.9306
.9319
1.5
.9332
.9345
.9357
.9370
.9382
.9394
.9406
.9418
.9429
.9441
1.6
.9452
.9463
.9474
.9484
.9495
.9505
.9515
.9525
.9535
.9545
1.7
.9554
.9564
.9573
.9582
.9591
.9599
.9608
.9616
.9625
.9633
1.8
.9641
.9649
.9656
.9664
.9671
.9678
.9686
.9693
.9699
.9706
1.9
.9713
.9719
.9726
.9732
.9738
.9744
.9750
.9756
.9761
.9767
2.0
.9772
.9778
.9783
.9788
.9793
.9798
.9803
.9808
.9812
.9817
2.1
.9821
.9826
.9830
.9834
.9838
.9842
.9846
.9850
.9854
.9857
2.2
.9861
.9864
.9868
.9871
.9875
.9878
.9881
.9884
.9887
.9890
2.3
.9893
.9896
.9898
.9901
.9904
.9906
.9909
.9911
.9913
.9916
2.4
.9918
.9920
.9922
.9925
.9927
.9929
.9931
.9932
.9934
.9936
2.5
.9938
.9940
.9941
.9943
.9945
.9946
.9948
.9949
.9951
.9952
2.6
.9953
.9955
.9956
.9957
.9959
.9960
.9961
.9962
.9963
.9964
2.7
.9965
.9966
.9967
.9968
.9969
.9970
.9971
.9972
.9973
.9974
2.8
.9974
.9975
.9976
.9977
.9977
.9978
.9979
.9979
.9980
.9981
2.9
.9981
.9982
.9982
.9983
.9984
.9984
.9985
.9985
.9986
.9986
3.0
.9987
.9987
.9987
.9988
.9988
.9989
.9989
.9989
.9990
.9990
3.1
.9990
.9991
.9991
.9991
.9992
.9992
.9992
.9992
.9993
.9993
3.2
.9993
.9993
.9994
.9994
.9994
.9994
.9994
.9995
.9995
.9995
3.3
.9995
.9995
.9995
.9996
.9996
.9996
.9996
.9996
.9996
.9997
3.4
.9997
.9997
.9997
.9997
.9997
.9997
.9997
.9997
.9997
.9998
3.50
.9999
and
up
*
*
5014_TriolaE/S_AppA 11/23/05 6:37 AM Page 773
Critical t value
(negative)
a
Left tail
Critical t value
(positive)
a
Right tail
Critical t value
(positive)
Critical t value
(negative)
a
/
2
a
/
2
Two tails
T
ABLE
A-3
t Distribution: Critical t Values
Area in One Tail
0.005
0.01
0.025
0.05
0.10
Degrees of
Area in Two Tails
Freedom
0.01
0.02
0.05
0.10
0.20
1
63.657
31.821
12.706
6.314
3.078
2
9.925
6.965
4.303
2.920
1.886
3
5.841
4.541
3.182
2.353
1.638
4
4.604
3.747
2.776
2.132
1.533
5
4.032
3.365
2.571
2.015
1.476
6
3.707
3.143
2.447
1.943
1.440
7
3.499
2.998
2.365
1.895
1.415
8
3.355
2.896
2.306
1.860
1.397
9
3.250
2.821
2.262
1.833
1.383
10
3.169
2.764
2.228
1.812
1.372
11
3.106
2.718
2.201
1.796
1.363
12
3.055
2.681
2.179
1.782
1.356
13
3.012
2.650
2.160
1.771
1.350
14
2.977
2.624
2.145
1.761
1.345
15
2.947
2.602
2.131
1.753
1.341
16
2.921
2.583
2.120
1.746
1.337
17
2.898
2.567
2.110
1.740
1.333
18
2.878
2.552
2.101
1.734
1.330
19
2.861
2.539
2.093
1.729
1.328
20
2.845
2.528
2.086
1.725
1.325
21
2.831
2.518
2.080
1.721
1.323
22
2.819
2.508
2.074
1.717
1.321
23
2.807
2.500
2.069
1.714
1.319
24
2.797
2.492
2.064
1.711
1.318
25
2.787
2.485
2.060
1.708
1.316
26
2.779
2.479
2.056
1.706
1.315
27
2.771
2.473
2.052
1.703
1.314
28
2.763
2.467
2.048
1.701
1.313
29
2.756
2.462
2.045
1.699
1.311
30
2.750
2.457
2.042
1.697
1.310
31
2.744
2.453
2.040
1.696
1.309
32
2.738
2.449
2.037
1.694
1.309
34
2.728
2.441
2.032
1.691
1.307
36
2.719
2.434
2.028
1.688
1.306
38
2.712
2.429
2.024
1.686
1.304
40
2.704
2.423
2.021
1.684
1.303
45
2.690
2.412
2.014
1.679
1.301
50
2.678
2.403
2.009
1.676
1.299
55
2.668
2.396
2.004
1.673
1.297
60
2.660
2.390
2.000
1.671
1.296
65
2.654
2.385
1.997
1.669
1.295
70
2.648
2.381
1.994
1.667
1.294
75
2.643
2.377
1.992
1.665
1.293
80
2.639
2.374
1.990
1.664
1.292
90
2.632
2.368
1.987
1.662
1.291
100
2.626
2.364
1.984
1.660
1.290
200
2.601
2.345
1.972
1.653
1.286
300
2.592
2.339
1.968
1.650
1.284
400
2.588
2.336
1.966
1.649
1.284
500
2.586
2.334
1.965
1.648
1.283
750
2.582
2.331
1.963
1.647
1.283
1000
2.581
2.330
1.962
1.646
1.282
2000
2.578
2.328
1.961
1.646
1.282
Large
2.576
2.326
1.960
1.645
1.282
5014_TriolaE/S_AppA 11/23/05 6:37 AM Page 774
Appendix A
775
T
ABLE
A-4
Chi-Square (x
2
) Distribution
Area to the Right of the Critical Value
Degrees
of
Freedom
0.995
0.99
0.975
0.95
0.90
0.10
0.05
0.025
0.01
0.005
1
—
—
0.001
0.004
0.016
2.706
3.841
5.024
6.635
7.879
2
0.010
0.020
0.051
0.103
0.211
4.605
5.991
7.378
9.210
10.597
3
0.072
0.115
0.216
0.352
0.584
6.251
7.815
9.348
11.345
12.838
4
0.207
0.297
0.484
0.711
1.064
7.779
9.488
11.143
13.277
14.860
5
0.412
0.554
0.831
1.145
1.610
9.236
11.071
12.833
15.086
16.750
6
0.676
0.872
1.237
1.635
2.204
10.645
12.592
14.449
16.812
18.548
7
0.989
1.239
1.690
2.167
2.833
12.017
14.067
16.013
18.475
20.278
8
1.344
1.646
2.180
2.733
3.490
13.362
15.507
17.535
20.090
21.955
9
1.735
2.088
2.700
3.325
4.168
14.684
16.919
19.023
21.666
23.589
10
2.156
2.558
3.247
3.940
4.865
15.987
18.307
20.483
23.209
25.188
11
2.603
3.053
3.816
4.575
5.578
17.275
19.675
21.920
24.725
26.757
12
3.074
3.571
4.404
5.226
6.304
18.549
21.026
23.337
26.217
28.299
13
3.565
4.107
5.009
5.892
7.042
19.812
22.362
24.736
27.688
29.819
14
4.075
4.660
5.629
6.571
7.790
21.064
23.685
26.119
29.141
31.319
15
4.601
5.229
6.262
7.261
8.547
22.307
24.996
27.488
30.578
32.801
16
5.142
5.812
6.908
7.962
9.312
23.542
26.296
28.845
32.000
34.267
17
5.697
6.408
7.564
8.672
10.085
24.769
27.587
30.191
33.409
35.718
18
6.265
7.015
8.231
9.390
10.865
25.989
28.869
31.526
34.805
37.156
19
6.844
7.633
8.907
10.117
11.651
27.204
30.144
32.852
36.191
38.582
20
7.434
8.260
9.591
10.851
12.443
28.412
31.410
34.170
37.566
39.997
21
8.034
8.897
10.283
11.591
13.240
29.615
32.671
35.479
38.932
41.401
22
8.643
9.542
10.982
12.338
14.042
30.813
33.924
36.781
40.289
42.796
23
9.260
10.196
11.689
13.091
14.848
32.007
35.172
38.076
41.638
44.181
24
9.886
10.856
12.401
13.848
15.659
33.196
36.415
39.364
42.980
45.559
25
10.520
11.524
13.120
14.611
16.473
34.382
37.652
40.646
44.314
46.928
26
11.160
12.198
13.844
15.379
17.292
35.563
38.885
41.923
45.642
48.290
27
11.808
12.879
14.573
16.151
18.114
36.741
40.113
43.194
46.963
49.645
28
12.461
13.565
15.308
16.928
18.939
37.916
41.337
44.461
48.278
50.993
29
13.121
14.257
16.047
17.708
19.768
39.087
42.557
45.722
49.588
52.336
30
13.787
14.954
16.791
18.493
20.599
40.256
43.773
46.979
50.892
53.672
40
20.707
22.164
24.433
26.509
29.051
51.805
55.758
59.342
63.691
66.766
50
27.991
29.707
32.357
34.764
37.689
63.167
67.505
71.420
76.154
79.490
60
35.534
37.485
40.482
43.188
46.459
74.397
79.082
83.298
88.379
91.952
70
43.275
45.442
48.758
51.739
55.329
85.527
90.531
95.023
100.425
104.215
80
51.172
53.540
57.153
60.391
64.278
96.578
101.879
106.629
112.329
116.321
90
59.196
61.754
65.647
69.126
73.291
107.565
113.145
118.136
124.116
128.299
100
67.328
70.065
74.222
77.929
82.358
118.498
124.342
129.561
135.807
140.169
From Donald B. Owen, Handbook of Statistical Tables, ©1962 Addison-Wesley Publishing Co., Reading, MA. Reprinted with permis-
sion of the publisher.
Degrees of Freedom
n 2 1
for confidence intervals or hypothesis tests with a standard deviation or variance
k 2 1
for multinomial experiments or goodness-of-fit with k categories
(r 2 1)(c 2 1)
for contingency tables with r rows and c columns
k 2 1
for Kruskal-Wallis test with k samples
5014_TriolaE/S_AppA 11/23/05 6:37 AM Page 775
776
A
PPENDIX
A
T
ABLE
A-5
F
Distribution (
a5
0.025 in the right tail)
Numerator degrees of freedom (df
1
)
123456789
1
647.79
799.50
864.16
899.58
921.85
937.11
948.22
956.66
963.28
2
38.506
39.000
39.165
3
9.248
3
9.298
39.331
39.335
39.373
39.387
3
17.443
16.044
15.439
1
5.101
1
4.885
14.735
14.624
14.540
14.473
4
12.218
10.649
9.9792
9.6045
9.3645
9.1973
9.0741
8.9796
8
.9047
5
10.007
8.4336
7.7636
7.3879
7.1464
6.9777
6.8531
6.7572
6
.6811
6
8.8131
7.2599
6.5988
6.2272
5.9876
5.8198
5.6955
5.5996
5
.5234
7
8.0727
6.5415
5.8898
5.5226
5.2852
5.1186
4.9949
4.8993
4
.8232
8
7.5709
6.0595
5.4160
5.0526
4.8173
4.6517
4.5286
4.4333
4
.3572
9
7.2093
5.7147
5.0781
4.7181
4.4844
4.3197
4.1970
4.1020
4
.0260
10
6.9367
5.4564
4.8256
4.4683
4.2361
4.0721
3.9498
3.8549
3
.7790
11
6.7241
5.2559
4.6300
4.2751
4.0440
3.8807
3.7586
3.6638
3
.5879
12
6.5538
5.0959
4.4742
4.1212
3.8911
3.7283
3.6065
3.5118
3
.4358
13
6.4143
4.9653
4.3472
3.9959
3.7667
3.6043
3.4827
3.3880
3
.3120
14
6.2979
4.8567
4.2417
3.8919
3.6634
3.5014
3.3799
3.2853
3
.2093
15
6.1995
4.7650
4.1528
3.8043
3.5764
3.4147
3.2934
3.1987
3
.1227
16
6.1151
4.6867
4.0768
3.7294
3.5021
3.3406
3.2194
3.1248
3
.0488
17
6.0420
4.6189
4.0112
3.6648
3.4379
3.2767
3.1556
3.0610
2
.9849
18
5.9781
4.5597
3.9539
3.6083
3.3820
3.2209
3.0999
3.0053
2
.9291
19
5.9216
4.5075
3.9034
3.5587
3.3327
3.1718
3.0509
2.9563
2
.8801
20
5.8715
4.4613
3.8587
3.5147
3.2891
3.1283
3.0074
2.9128
2
.8365
21
5.8266
4.4199
3.8188
3.4754
3.2501
3.0895
2.9686
2.8740
2
.7977
22
5.7863
4.3828
3.7829
3.4401
3.2151
3.0546
2.9338
2.8392
2
.7628
23
5.7498
4.3492
3.7505
3.4083
3.1835
3.0232
2.9023
2.8077
2
.7313
24
5.7166
4.3187
3.7211
3.3794
3.1548
2.9946
2.8738
2.7791
2
.7027
25
5.6864
4.2909
3.6943
3.3530
3.1287
2.9685
2.8478
2.7531
2
.6766
26
5.6586
4.2655
3.6697
3.3289
3.1048
2.9447
2.8240
2.7293
2
.6528
27
5.6331
4.2421
3.6472
3.3067
3.0828
2.9228
2.8021
2.7074
2
.6309
28
5.6096
4.2205
3.6264
3.2863
3.0626
2.9027
2.7820
2.6872
2
.6106
29
5.5878
4.2006
3.6072
3.2674
3.0438
2.8840
2.7633
2.6686
2
.5919
30
5.5675
4.1821
3.5894
3.2499
3.0265
2.8667
2.7460
2.6513
2
.5746
40
5.4239
4.0510
3.4633
3.1261
2.9037
2.7444
2.6238
2.5289
2
.4519
60
5.2856
3.9253
3.3425
3.0077
2.7863
2.6274
2.5068
2.4117
2
.3344
120
5.1523
3.8046
3.2269
2.8943
2.6740
2.5154
2.3948
2.2994
2
.2217
`
5.0239
3.6889
3.1161
2.7858
2.5665
2.4082
2.2875
2.1918
2
.1136
F
0
.
025
Denominator degrees of freedom (df
2
)
5014_TriolaE/S_AppA 11/23/05 6:37 AM Page 776
T
ABLE
A-5
F
Distribution (
a5
0.025 in the right tail) (
continued
)
Numerator degrees of freedom (df
1
)
10
12
15
20
24
30
40
60
120
`
1
968.63
976.71
984.87
993.10
997.25
1001.4
1005.6
1009.8
1014.0
1018.3
2
39.398
39.415
39.431
39.448
39.456
39.465
39.473
39.481
39.490
39.498
3
14.419
14.337
14.253
14.167
14.124
14.081
14.037
13.992
13.947
13.902
4
8.8439
8.7512
8.6565
8.5599
8.5109
8.4613
8.4111
8.3604
8.3092
8.2573
5
6.6192
6.5245
6.4277
6.3286
6.2780
6.2269
6.1750
6.1225
6.0693
6.0153
6
5.4613
5.3662
5.2687
5.1684
5.1172
5.0652
5.0125
4.9589
4.9044
4.8491
7
4.7611
4.6658
4.5678
4.4667
4.4150
4.3624
4.3089
4.2544
4.1989
4.1423
8
4.2951
4.1997
4.1012
3.9995
3.9472
3.8940
3.8398
3.7844
3.7279
3.6702
9
3.9639
3.8682
3.7694
3.6669
3.6142
3.5604
3.5055
3.4493
3.3918
3.3329
10
3.7168
3.6209
3.5217
3.4185
3.3654
3.3110
3.2554
3.1984
3.1399
3.0798
11
3.5257
3.4296
3.3299
3.2261
3.1725
3.1176
3.0613
3.0035
2.9441
2.8828
12
3.3736
3.2773
3.1772
3.0728
3.0187
2.9633
2.9063
2.8478
2.7874
2.7249
13
3.2497
3.1532
3.0527
2.9477
2.8932
2.8372
2.7797
2.7204
2.6590
2.5955
14
3.1469
3.0502
2.9493
2.8437
2.7888
2.7324
2.6742
2.6142
2.5519
2.4872
15
3.0602
2.9633
2.8621
2.7559
2.7006
2.6437
2.5850
2.5242
2.4611
2.3953
16
2.9862
2.8890
2.7875
2.6808
2.6252
2.5678
2.5085
2.4471
2.3831
2.3163
17
2.9222
2.8249
2.7230
2.6158
2.5598
2.5020
2.4422
2.3801
2.3153
2.2474
18
2.8664
2.7689
2.6667
2.5590
2.5027
2.4445
2.3842
2.3214
2.2558
2.1869
19
2.8172
2.7196
2.6171
2.5089
2.4523
2.3937
2.3329
2.2696
2.2032
2.1333
20
2.7737
2.6758
2.5731
2.4645
2.4076
2.3486
2.2873
2.2234
2.1562
2.0853
21
2.7348
2.6368
2.5338
2.4247
2.3675
2.3082
2.2465
2.1819
2.1141
2.0422
22
2.6998
2.6017
2.4984
2.3890
2.3315
2.2718
2.2097
2.1446
2.0760
2.0032
23
2.6682
2.5699
2.4665
2.3567
2.2989
2.2389
2.1763
2.1107
2.0415
1.9677
24
2.6396
2.5411
2.4374
2.3273
2.2693
2.2090
2.1460
2.0799
2.0099
1.9353
25
2.6135
2.5149
2.4110
2.3005
2.2422
2.1816
2.1183
2.0516
1.9811
1.9055
26
2.5896
2.4908
2.3867
2.2759
2.2174
2.1565
2.0928
2.0257
1.9545
1.8781
27
2.5676
2.4688
2.3644
2.2533
2.1946
2.1334
2.0693
2.0018
1.9299
1.8527
28
2.5473
2.4484
2.3438
2.2324
2.1735
2.1121
2.0477
1.9797
1.9072
1.8291
29
2.5286
2.4295
2.3248
2.2131
2.1540
2.0923
2.0276
1.9591
1.8861
1.8072
30
2.5112
2.4120
2.3072
2.1952
2.1359
2.0739
2.0089
1.9400
1.8664
1.7867
40
2.3882
2.2882
2.1819
2.0677
2.0069
1.9429
1.8752
1.8028
1.7242
1.6371
60
2.2702
2.1692
2.0613
1.9445
1.8817
1.8152
1.7440
1.6668
1.5810
1.4821
120
2.1570
2.0548
1.9450
1.8249
1.7597
1.6899
1.6141
1.5299
1.4327
1.3104
`
2.0483
1.9447
1.8326
1.7085
1.6402
1.5660
1.4835
1.3883
1.2684
1.0000
From Maxine Merrington and Catherine M. Thompson, “T
ables of Per
centage Points of the Inverted Beta (
F
)
Distribution,”
Biometrika 33
(1943): 80–84. Reproduced with permission of the Biometrika T
rustees.
(continued
)
Denominator degrees of freedom (df
2
)
Appendix A
777
5014_TriolaE/S_AppA 11/23/05 6:37 AM Page 777
778
A
PPENDIX
A
F
0
.
05
T
ABLE
A-5
F
Distribution (
a5
0.05 in the right tail)
Numerator degrees of freedom (df
1
)
123456789
1
161.45
199.50
215.71
2
24.58
230.16
2
33.99
236.77
238.88
240.54
2
18.513
19.000
19.164
19.247
19.296
19.330
1
9.353
19.371
1
9.385
3
10.128
9.5521
9.2766
9.1172
9.0135
8.9406
8.8867
8.8452
8
.8123
4
7.7086
6.9443
6.5914
6.3882
6.2561
6.1631
6.0942
6.0410
6
.9988
5
6.6079
5.7861
5.4095
5.1922
5.0503
4.9503
4.8759
4.8183
4
.7725
6
5.9874
5.1433
4.7571
4.5337
4.3874
4.2839
4.2067
4.1468
4
.0990
7
5.5914
4.7374
4.3468
4.1203
3.9715
3.8660
3.7870
3.7257
3
.6767
8
5.3177
4.4590
4.0662
3.8379
3.6875
3.5806
3.5005
3.4381
3
.3881
9
5.1174
4.2565
3.8625
3.6331
3.4817
3.3738
3.2927
3.2296
3
.1789
10
4.9646
4.1028
3.7083
3.4780
3.3258
3.2172
3.1355
3.0717
3
.0204
11
4.8443
3.9823
3.5874
3.3567
3.2039
3.0946
3.0123
2.9480
2
.8962
12
4.7472
3.8853
3.4903
3.2592
3.1059
2.9961
2.9134
2.8486
2
.7964
13
4.6672
3.8056
3.4105
3.1791
3.0254
2.9153
2.8321
2.7669
2
.7144
14
4.6001
3.7389
3.3439
3.1122
2.9582
2.8477
2.7642
2.6987
2
.6458
15
4.5431
3.6823
3.2874
3.0556
2.9013
2.7905
2.7066
2.6408
2
.5876
16
4.4940
3.6337
3.2389
3.0069
2.8524
2.7413
2.6572
2.5911
2
.5377
17
4.4513
3.5915
3.1968
2.9647
2.8100
2.6987
2.6143
2.5480
2
.4943
18
4.4139
3.5546
3.1599
2.9277
2.7729
2.6613
2.5767
2.5102
2
.4563
19
4.3807
3.5219
3.1274
2.8951
2.7401
2.6283
2.5435
2.4768
2
.4227
20
4.3512
3.4928
3.0984
2.8661
2.7109
2.5990
2.5140
2.4471
2
.3928
21
4.3248
3.4668
3.0725
2.8401
2.6848
2.5727
2.4876
2.4205
2
.3660
22
4.3009
3.4434
3.0491
2.8167
2.6613
2.5491
2.4638
2.3965
2
.3419
23
4.2793
3.4221
3.0280
2.7955
2.6400
2.5277
2.4422
2.3748
2
.3201
24
4.2597
3.4028
3.0088
2.7763
2.6207
2.5082
2.4226
2.3551
2
.3002
25
4.2417
3.3852
2.9912
2.7587
2.6030
2.4904
2.4047
2.3371
2
.2821
26
4.2252
3.3690
2.9752
2.7426
2.5868
2.4741
2.3883
2.3205
2
.2655
27
4.2100
3.3541
2.9604
2.7278
2.5719
2.4591
2.3732
2.3053
2
.2501
28
4.1960
3.3404
2.9467
2.7141
2.5581
2.4453
2.3593
2.2913
2
.2360
29
4.1830
3.3277
2.9340
2.7014
2.5454
2.4324
2.3463
2.2783
2
.2229
30
4.1709
3.3158
2.9223
2.6896
2.5336
2.4205
2.3343
2.2662
2
.2107
40
4.0847
3.2317
2.8387
2.6060
2.4495
2.3359
2.2490
2.1802
2
.1240
60
4.0012
3.1504
2.7581
2.5252
2.3683
2.2541
2.1665
2.0970
2
.0401
120
3.9201
3.0718
2.6802
2.4472
2.2899
2.1750
2.0868
2.0164
1
.9588
`
3.8415
2.9957
2.6049
2.3719
2.2141
2.0986
2.0096
1.9384
1
.8799
(continued)
Denominator degrees of freedom (df
2
)
5014_TriolaE/S_AppA 11/23/05 6:37 AM Page 778
T
ABLE
A-5
F
Distribution (
a5
0.05 in the right tail)
(continued)
Numerator degrees of freedom (df
1
)
10
12
15
20
24
30
40
60
120
`
1
241.88
243.91
245.95
248.01
249.05
250.10
251.14
252.20
253.25
2
54.31
2
19.396
19.413
19.429
19.446
19.454
19.462
19.471
19.479
19.487
19.496
3
8.7855
8.7446
8.7029
8.6602
8.6385
8.6166
8.5944
8.5720
8.5494
8.5264
4
5.9644
5.9117
5.8578
5.8025
5.7744
5.7459
5.7170
5.6877
5.6581
5.6281
5
4.7351
4.6777
4.6188
4.5581
4.5272
4.4957
4.4638
4.4314
4.3985
4.3650
6
4.0600
3.9999
3.9381
3.8742
3.8415
3.8082
3.7743
3.7398
3.7047
3.6689
7
3.6365
3.5747
3.5107
3.4445
3.4105
3.3758
3.3404
3.3043
3.2674
3.2298
8
3.3472
3.2839
3.2184
3.1503
3.1152
3.0794
3.0428
3.0053
2.9669
2.9276
9
3.1373
3.0729
3.0061
2.9365
2.9005
2.8637
2.8259
2.7872
2.7475
2.7067
10
2.9782
2.9130
2.8450
2.7740
2.7372
2.6996
2.6609
2.6211
2.5801
2.5379
11
2.8536
2.7876
2.7186
2.6464
2.6090
2.5705
2.5309
2.4901
2.4480
2.4045
12
2.7534
2.6866
2.6169
2.5436
2.5055
2.4663
2.4259
2.3842
2.3410
2.2962
13
2.6710
2.6037
2.5331
2.4589
2.4202
2.3803
2.3392
2.2966
2.2524
2.2064
14
2.6022
2.5342
2.4630
2.3879
2.3487
2.3082
2.2664
2.2229
2.1778
2.1307
15
2.5437
2.4753
2.4034
2.3275
2.2878
2.2468
2.2043
2.1601
2.1141
2.0658
16
2.4935
2.4247
2.3522
2.2756
2.2354
2.1938
2.1507
2.1058
2.0589
2.0096
17
2.4499
2.3807
2.3077
2.2304
2.1898
2.1477
2.1040
2.0584
2.0107
1.9604
18
2.4117
2.3421
2.2686
2.1906
2.1497
2.1071
2.0629
2.0166
1.9681
1.9168
19
2.3779
2.3080
2.2341
2.1555
2.1141
2.0712
2.0264
1.9795
1.9302
1.8780
20
2.3479
2.2776
2.2033
2.1242
2.0825
2.0391
1.9938
1.9464
1.8963
1.8432
21
2.3210
2.2504
2.1757
2.0960
2.0540
2.0102
1.9645
1.9165
1.8657
1.8117
22
2.2967
2.2258
2.1508
2.0707
2.0283
1.9842
1.9380
1.8894
1.8380
1.7831
23
2.2747
2.2036
2.1282
2.0476
2.0050
1.9605
1.9139
1.8648
1.8128
1.7570
24
2.2547
2.1834
2.1077
2.0267
1.9838
1.9390
1.8920
1.8424
1.7896
1.7330
25
2.2365
2.1649
2.0889
2.0075
1.9643
1.9192
1.8718
1.8217
1.7684
1.7110
26
2.2197
2.1479
2.0716
1.9898
1.9464
1.9010
1.8533
1.8027
1.7488
1.6906
27
2.2043
2.1323
2.0558
1.9736
1.9299
1.8842
1.8361
1.7851
1.7306
1.6717
28
2.1900
2.1179
2.0411
1.9586
1.9147
1.8687
1.8203
1.7689
1.7138
1.6541
29
2.1768
2.1045
2.0275
1.9446
1.9005
1.8543
1.8055
1.7537
1.6981
1.6376
30
2.1646
2.0921
2.0148
1.9317
1.8874
1.8409
1.7918
1.7396
1.6835
1.6223
40
2.0772
2.0035
1.9245
1.8389
1.7929
1.7444
1.6928
1.6373
1.5766
1.5089
60
1.9926
1.9174
1.8364
1.7480
1.7001
1.6491
1.5943
1.5343
1.4673
1.3893
120
1.9105
1.8337
1.7505
1.6587
1.6084
1.5543
1.4952
1.4290
1.3519
1.2539
`
1.8307
1.7522
1.6664
1.5705
1.5173
1.4591
1.3940
1.3180
1.2214
1.0000
From Maxine Merrington and Catherine M. Thompson, “T
ables of Per
centage Points of the Inverted Beta (
F
)
Distribution,”
Biometrika 33
(1943): 80–84. Reproduced with permission of the Biometrika T
rustees.
Appendix A
779
Denominator degrees of freedom (df
2
)
5014_TriolaE/S_AppA 11/23/05 6:37 AM Page 779
780
A
PPENDIX
A
n
a 5
.05
a 5
.01
4
.950
.999
5
.878
.959
6
.811
.917
7
.754
.875
8
.707
.834
9
.666
.798
10
.632
.765
11
.602
.735
12
.576
.708
13
.553
.684
14
.532
.661
15
.514
.641
16
.497
.623
17
.482
.606
18
.468
.590
19
.456
.575
20
.444
.561
25
.396
.505
30
.361
.463
35
.335
.430
40
.312
.402
45
.294
.378
50
.279
.361
60
.254
.330
70
.236
.305
80
.220
.286
90
.207
.269
100
.196
.256
NOTE: To test H
0
: r 5 0 against H
1
: r
0,
reject H
0
if the absolute value of r is greater
than the critical value in the table.
2
T
ABLE
A-6
Critical Values of the
Pearson Correlation
Coefficient r
5014_TriolaE/S_AppA 11/23/05 6:37 AM Page 780
T
ABLE
A-7
Critical Values for the Sign Test
a
.005
.01
.025
.05
(one tail)
(one tail)
(one tail)
(one tail)
.01
.02
.05
.10
n
(two tails)
(two tails)
(two tails)
(two tails)
1
*
*
*
*
2
*
*
*
*
3
*
*
*
*
4
*
*
*
*
5
*
*
*
0
6
*
*
0
0
7
*
0
0
0
8
0
0
0
1
9
0
0
1
1
10
0
0
1
1
11
0
1
1
2
12
1
1
2
2
13
1
1
2
3
14
1
2
2
3
15
2
2
3
3
16
2
2
3
4
17
2
3
4
4
18
3
3
4
5
19
3
4
4
5
20
3
4
5
5
21
4
4
5
6
22
4
5
5
6
23
4
5
6
7
24
5
5
6
7
25
5
6
7
7
NOTES:
1. * indicates that it is not possible to get a value in the critical region.
2. Reject the null hypothesis if the number of the less frequent sign (x) is less than or equal
to the value in the table.
3. For values of n greater than 25, a normal approximation is used with
z 5
sx 1 0.5d 2
¢
n
2
≤
!n
2
Appendix A
781
5014_TriolaE/S_AppA 11/23/05 6:37 AM Page 781
T
ABLE
A-8
Critical Values of T for the Wilcoxon Signed-Ranks Test
a
.005
.01
.025
.05
(one tail)
(one tail)
(one tail)
(one tail)
.01
.02
.05
.10
n
(two tails)
(two tails)
(two tails)
(two tails)
5
*
*
*
1
6
*
*
1
2
7
*
0
2
4
8
0
2
4
6
9
2
3
6
8
10
3
5
8
11
11
5
7
11
14
12
7
10
14
17
13
10
13
17
21
14
13
16
21
26
15
16
20
25
30
16
19
24
30
36
17
23
28
35
41
18
28
33
40
47
19
32
38
46
54
20
37
43
52
60
21
43
49
59
68
22
49
56
66
75
23
55
62
73
83
24
61
69
81
92
25
68
77
90
101
26
76
85
98
110
27
84
93
107
120
28
92
102
117
130
29
100
111
127
141
30
109
120
137
152
NOTES:
1. * indicates that it is not possible to get a value in the critical region.
2. Reject the null hypothesis if the test statistic T is less than or equal to the critical value
found in this table. Fail to reject the null hypothesis if the test statistic T is greater than
the critical value found in the table.
From Some Rapid Approximate Statistical Procedures, Copyright ©1949, 1964 Lederle
Laboratories Division of American Cyanamid Company. Reprinted with the permission of the
American Cyanamid Company.
782
A
PPENDIX
A
5014_TriolaE/S_AppA 11/23/05 6:37 AM Page 782
T
ABLE
A-9
Critical Values of Spearman’s Rank Correlation
Coefficient r
s
n
a 5
0.10
a 5
0.05
a 5
0.02
a 5
0.01
5
.900
—
—
—
6
.829
.886
.943
—
7
.714
.786
.893
.929
8
.643
.738
.833
.881
9
.600
.700
.783
.833
10
.564
.648
.745
.794
11
.536
.618
.709
.755
12
.503
.587
.678
.727
13
.484
.560
.648
.703
14
.464
.538
.626
.679
15
.446
.521
.604
.654
16
.429
.503
.582
.635
17
.414
.485
.566
.615
18
.401
.472
.550
.600
19
.391
.460
.535
.584
20
.380
.447
.520
.570
21
.370
.435
.508
.556
22
.361
.425
.496
.544
23
.353
.415
.486
.532
24
.344
.406
.476
.521
25
.337
.398
.466
.511
26
.331
.390
.457
.501
27
.324
.382
.448
.491
28
.317
.375
.440
.483
29
.312
.368
.433
.475
30
.306
.362
.425
.467
NOTES:
1. For
use where
z corresponds to the level of significance. For
example, if a 5 0.05, then z 5 1.96.
2. If the absolute value of the test statistic r
s
exceeds the positive critical value, then reject H
0
:
r
s
5
0 and conclude that there is a correlation.
Based on data from “Biostatistical Analysis, 4th edition,” © 1999, by Jerrold Zar, Prentice Hall,
Inc., Upper Saddle River, New Jersey, and “Distribution of Sums of Squares of Rank Differences
to Small Numbers with Individuals,” The Annals of Mathematical Statistics, Vol. 9, No. 2, with
permission of the Institute of Mathematical Statistics.
r
s
5 6
z
> !n 2 1
n . 30,
Appendix A
783
r
s
1
1
r
s
a
/
2
a
/
2
5014_TriolaE/S_AppA 11/23/05 6:37 AM Page 783
T
ABLE
A-10
Critical Values for Number of Runs G
Value of n
2
2
3
4
5
6
7
8
9
10
11
12
13
14
15
16
17
18
19
20
2
1
1
1
1
1
1
1
1
1
1
2
2
2
2
2
2
2
2
2
6
6
6
6
6
6
6
6
6
6
6
6
6
6
6
6
6
6
6
1
1
1
1
2
2
2
2
2
2
2
2
2
3
3
3
3
3
3
3
6
8
8
8
8
8
8
8
8
8
8
8
8
8
8
8
8
8
8
4
1
1
1
2
2
2
3
3
3
3
3
3
3
3
4
4
4
4
4
6
8
9
9
9
10
10
10
10
10
10
10
10
10
10
10
10
10
10
1
1
2
2
3
3
3
3
3
4
4
4
4
4
4
4
5
5
5
5
6
8
9 10 10
11
11
12
12
12
12
12
12
12
12
12
12
12
12
6
1
2
2
3
3
3
3
4
4
4
4
5
5
5
5
5
5
6
6
6
8
9 10 11
12
12
13
13
13
13
14
14
14
14
14
14
14
14
1
2
2
3
3
3
4
4
5
5
5
5
5
6
6
6
6
6
6
7
6
8 10 11 12
13
13
14
14
14
14
15
15
15
16
16
16
16
16
8
1
2
3
3
3
4
4
5
5
5
6
6
6
6
6
7
7
7
7
6
8 10 11 12
13
14
14
15
15
16
16
16
16
17
17
17
17
17
1
2
3
3
4
4
5
5
5
6
6
6
7
7
7
7
8
8
8
9
6
8 10 12 13
14
14
15
16
16
16
17
17
18
18
18
18
18
18
10
1
2
3
3
4
5
5
5
6
6
7
7
7
7
8
8
8
8
9
6
8 10 12 13
14
15
16
16
17
17
18
18
18
19
19
19
20
20
1
2
3
4
4
5
5
6
6
7
7
7
8
8
8
9
9
9
9
11
6
8 10 12 13
14
15
16
17
17
18
19
19
19
20
20
20
21
21
12
2
2
3
4
4
5
6
6
7
7
7
8
8
8
9
9
9
10
10
6
8 10 12 13
14
16
16
17
18
19
19
20
20
21
21
21
22
22
2
2
3
4
5
5
6
6
7
7
8
8
9
9
9
10
10
10
10
13
6
8 10 12 14
15
16
17
18
19
19
20
20
21
21
22
22
23
23
14
2
2
3
4
5
5
6
7
7
8
8
9
9
9
10
10
10
11
11
6
8 10 12 14
15
16
17
18
19
20
20
21
22
22
23
23
23
24
2
3
3
4
5
6
6
7
7
8
8
9
9
10
10
11
11
11
12
15
6
8 10 12 14
15
16
18
18
19
20
21
22
22
23
23
24
24
25
16
2
3
4
4
5
6
6
7
8
8
9
9
10
10
11
11
11
12
12
6
8 10 12 14
16
17
18
19
20
21
21
22
23
23
24
25
25
25
2
3
4
4
5
6
7
7
8
9
9
10
10
11
11
11
12
12
13
17
6
8 10 12 14
16
17
18
19
20
21
22
23
23
24
25
25
26
26
18
2
3
4
5
5
6
7
8
8
9
9
10
10
11
11
12
12
13
13
6
8 10 12 14
16
17
18
19
20
21
22
23
24
25
25
26
26
27
2
3
4
5
6
6
7
8
8
9
10
10
11
11
12
12
13
13
13
19
6
8 10 12 14
16
17
18
20
21
22
23
23
24
25
26
26
27
27
20
2
3
4
5
6
6
7
8
9
9
10
10
11
12
12
13
13
13
14
6
8 10 12 14
16
17
18
20
21
22
23
24
25
25
26
27
27
28
NOTES:
1. The entries in this table are the critical G values, assuming a two-tailed test with a significance level of a 5 0.05.
2. The null hypothesis of randomness is rejected if the total number of runs G is less than or equal to the smaller entry or greater
than or equal to the larger entry.
From “Tables for Testing Randomness of Groupings in a Sequence of Alternatives,” The Annals of Mathematical Statistics, Vol. 14,
No. 1. Reprinted with permission of the Institute of Mathematical Statistics.
784
A
PPENDIX
A
V
alue of
n
1
5014_TriolaE/S_AppA 11/23/05 6:37 AM Page 784
Wyszukiwarka
Podobne podstrony:
Elementary Statistics 10e 5014 TriolaE2FS AppC
Elementary Statistics 10e 5014 TriolaE2FS AppD
Elementary Statistics 10e 5014 TriolaE S Index
Elementary Statistics 10e 5014 Triola Pullout Card
Elementary Statistics 10e 5014 TriolaE2FS AppB
Elementary Statistics 10e 5014 TriolaE2FS APP opener
Elementary Statistics 10e 5014 Triola endpapers
Elementary Statistics 10e 5014 TriolaE MultiM FMppi xxxv ds
Elementary Statistics 10e TriolaE S Creditspp855 856
Elementary Statistics 10e TriolaE S CH15pp758 766
Elementary Statistics 10e TriolaE S CH05pp198 243
Elementary Statistics 10e TriolaE S CH11pp588 633
Elementary Statistics 10e TriolaE S CH02pp040 073
Elementary Statistics 10e TriolaES FMppi xxxv
elements of statistical learning sol2
Wyk 02 Pneumatyczne eleme
więcej podobnych podstron