GDP (million current US$, 2016)
773
Rank in world trade, 2016
Exports
Imports
GDP per capita (US$, 2014-2016)
2 882
Merchandise
187
185
Current account balance (% GDP, 2016)
-12.1
excluding intra-EU trade
160
158
Trade per capita (US$, 2014-2016)
1 504
Commercial services
156
185
Trade (% GDP, 2014-2016)
52.2
excluding intra-EU trade
129
158
Value
Million US$
2016
51
424
2016
2016
0.00
0.00
Breakdown in economy's total exports
Breakdown in economy's total imports
Value
Value
Top exported products (Million US$)
2011
Top imported products (Million US$)
2011
.
HS1513
Coconut (copra), or palm kernel oil
17
HS1006
Rice
11
HS1203
Copra
11
HS1905
Bread, pastry, other bakers' wares
5
HS1212
Locust beans, seaweeds and algae
7
HS0207
Meat and edible offal of poultry
5
HS0202
Meat of bovine animals, frozen
5
HS1101
Wheat or meslin flour
4
HS1801
Cocoa beans, whole or broken
3
HS2402
Cigars, cheroots, cigarillos
3
Share in economy's trade in agricultural products
Value
Million US$
2011
2010-2011
2010
2011
Exports
49
40
…
40
Imports
66
8
…
8
Value
Value
Top exported products (Million US$)
2011
Top imported products (Million US$)
2011
HS3205
Colour lakes
3
HS2710
Petroleum oils, other than crude
48
HS0302
Fish, fresh, chilled
2
HS3004
Medicaments in measured doses
16
HS0301
Live fish
2
HS8703
Motor cars for transport of persons
7
HS0303
Fish, frozen, excluding fish fillet
2
HS2523
Portland cement, aluminous cement
4
HS7204
Ferrous waste and scrap
0.9
HS1604
Prepared or preserved fish
4
Share in economy's trade in non-agricultural products
Value
Million US$
2011
2010-2011
2010
2011
Exports
13
36
…
36
Imports
211
0
…
0
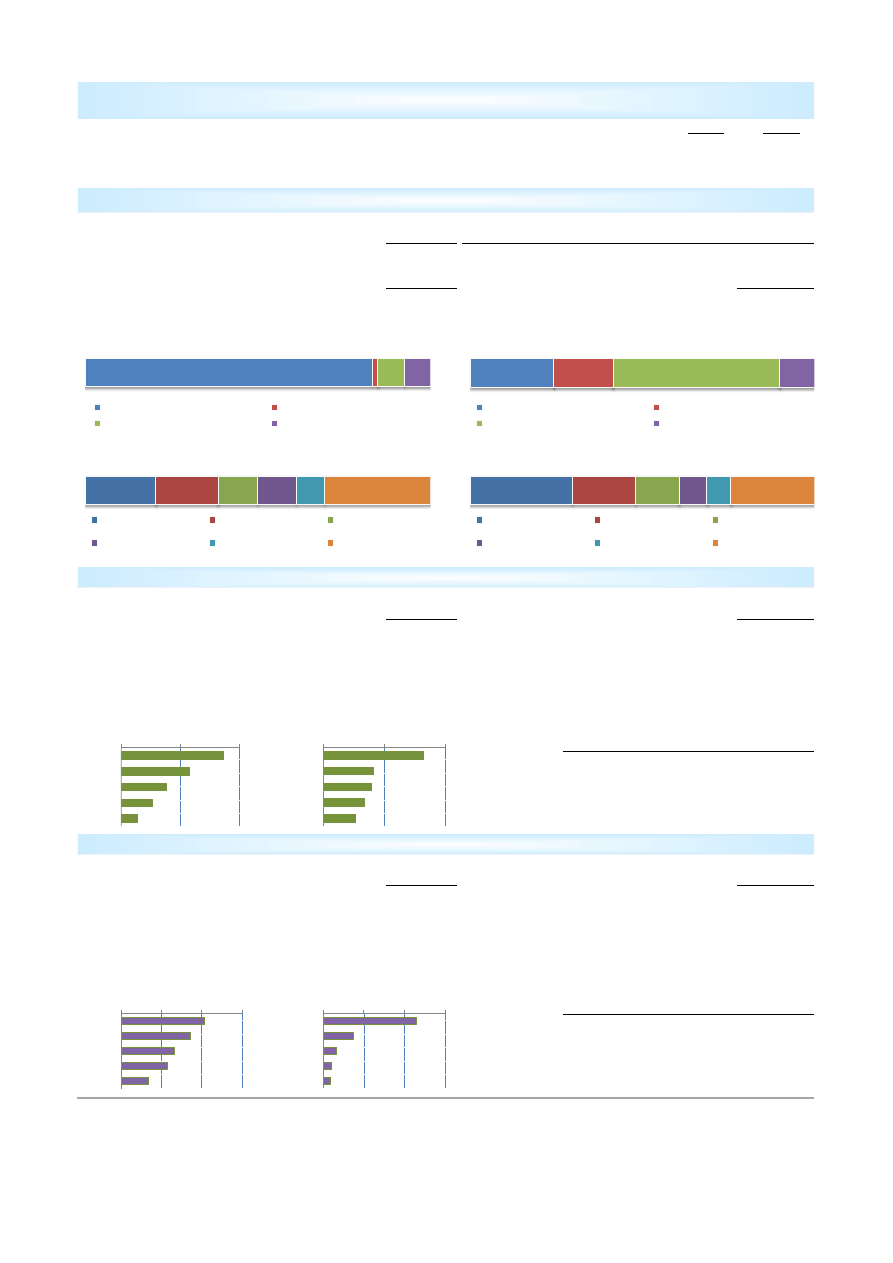
By main commodity group, % (2011)
By main destination, % (2011)
By main origin, % (2011)
Annual percentage change
Annual percentage change
Vanuatu
MERCHANDISE TRADE
Agricultural Products
Non-Agricultural Products
Merchandise exports, f.o.b.
1
-38
30
Merchandise imports, c.i.f.
Annual percentage change
2010-2016
2015
2016
7
18
16
Share in world total imports (%)
By main commodity group, % (2011)
Share in world total exports (%)
0%
10%
20%
30%
HS3205
HS0302
HS0301
HS0303
HS7204
Exports
0%
10%
20%
30%
HS2710
HS3004
HS8703
HS2523
HS1604
Imports
0%
10%
20%
HS1006
HS1905
HS0207
HS1101
HS2402
Imports
0%
20%
40%
HS1513
HS1203
HS1212
HS0202
HS1801
Exports
Agricultural products: 83.2
Fuels and mining products: 1.5
Manufactures: 7.8
Other: 7.5
Agricultural products: 24.2
Fuels and mining products: 17.3
Manufactures: 48.2
Other: 10.3
Malaysia: 20.4
Philippines: 18
New Zealand: 11.4
Australia: 11.3
Fiji: 8.1
Other: 30.7
Australia: 29.7
Singapore: 18.2
New Zealand: 12.7
Fiji: 8
China: 6.9
Other: 24.5
Value
Million US$
2016
327
154
2016
2016
0.01
0.00
Breakdown in economy's total exports
Breakdown in economy's total imports
Value
FATS sales
2016
Inward (million US$)
…
Outward (million US$)
…
Value
Million US$
2015
Exports
34
Imports
107
Exports
Value
Imports
Value
Share (%)
By sea (2015)
3
By sea (2015)
73
68.2
By air (2015)
31
By air (2015)
33
30.8
By other
…
By other
…
…
Value
Million US$
2015
Exports
228
Imports
30
Million US$
Value
2015
Other commercial services
Exports
16
Imports
39
2015
Goods-related services
Exports
…
Imports
2
Residents
Total
Residents
Total
Residents
Total
…
…
…
…
…
…
…
…
…
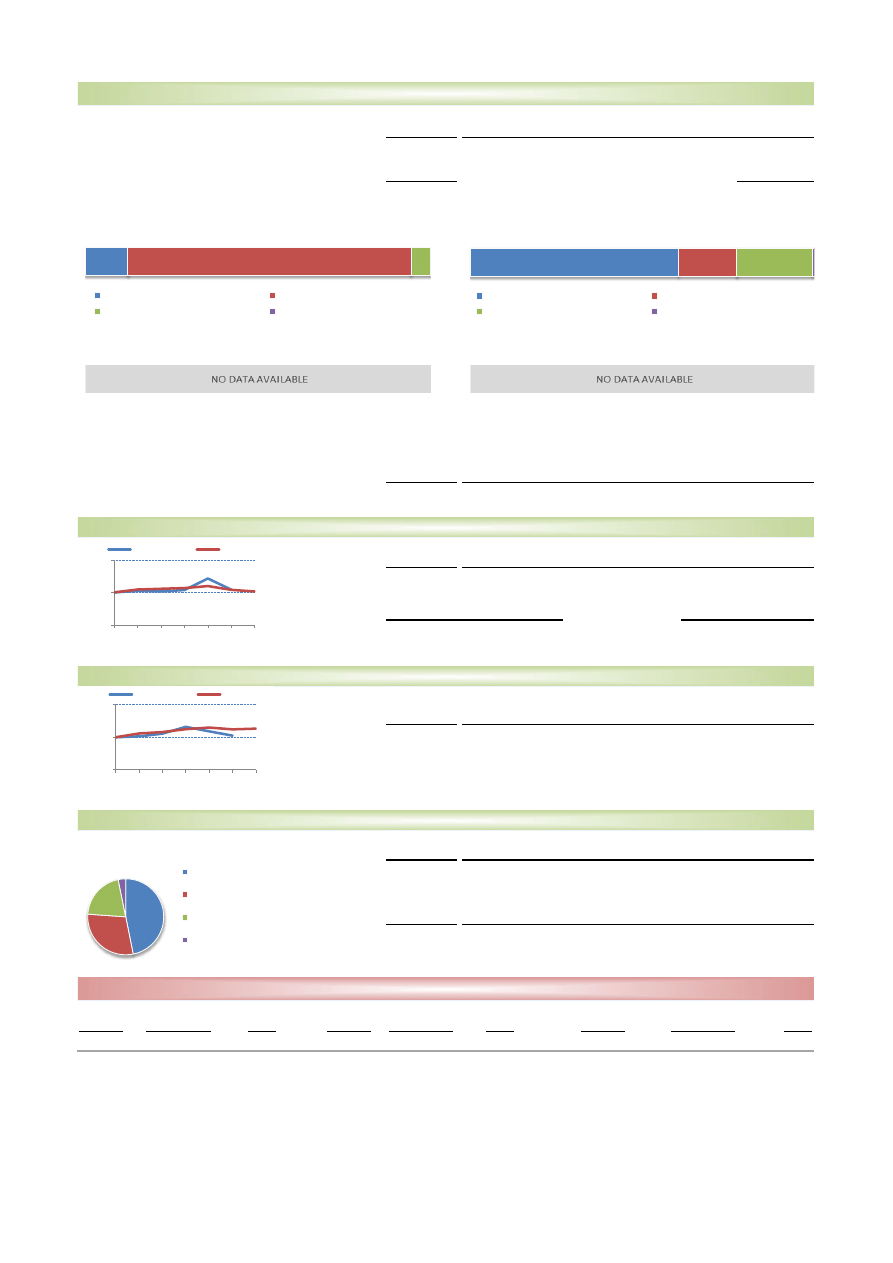
Travel exports (Index 2010=100)
…
…
2014
Travel
2015
2010-2015
Transport exports (Index 2010=100)
-24
10
2
44
Annual percentage change
Share (%)
9.0
89.0
…
…
…
24
…
…
…
2010-2016
2015
2016
Annual percentage change
By main services item, % (2015)
By main origin
-13
18
4
2010-2016
2015
-13
Commercial services exports
Commercial services imports
3
2016
TRADE IN COMMERCIAL SERVICES
By main services item, % (2015)
By main destination
Share in world total exports (%)
Share in world total imports (%)
Annual percentage change
Transport
Annual percentage change
2010-2015
2014
2015
2
33
1
0
-10
-12
-11
-18
INDUSTRIAL PROPERTY
…
…
-52
36
-15
7
Non-residents
Non-residents
Non-residents
Other Commercial Services and Goods-related Services
2014
-1
-12
Annual percentage change
2010-2015
2015
2010-2015
2014
2015
…
…
-7
Exports of OCS by main item (2015)
Patent applications
Trademark applications
Industrial design applications
0
100
200
2010 2011 2012 2013 2014 2015 2016
Vanuatu
World
0
100
200
2010 2011 2012 2013 2014 2015 2016
Vanuatu
World
Transport: 12.3
Travel: 82
Other commercial services: 5.6
Goods-related services: 0
Transport: 60.3
Travel: 17
Other commercial services: 21.8
Goods-related services: 0.9
46.8
29.3
20.7
3.2
ICTs
Financial services
Other business
services
Other
Wyszukiwarka
Podobne podstrony:
deja vu
Deja vu, D?j? vu
DEJA VU CZYLI TWÓJ MÓZG JUŻ TU BYŁ, NAUKA, WIEDZA
Bem te vi vuô, vuô
deja vu
La Bénédiction du Vœu Originel du Maître? Guérison
deja vu
D j vu
VU
Déjà vu
1999 04 Pseudoanalogowy VU−metr
How to flash a Vu Uno
david regal the deja vu deck
LCD VU meter and FFT spectrum analyser
Paweł Wieczorkiewicz Deja vu Nowe Państwo, nr 3 (371) 2008
Czy zjawisko deja vu zostało wreszcie wyjaśnione
więcej podobnych podstron