
XXVI
Konferencja
Naukowo-Techniczna
awarie budowlane 2013
A
NNA
M.
R
AKOCZY
, arakoczy@unl.edu
University of Nebraska – Lincoln
A
NDRZEJ
S.
N
OWAK
, anowak2@unl.edu
University of Nebraska – Lincoln
OCENA ZMĘCZENIA 100-LETNIEGO STALOWEGO MOSTU
KOLEJOWEGO W UJĘCIU NIEZAWODNOŚCI KONSTRUKCJI
FATIGUE RELIABILITY ASSESSMENT OF 100 YEAR OLD
STEEL RAILWAY BRIDGE
Streszczenie Mosty kolejowe są podatne na uszkodzenia materiału w skutek zmęczenia w okresie
ich użytkowania. Są one narażone na duże obciążenia cyklicznego wywołane przejeżdżającymi pociąga-
mi. W stanie granicznym zmęczenia, elementy i połączenia mogą ulec awarii, nawet gdy poziom naprę-
ż
eń jest niższy od naprężeń dopuszczalnych. Na ocenę zmęczenia składa się wiele parametrów takich jak
identyfikacja krytycznych komponentów, historia obciążeń, zakres naprężeń, liczba cykli, stopień degra-
dacji i wielu innych. Większość z tych parametrów ma charakter losowy, dlatego też zalecane jest podej-
ś
cie probabilistyczne do dokładnego oszacowania trwałości zmęczeniowej. Artykuł ten przedstawia
analizę niezawodnościową typowego mostu stalowego z dźwigarami blachownicowymi, nitowanymi
wykonaną na podstawie wyników uzyskanych z metody elementów skończonych (MES). Na podstawie
historii obciążenia i zakładanego poziomu bezpieczeństwa oszacowano przewidywany okres użytkowa-
nia dla każdego krytycznego elementu i połączenia.
Abstract Railway bridges are vulnerable to fatigue damage during their service. They are exposed
to cyclic high stresses due to the moving load. In the fatigue limit state, components and connection may
lead to failure even when the stress level is lower than the allowable stresses. Fatigue evaluation consist
many parameters such as identification of critical components, recent and past load history, stress range,
number of cycles, degree of the deterioration and many others. Most of these parameters are random
in nature; therefore, the probabilistic approach is recommended for accurate estimation of remaining
fatigue life. In this study the through-plate girder, riveted railway bridge is analysed using results from
Finite Element Method (FEM). Based on the load history and assumed safety level the predicted years
of service is estimated for each critical component and connection.
1. Introduction
Railway bridges constitute a vital part of the transportation infrastructure system and they
require special attention to provide safe and economical service. Consequences of stoppage of
railway traffic can be severe, including impacts on the regional or even national economy.
Based on the characteristics of railway bridges in USA, over 60% of railway bridges were
constructed before 1950. Those bridges are over 60 years old and they require special attention.
According to data provided by Union Pacific about 50% of railway bridges are steel structures,
about 40% are short bridges with a total length less than 50ft, and about 75% of railway bridges
have span length less than 50ft, [1].
There is a growing need for efficient methods to evaluate the safety reserve in the railway
bridges. The current methods are based on the deterministic approach and emperical equations.
964
Rakoczy A.M. i in.: Ocena zmęczenia 100-letniego stalowego mostu kolejowego w ujęciu…
The parameters which affect safety of railway bridges are random in nature. Therefore,
probabilistic approach are more accurate for estimation of remaining fatigue life.
The objective of this study is to present a reliability model for railway bridges demonstrated
on typical through-plate girder structure. The research work is based on the identification of
the basic load and resistance parameters and modeling of structural behavior. Based on
structural analysis performed using FEM programs, [2], the live load effect for the bridge
components was developed by Rakoczy and Nowak [3]. The calculation of effective stress and
number of cycles are calculated. The statistical parameters of fatigue resistance is based on the
previous study, [4]. Finally, the calculated reliability index for individual components and
connections are presented and the predicted years of service is estimated.
2. Structural analysis of typical railway bridge
The investigated bridge is a through-plate girder, riveted, open deck railway bridge. It was
designed according to AREA, [5], and built in 1894. The structure is located on the main
railway line connecting Bangkok to the north and northeast of Thailand, [6]. The overall
inspection shows that the structure is in good condition with minor loss of sections due to
corrosion. The bridge has a one simply supported span which is 32 ft. 9 in. (10 m) long with
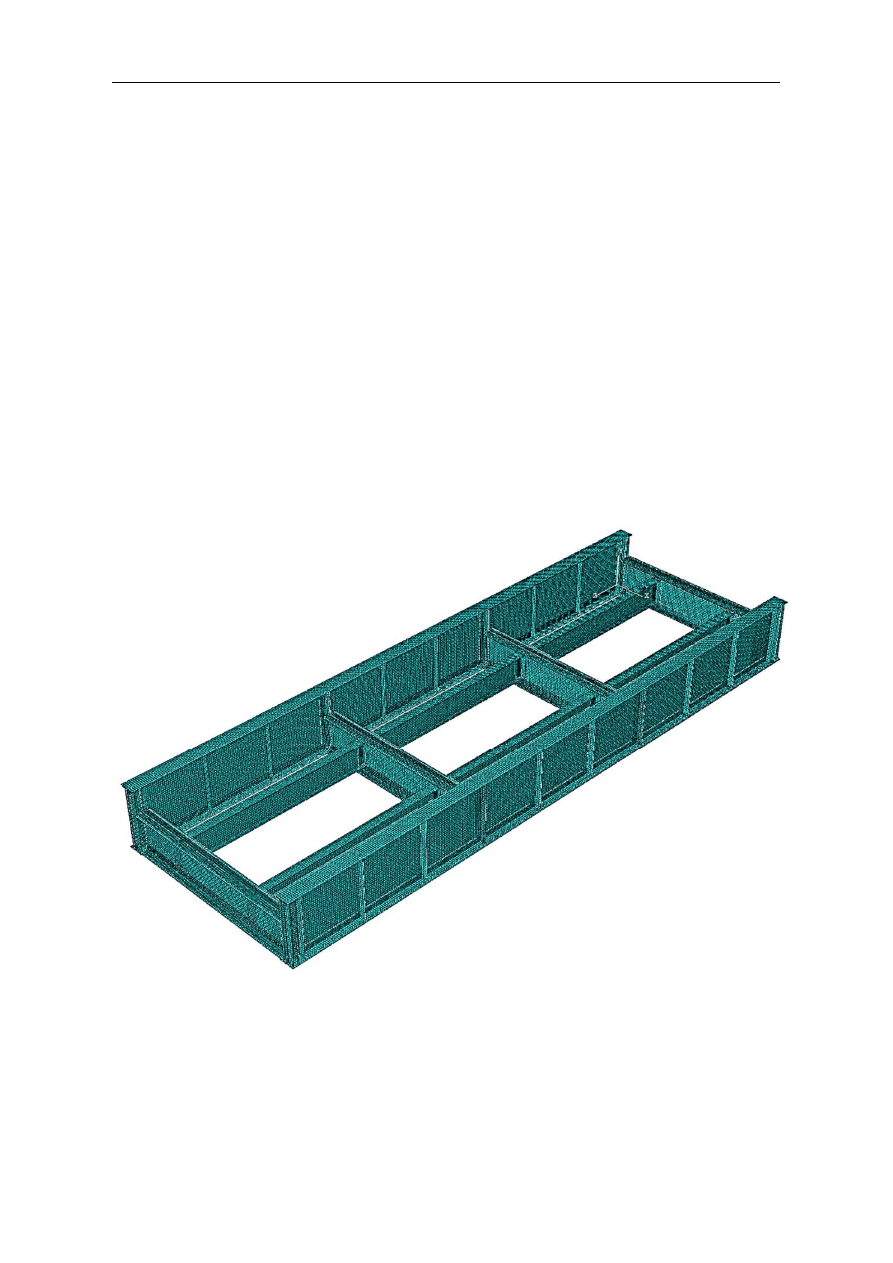
the floor system presented in Figures 1 and 2.
Fig. 1. The floor beam of through-plate girder bridge
Mosty i drogi
965
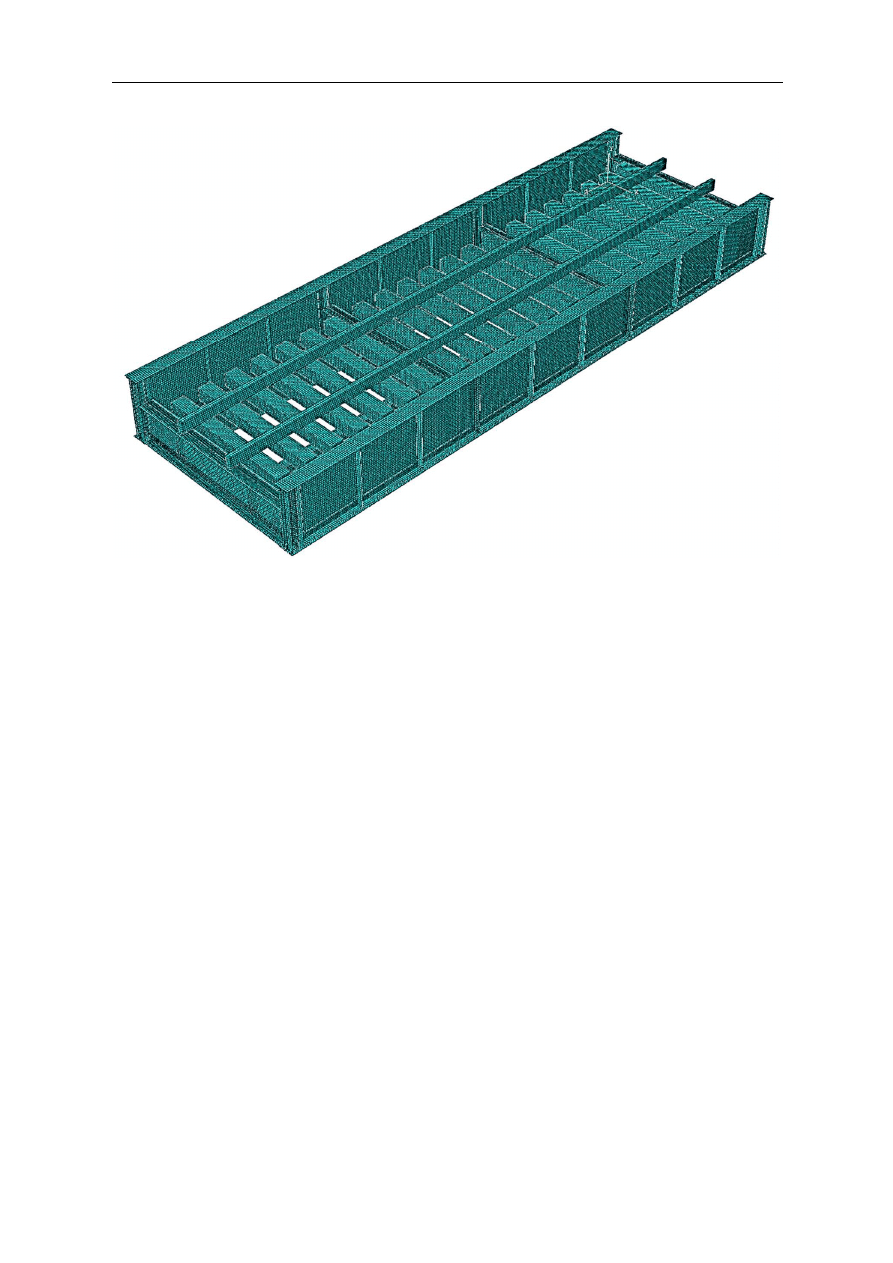
Fig. 2. The floor beam of through-plate girder bridge with rail ties and rails.
The main structural components include two main plate girders and a floor system of floor-
beams and stringers. The girders are spaced transversely at 10 ft. 2 in. (3.1 m) from center to
center, the floor beams are spaced 10 ft. 11 in. (3.33 m) in the longitudinal direction, and the
stringers are spaced transversely at 4 ft. 11 in. (1.6 m). The details about the dimentions and
drawings of connections is presented in the previous, [1, 7].
The FEM model was used to investigate behavior and performance of the bridge under
moving load.
In the FEM analysis, the concentrated load representing unit force was
placed at each 0.1 ft and moved over the bridge. Using this approach, an influence line for
each member of the bridge was developed. The FEM analysis showed that the most critical
points of the bridge remain in elastic stage under the design load, [3]. It is expected that the
loading spectra under current operating conditions do not exceed the design load. Therefore,
for further analysis the principal of super position could be applied.
The response spectra for each component of the bridge were obtained under the statistical
load model described in previous research by Rakoczy and Nowak, [3], and using developed
algorithm in Mat Lab software. The scheme for the algorithm was based on the research of
Tobias et al. [8]. It includes train simulation and calculation of stress history. Based on the
developed stress history it is possible to calculate number of cycles and effective stress range.
The details abut model of the bridge, properties of the components and material characteristic
is given in the previous research, [1].
3. Fatigue analysis
For variable stress history, the rain-flow cycle counting is a method recommended by
ASTM. This method counts the number of fully reversal cycles as well as half cycles and their
range amplitude for a given load time history. A fully reversal cycle is when a cycle range

966
Rakoczy A.M. i in.: Ocena zmęczenia 100-letniego stalowego mostu kolejowego w ujęciu…
goes up to its peak and back to the starting position. A half cycle goes only in one direction,
from the "valley" to the "peak" or from the "peak" to the "valley", [9].
When the number of cycles of stress range is determined, Miner’s rule may be applied.
Generally, Miner’s law is proposed to find the relationship between variable-amplitude fatigue
behavior and constant-amplitude behavior. According to the Palmgren-Miner’s rule, fatigue
damage due to a variable-amplitude loading is expressed by the equation shown in Eq. 1.
∑
=
i
i
i
N
n
D
(1)
Where D is the accumulated damage; ni is the number of cycles at ith stress range magnitude;
and N
i
is the corresponding N value from S-N curve at i
th
stress range magnitude, [10].
Theoretical failure occurs when the sum of the incremental damage equals or exceeds 1.
In practice, a value of D less than unity indicates failure.
Miner’s rule can be rearranged to develop an equivalent constant amplitude cycling
loading. The equivalent constant stress produces the same fatigue damage as a variable
amplitude load for the same number of cycles, [11]. This theory is based on the exponential
model of stress range life relationship presented in Eq. 2, [12]:
n
AS
N
−
=
(2)
where N is number of cycles to failure, S is the nominal stress range, A is a constant for a given
detail and n is the slope constant. After short derivation and assumption that the number of
cycles at ith stress range magnitude ni, is a product of the probability of occurrence of cycle
with amplitude S
i
and the total number of cycles N
T
, the equivalent stress range is:
n
i
n
i
i
e
S
p
S
∑
=
(3)
where S
e
is the equivalent stress for a constant amplitude. The exponent n for most structural
details is 3 and, therefore, the final equation for equivalent stress is referred as a Root Mean
Cube (RMC) of the stress distribution Eq. 4.
3
3
3
3
∑
∑
=
=
i
i
T
i
i
i
i
e
S
N
n
S
p
S
(4)
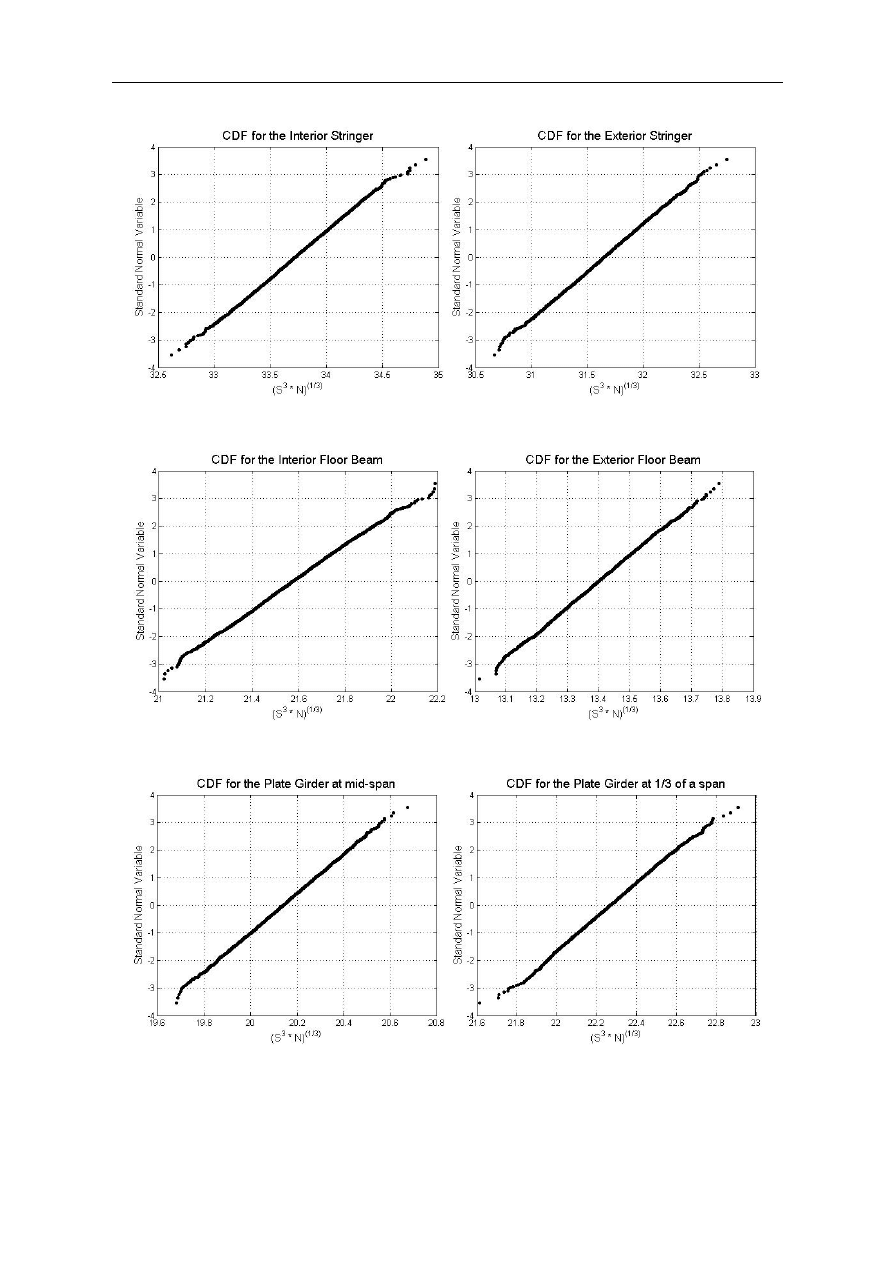
Based on this general algorithm, the simulation of unit train is repeated 5000 times and the
cumulative distribution function (CDF) of the accumulated damage, (S
3
N)(1/3), are plotted on
the normal probability paper for each component of the bridge. Then, the statistical parameters
of load are derived. The calculation was performed for described previously bridge. The results
of the analysis are presented in the Figures 3 through 6.
Mosty i drogi
967
Figure 3. CDF of accumulated damage, (S
3
N)(1/3), for stingers, bridge #1
Figure 4. CDF of accumulated damage, (S
3
N)(1/3), for floor beams, bridge #1
Figure 5. CDF of accumulated damage, (S
3
N)(1/3), for plate girder, bridge #1
968
Rakoczy A.M. i in.: Ocena zmęczenia 100-letniego stalowego mostu kolejowego w ujęciu…
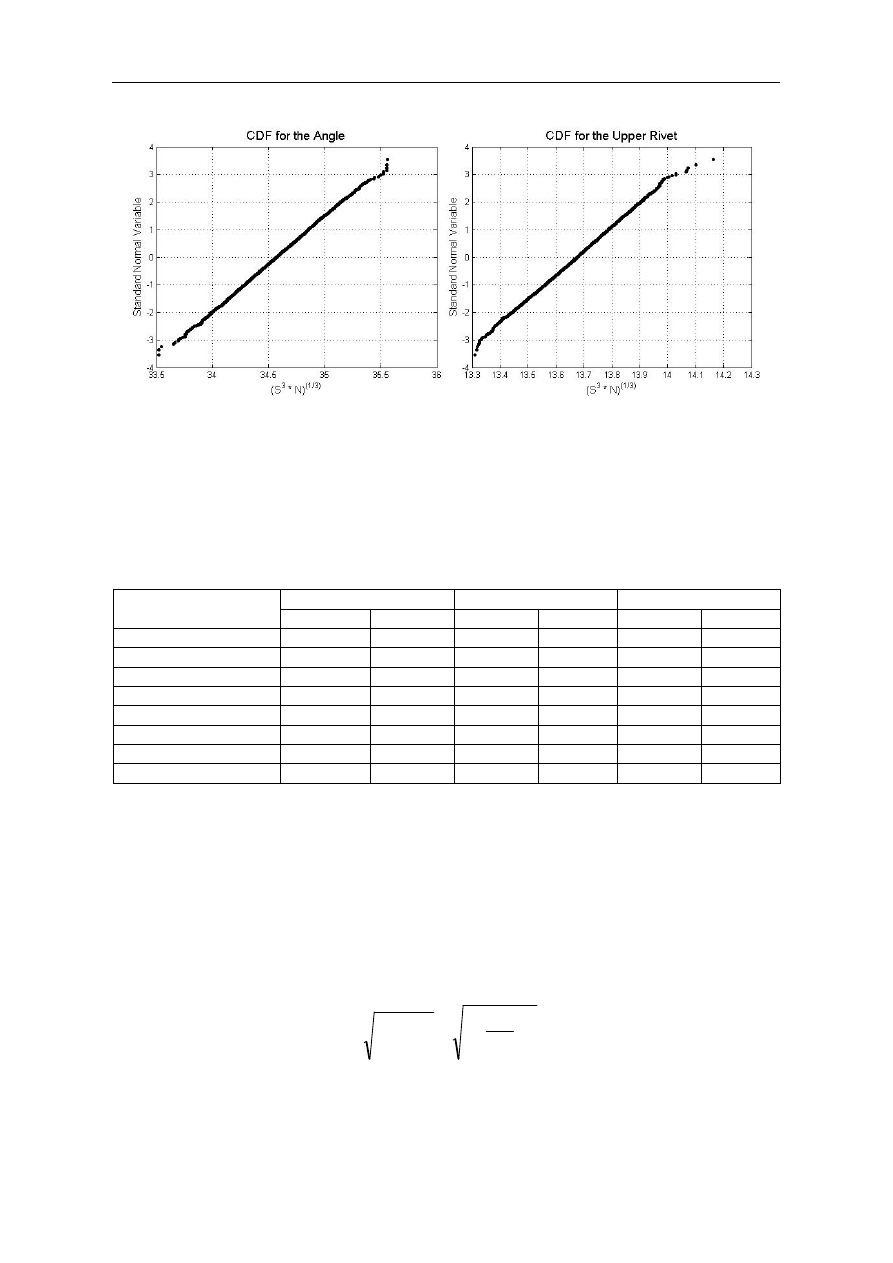
Figure 6 CDF of accumulated damage, (S
3
N)(1/3), for stringer-to-floor-beam connections, bridge #1
The results of fatigue analysis presented on the normal probability paper indicate that the
accumulated damage for each component and connection is close to the straight line. If the
curve is close to a straight line, then the variable can be considered as a normal random
variable, [13]. Therefore, the statistical parameters are determined directly from the graph and
they are presented in the table 1.
Table 1. The statistical parameters of the fatigue load for bridge #1
Member
# of cycles per train
Equivalent stress
(S3N)(1/3)
Mean, µ
CoV, V
Mean, µ
CoV, V
Mean, µ
CoV, V
Interior Stringer
764
0.003
3.69
0.008
33.72
0.0084
Exterior Stringer
718
0.004
3.53
0.009
31.65
0.0089
Interior Floor Beam
370
0.008
3.01
0.008
21.58
0.0076
Exterior Floor Beam
807
0.004
1.44
0.008
13.40
0.0079
Plate girder, center
316
0.006
2.96
0.007
20.14
0.0069
Plate girder, 1/3 L
316
0.003
3.27
0.007
22.27
0.0073
Connection - Angle
593
0.013
4.12
0.009
34.57
0.0082
Connection - Rivet
481
0.010
1.75
0.009
13.68
0.0084
4. Reliability analysis
The load and the resistance model for fatigue limit state contain many uncertainties. For
that reason, evaluation of bridge performance needs to be analyzed by using probabilistic
methods. There are several procedures of reliability analysis available for the structural
performance in ultimate limit state; however, fatigue evaluation in terms of reliability is not
well developed.
The limit state function for fatigue in through-plate girder railway bridges can be expressed
in terms of the damage ratio, as seen in Eq. 5.
3
3
3
3
∑
∑
=
=
i
i
T
i
i
i
i
e
S
N
n
S
p
S
(5)
If we replace the nominator by a Q and denominator by R we can obtain the simple limit state
function presented in the Chapter 2.3, as seen in Eq. 6.
Mosty i drogi
969
(
)
1
3
3
3
3
=
=
⋅
⋅
=
∑
∑
R
Q
N
S
N
S
R
,
Q
g
i
Ri
Ri
i
Qi
Qi
(6)
Since the statistical parameters of load and resistance were developed, the reliability index
can be calculated using a simple formula. Both variables, Q and R, demonstrated
characteristics of normal distribution. Therefore, the basic statistical parameters which are
required for reliability analysis are mean value, µ, standard deviation, σ, and coefficient of
variation, V. For special cases, such as a case of two normal distributed, uncorrelated random
variables, R and Q, reliability index is given by Eq. 7.
2
2
Q
R
Q
R
σ
σ
µ
µ
β
+
−
=
(7)
To calculate reliability index we must specify fatigue category and total load on the bridge.
The through-plate girder contains mainly two categories of details: the riveted connections,
such as riveted cover plates, and the double angle connection. Therefore, for Interior and
Exterior Stringers, the Category A will be used, while for Floor Beams, Plate Girders and
Stringer-to-Floor-Beam Connections Category D will be used. The statistical parameters of all
Categories are presented in the table 2, [1].
Table 2. The statistical parameters of the fatigue resistance
Category
A
B
B’
C
C’
D
E
E’
Mean value, µ
4205
2980
2280
2430
2050
1810
1200
1150
Standard deviation, σ
835
425
250
480
370
250
140
240
Coefficient of variation, V
20%
14%
11%
20%
18%
14%
12%
21%
Whereas the load on the railway bridges is defined in terms of million gross metric tons
per year, the statistical parameters for the accumulated damage were developed based on the
average unit train which contains 200 cars. To find a gross weight of 1 MGMT, the multiple
unit trains were used. Since a simulation was done for 5000 trains, the total gross weight was
about 50 MGMT. Therefore, it was possible to distinguish different ranges of load of 1
MGMT, 5 MGMT, and 10 MGMT, and obtain the statistical parameters. The summary of
statistical parameters for both bridges is presented in table 3.
Table 3. Statistical parameters of the accumulated damage, (S
3
N
)(1/3)
, for unit train and GW equal 1, 5,
and 10 MGMT.
Member
Mean value of (S
3
N)
(1/3)
CoV, V
Unit train
1 MGMT
5 MGMT
10 MGMT
Interior Stringer
33.72
191.04
326.68
411.59
0.0084
Exterior Stringer
31.65
179.37
306.72
386.44
0.0089
Interior Floor Beam
21.58
122.30
209.13
263.49
0.0076
Exterior Floor Beam
13.40
75.97
129.90
163.66
0.0079
Plate girder, center
20.14
114.13
195.15
245.88
0.0069
Plate girder, 1/3 L
22.27
126.19
215.79
271.88
0.0073
Connection – Angle
34.57
196.01
335.17
422.29
0.0082
Connection – Rivet
13.68
77.50
132.52
166.96
0.0084
970
Rakoczy A.M. i in.: Ocena zmęczenia 100-letniego stalowego mostu kolejowego w ujęciu…
The calculations of predicted years of service were carried out. Three cases of load were
considered: 1, 5, and 10 MGMT per year. The reliability indices were fixed and were equal 0,
0.5, 1.0, 1.35 and 1.75. Recently, many researchers use β = 0 in the fatigue analysis of railway
bridges (Tobias et al. 1997; Imam 2005; Imam 2008). Even if the reliability index for fatigue
evaluations can be relatively low, β = 0 is too low. For the evaluation of existing highway
bridges, the target beta is βT = 1.35 for redundant and βT = 1.75 for non-redundant members
according to AASHTO Guide Specifications for Fatigue Evaluation of Existing Steel Bridges,
[14]. Therefore, the reliability index for railway bridges also should be retained higher than 0.
The results of this analysis are shown on the Figures 7 to 9.
Figure 7. Predicted years of service for Bridge #1 subjected to 1 MGMT per year
Figure 8. Predicted years of service for Bridge #1 subjected to 5 MGMT per year
1
10
100
1,000
10,000
100,000
0.00
0.25
0.50
0.75
1.00
1.25
1.50
1.75
2.00
Y
e
a
rs
o
f
S
e
rv
ic
e
β
1 Million Gross Metric Ton (MGMT) per Year
Int.Stringer
Ext. Stringer
Int. Floor Beam
Ext. Floor Beam
Plate Girder, mid-span
Plate Girder, 1/3 of a span
Connection-Angle
Connection-Upper Rivet
1
10
100
1,000
10,000
0.00
0.25
0.50
0.75
1.00
1.25
1.50
1.75
2.00
Y
e
a
rs
o
f
S
e
rv
ic
e
β
5 Million Gross Metric Ton (MGMT) per Year
Int.Stringer
Ext. Stringer
Int. Floor Beam
Ext. Floor Beam
Plate Girder, mid-span
Plate Girder, 1/3 of a span
Connection-Angle
Connection-Upper Rivet
Mosty i drogi
971
Figure 9. Predicted years of service for Bridge #1 subjected to 10 MGMT per year
The results shows that bridge is able to carry a load equal 1 MGMT per year for more than
300 years with β = 1.75. This means that the components and connections have very small
probability of occurrence damage due to fatigue in these periods of time. Reliability index
β = 2 corresponds to 2.0% of probability of failure, β = 1 corresponds to P
f
= 15.0%, and β = 0
corresponds to P
f
= 50.0%. For 5 MGMT per year, bridge still has a high probability that will
not have a damage caused by fatigue; whereas, for the last of the case, in which the load is 10
MGMT per year, the connection reached only 30 years with β = 1.75. In each considered cases
of load, the lowest predicted years of service were achieved for the angle in the Stringer-to-
Floor-Beam connection. This analysis confirms that the weakest link in the bridge system is
the connections.
5. Summary and Conclusions
The fatigue life of structural elements was estimated based on the S-N curves, which
present the number of cycles to failure as a function of the constant stress amplitude. The S-N
fatigue data, created in a laboratory, contains a considerable amount of scatter, even when
standard specimens made from the same material are used [1].
In the reliability analysis, both loading and strength were treated as random variables. The
loading side was classified through the gross weight of train traffic per year. The response of
the bridge components and connection were simulated using influence lines developed in the
FEM and algorithm written in the Mat Lab. The probability of failure for fatigue was calculated
by using damage ratio as a limit state function and the distribution of load and resistance. The
fatigue was considered in eight critical places on the bridge: mid-span of interior and exterior
stringers, mid-span of interior and exterior floor beams, the plate girder in center and quarter
of the span, angle and rivet in the stinger-to-floor-beam connections. Total damage in the
components and the connections were calculated under the statistical load model for freight
and passenger trains. This study give a broad view of the potential remaining fatigue lives of
typical railway bridges subjected to unit train loadings.
The currently acceptable reliability index for fatigue in older bridges is 0. However, for the
design of new bridges it is recommended to increase the reliability index to 1.5. During service
of the bridge the accumulated fatigue damage is increasing in time at different rates, depending
1
10
100
1,000
10,000
0.00
0.25
0.50
0.75
1.00
1.25
1.50
1.75
2.00
Y
e
a
rs
o
f
S
e
rv
ic
e
β
10 Million Gross Metric Ton (MGMT) per Year
Int.Stringer
Ext. Stringer
Int. Floor Beam
Ext. Floor Beam
Plate Girder, mid-span
Plate Girder, 1/3 of a span
Connection-Angle
Connection-Upper Rivet

972
Rakoczy A.M. i in.: Ocena zmęczenia 100-letniego stalowego mostu kolejowego w ujęciu…
on tonnage per year and train type. The reliability approach is the reasonable way to evaluate
performance of the railway bridges due to high degree of uncertainty in the fatigue strength of
riveted details and loading conditions.
The reliability analysis for the fatigue limit state was presented for various safety levels
and through three cases of operating conditions. In each of the considered cases of load, the
lowest predicted years of service were achieved for the angle in the stringer-to-floor-beam
connection. This study has confirmed that riveted bridges are not likely to develop fatigue
cracks in the primary members because the cyclic loads do not result in stress range levels that
exceed the estimate fatigue limit for riveted members (Category D). However, the weakest
link in the bridge system is the connection.
References
1.
Rakoczy, A. M., "Development of System Reliability Models for Railway Bridges", PhD
Dissertation, University of Nebraska-Lincoln, Summer 2012
2.
ABAQUS Analysis User’s Manual.
3.
Rakoczy, A. M. and Nowak, A. S., “Reliability-Based Strength Limit State for Steel
Railway Bridge,” Structure and Infrastructure Engineering, submitted (under review).
4.
Rakoczy, A. M., “Fatigue reliability of Steel Railway Bridge,” Journal of Bridge
Engineering, ASCE, submitted (under review).
5.
American Railway Engineering and Maintenance of Way Association (AREMA),
Manual for Railway Engineering, Chapter 15, Washington, D.C., 2005.
6.
Chotickai, P., and Kanchanalai, T., “Field Testing and Performance Evaluation of a
Through-Plate Girder Railway Bridge”, TRB, No 2172, Transportation Research Board
of the National Academies, Washington, D.C., 2010, pp.132-141.
7.
Rakoczy, A.M., “Identification of Critical Parameters that Affect Safety of Railway
Bridges”, Proceedings of the 3rd Ralph Modjeski Conference on Bridges, Bridges –
Tradition and Future, Bydgoszcz, Poland, May 2012.
8.
Tobias, D. H., and Foutch, D.A., “Reliability-Based Method for Fatigue Evaluation of
Railway Bridges”, Journal of Bridge Engineering 2(2), pp.53-60, 1997.
9.
Rakoczy, P., “WIM Based Load Models for Bridge Serviceability Limit States”,
Dissertation Thesis, UNL, 2011
10.
Miner, M. A., "Cumulative Damage in Fatigue", J. Appl. Mech. 12, 1945.
11.
Schilling, C. G., Klippstein, K. H., Barsom, J. M. and Blake, G. T., ”Fatigue of Welded
Steel Bridge Members under Variable Amplitude Loading", NCHRP Report 188,
Transportation Research Board, 1977.
12.
Fisher, J. W., "Bridge Fatigue Guide – Design and Details", AISC Manual, Chicago 1977
13.
Nowak, A.S. and Collins, K.R., “Reliability of Structures”, McGraw Hill, New York, 2012.
14.
AASHTO, Guide Specifications for Fatigue Evaluation of Existing Steel Bridges,
American Association of State Highway and Transportation Officials, 1990.
Wyszukiwarka
Podobne podstrony:
05 Awaria stalowego kratownicowego mostu kolejowego na skutek wykolejenia pociagu
08 Ocena jakości liniowych układów regulacji
08 Ocena finansowa inwest 1id 7 Nieznany
Ocena trwałości eksploatacyjnej dźwigarów stalowych w mostach wojskowych
08 2 Ocena
08 POLACZENIE SCIANY ZE SLUPEM STALOWYM Model
ocena kondycji finansowej zakładów naprawczych taboru kolejo, Bankowość i Finanse
Ocena trwałości eksploatacyjnej dźwigarów stalowych mostów niskowodnych
Szkol Ergonomia 08 Ocena wysiłku fizycznego
26.05.08, Ocena argumentów
08 Ocena finansowa inwest 1
08 Ocena jakości liniowych układów regulacji
Ocena trwałości eksploatacyjnej dźwigarów stalowych w mostach wojskowych
08 Anna Kotlarska Michalska Czlowiek niepelnosprawny jako inny w ujeciu 87 100
ocena zużycia i wymiany lin stalowych norma
więcej podobnych podstron