Sulfentrazone
Materials to be
analyzed
Soybean seed and processed parts (meal, hulls and oil);
wheat grain, forage, hay; corn grain, forage, stover and
processed parts (flour); rice grain, straw and processed
parts (hulls, bran and polished rice); sorghum grain, for-
age and stover; tobacco (green, dried, cigarette, and
smoke condensate); pea; alfalfa forage and hay; sun-
flower and processed parts (meal and oil); peanut nut-
meat and processed parts (meal and oil); sugarcane and
processed parts (refined sugar and molasses); and potato
tuber and processed parts (wet peel, flakes and chips).
Instrumentation
Gas-chromatographic determination for plant matrices.
1
Introduction
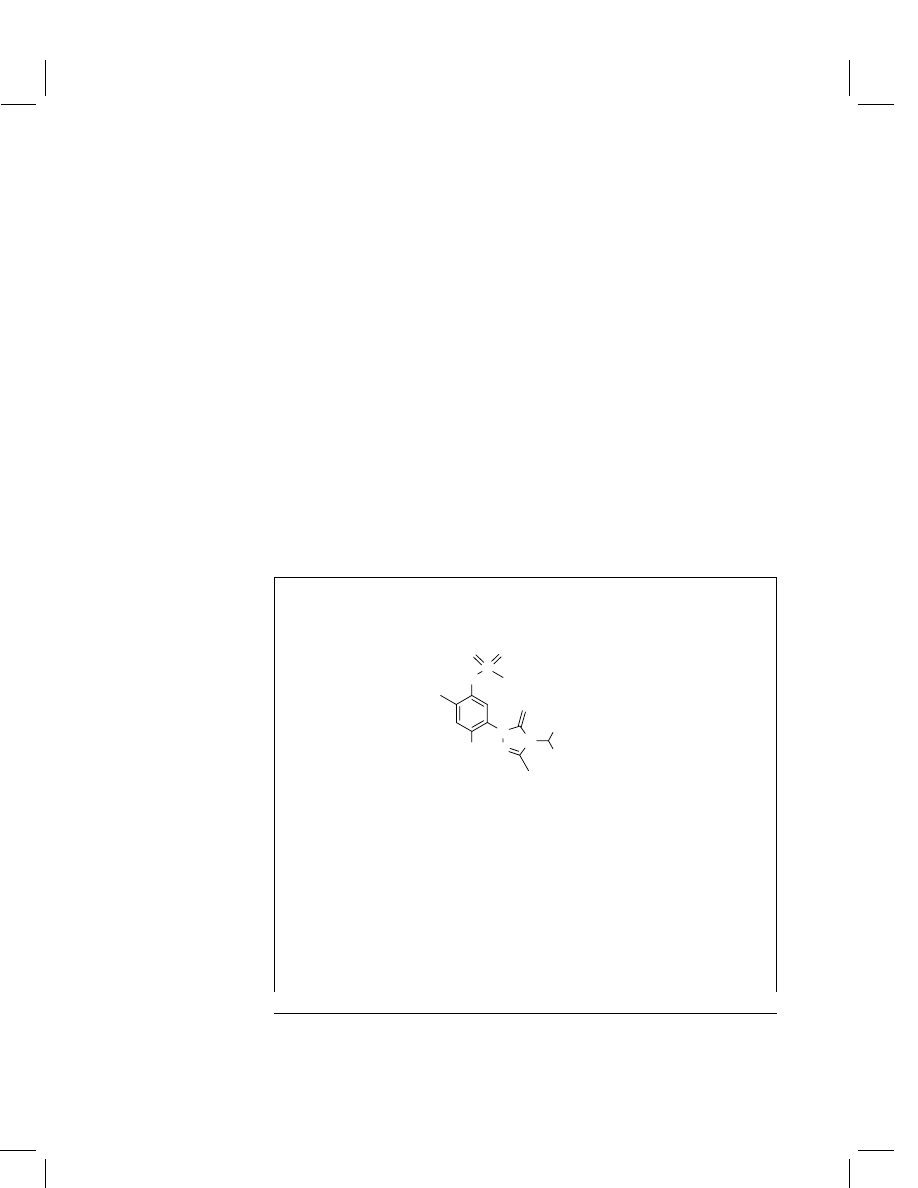
Chemical name
(IUPAC)
N -[2,4-dichloro-5-[4-(difluoromethyl)-4,5-dihydro-3-
methyl-5-oxo-1H-1,2,4-triazol-1-yl]phenyl]methane-
sulfonamide
Structural formula
S
N
H
CI
N
N
N
F
F
CI
O
O
O
Empirical formula
C
10
H
10
N
4
O
3
F
3
SCl
2
Molar mass
387.2
Melting point
121–123
◦
C
Physical state/odor
Light-tan powder with a musty odor
Vapor pressure
8
× 10
−10
mmHg (25
◦
C)
Water solubility
400 mg L
−1
(25
◦
C)
Specific gravity
1.21 g mL
−1
(20
◦
C)
Stability
Stable at pH 5–9
Other properties
Undergoes photolysis in water rapidly. The compound
is stable to photolysis in soil and is relatively persistent
in soil, with a field half-life (t
1/2
) of 121 days in sandy
soil and t
1/2
of 302 days in clay soil.
Handbook of Residue Analytical Methods for Agrochemicals.
C
2003 John Wiley & Sons Ltd.
Sulfentrazone
565
Use pattern
Sulfentrazone is a broad-spectrum, pre-emergent
herbicide that provides good control over broadleaf
weeds, grasses and sedges in crops and turf. The
metabolism of sulfentrazone in animals and plants
is similar. The major plant metabolite of sulfentra-
zone is 3-hydroxymethyl sulfentrazone (HMS). The
soybean tolerance of 0.05 mg kg
−1
includes residues
of sulfentrazone plus its major metabolite, HMS.
The rotational crop tolerance includes residues of
sulfentrazone and its major metabolites, HMS and
3-desmethylsulfentrazone (DMS). The tolerance levels
for cereal grains (excluding sweet corn) are as follows:
0.1 mg kg
−1
in grain, 0.2 mg kg
−1
in hay, 0.6 mg kg
−1
in straw, 0.2 mg kg
−1
in forage, 0.1 mg kg
−1
in stover,
0.15 mg kg
−1
in bran and 0.3 mg kg
−1
in hulls.
Regulatory position
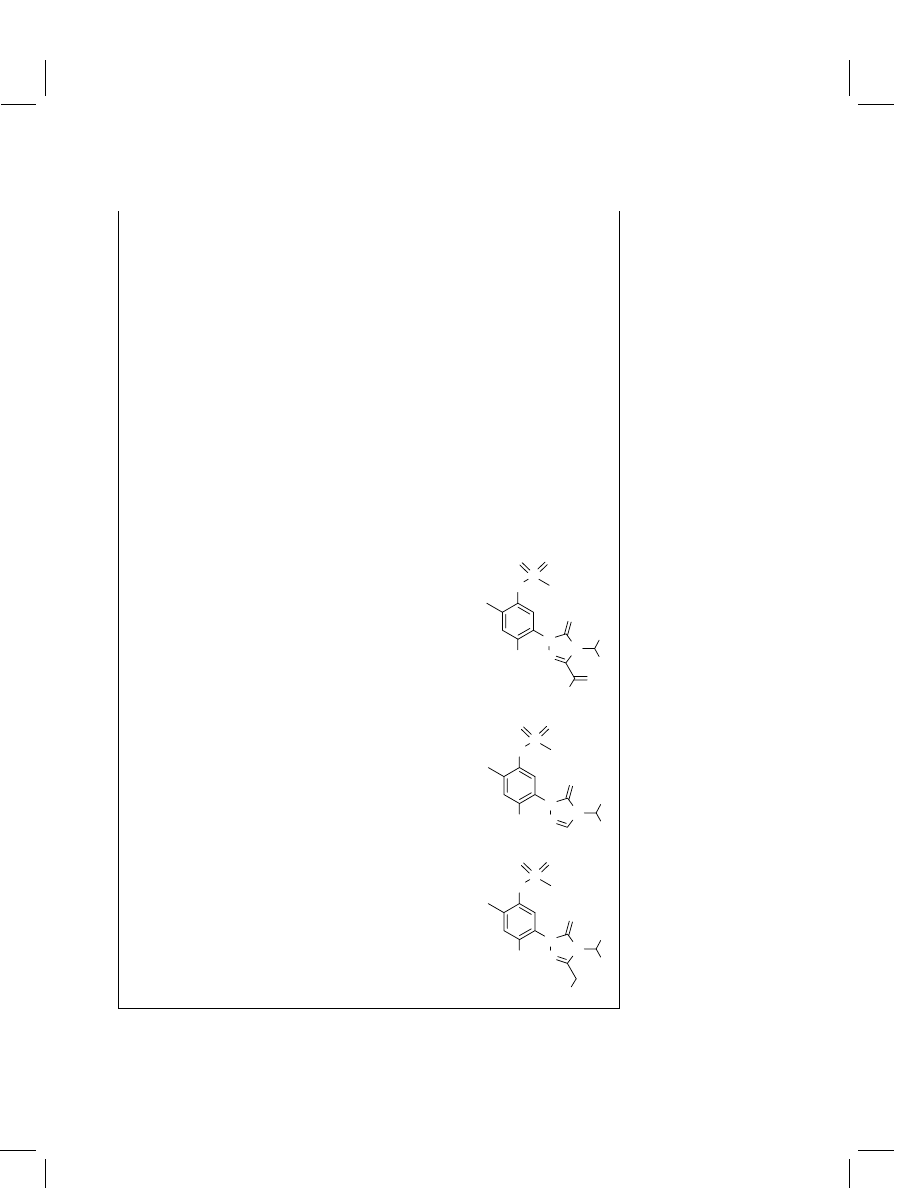
The residue of interest includes the parent sulfentra-
zone, HMS, sulfentrazonecarboxylic acid (SCA) and
DMS.
Sulfentrazone-3-carboxylic acid (SCA)
S
HN
CI
N
N
N
F
F
O
HO
CI
O
O
O
1-[2,4-dichloro-5-[N-(methylsulfonyl)amino]phenyl]-
4-difluoromethyl-4,5-dihydro-5-oxo-1H-1,2,4-
triazole-3-carboxylic acid
3-Desmethylsulfentrazone (DMS)
S
N
H
CI
N
N
N
F
F
CI
O
O
O
N-[2,4-dichloro-5-[4-(difluoromethyl)-4,5-dihydro-
5-oxo-1H-1,2,4-triazol-1-yl]phenyl]methanesulfona-
mide
3-Hydroxymethylsulfentrazone (HMS)
S
HN
CI
N
N
N
F
F
HO
CI
O
O
O
N-[2,4-dichloro-5-[4-(difluoromethlyl)-4,5-dihydro-
3-hydroxymethyl-5-oxo-1H-1,2,4-triazol-1-
yl]phenyl]methanesulfonamide

566
Individual compounds
2
Method description
2.1
Method development history
The analytical method for sulfentrazone and its major plant metabolites originally in-
cluded only a single hydrolysis step and analysis by gas chromatography with electron
capture detection. During a radio-validation study (GC/ECD) analyzing plant sam-
ples from a metabolism study, it became apparent that the method did not account for
all of the conjugated HMS and that the SCA was not completely converted to DMS.
Consequently, the previous method was modified to include a more stringent hydrol-
ysis step, to free all conjugated analytes of concern and to convert SCA completely to
DMS. Additionally, a more specific detector was required to discriminate between the
residues of sulfentrazone and its metabolites, and the matrix components released dur-
ing the stringent hydrolysis step. A gas chromatograph equipped with an electrolytic
conductivity detector (ELCD) or a halogen-specific detector (XSD) was utilized.
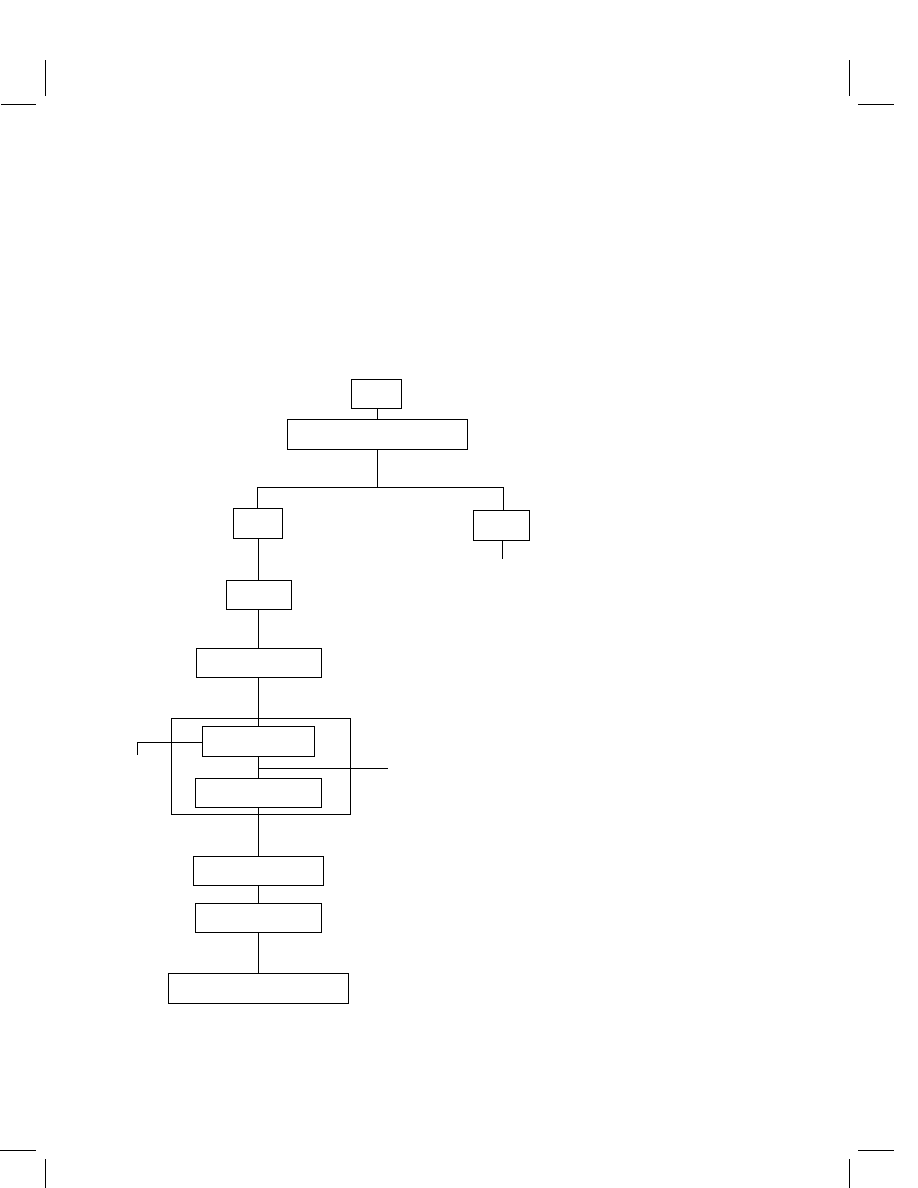
2.2
Outline of method
The enforcement method began with an acetone–0.25 N HCl reflux (1 h), filtration and
concentration. The aqueous concentrate was acidified to 1 N, boiled under reflux (2 h),
and filtered. The sample was then passed through a C
8
solid-phase extraction (SPE)
cartridge and a silica gel SPE cartridge for clean-up. The eluate was concentrated
and the HMS analyte was derivatized with N,O-bis(trimethylsilyl)trifluoroacetamide
(BSTFA). The derivatized solution was passed through a second silica gel SPE car-
tridge for additional cleanup. The eluate was concentrated and brought to a final
volume with acetonitrile. Analysis was performed by gas chromatography (GC) with
a 35% or 50% phenylmethylsilicone megabore or narrow-bore column.
This enforcement method has been validated on the raw agricultural commodity
(RAC) and processed parts of various crops. For hay and straw matrices, the method
limit of quantitation (LOQ) was validated at 0.05 mg kg
−1
and the method limit of
detection (LOD) was set at 0.01 mg kg
−1
. For all other crop matrices, the LOQ was
validated at 0.025 mg kg
−1
and the LOD was set at 0.005 mg kg
−1
. The method flow
chart is presented in Figure 1.
3
Apparatus
AccessChrom or TurboChrom data acquisition software running on a MicroVax
Adapters, neoprene
Adapters, reducing
Balance, Analytical PM 2000, Mettler
Balance, top loading, Mettler
Boiling stones, Hengar
Buchner filter funnels, porcelain, 10.5-cm i.d., Coors
Capillary column, DB-5MS, 15 m
× 0.25-mm i.d., 0.25-µm, J&W Scientific
Sulfentrazone
567
Capillary column, DB-35MS, 15 m
× 0.25-mm i.d., 0.25-µm, J&W Scientific
Capillary column, DB-17, 30 m
× 0.54-mm i.d., 1-µm, J&W Scientific
Capillary column, DB-35, 30 m
× 0.54-mm i.d., 1-µm, J&W Scientific
Centrifuge tubes, 13-mL, graduated, 0.1 mL, Pyrex
Condensers, Pyrex, Graham coil, 41
× 500 mm with Ts 24/40 joint
Cylinders, graduated, 50-, 100-, 250-mL
Filter paper, Whatman No. 1, 11-cm diameter
Filter paper, Whatman GF/F (0.8 µm), 11-cm diameter
Matrix
Acetone--0.25 N HCI, Reflux 1 h
Filtration
Liquid
Evaporation
Aqueous
Acidify
Coupled Cartridges
for elution
1 N HCI, Reflux 2 h
C
8
Cartridge SPE
Silica Cartridge SPE
Acid
Discard
BSTFA Derivatization
Silica Cartridge SPE
GC/ELCD or XSD Quantitation
Concentration
Concentration
Solid
Discard
Filtration
Figure 1
Method flowchart for sulfentrazone determination.

568
Individual compounds
Flasks, filter, 250-mL
Flasks, round-bottom boiling, 500-mL, T
s 24/40 joint
Flasks, volumetric, 100-mL
Gas chromatograph [Hewlett-Packard (HP) 5890 or 6890 GC with HP 7673 or 6890
Series injector and O I Analytical Model 5220 electrolytic conductivity detector or
5360 halogen-specific detector; HP 5890 or 6890 equipped with HP 7673 or 6890
Series injector and HP 5970 or 5972 mass-selective detector]
Heating mantles, Glas-Col
Injection port insert, cyclo-double gooseneck, Restek
Magnetic stirrers, VWR, Model 200
Microsyringes, Hamilton
Mill, Hobart
Mill, Wiley
Multi-tube vortexer, VWR
N-EVAP evaporator, Organomation
Pipets, disposable and volumetric
Reservoirs, plastic, 75-mL
Robot Coupe vertical cutter/mixer
SPE cartridge, silica gel (1-g), J.T. Baker
SPE cartridge, C
8
(1-g), Varian
Teflon stirring bars, VWR
TurboVap Evaporator, Zymark
TurboVap vessels, 200-mL, Zymark
TurboVap vessel support rack, Zymark
Visiprep manifold, Supelco
Visidry vacuum manifold drying attachment, Supelco
4
Reagents
Acetone, Resi-Analyzed, J.T. Baker
Acetonitrile, Resi-Analyzed, J.T. Baker
BSTFA, Pierce
Ethyl acetate, Resi-Analyzed, J.T. Baker
Hexane, Resi-Analyzed, J.T. Baker
Hydrochloric acid (HCl) (36.5–38.0%), J.T. Baker
Methanol, Resi-Analyzed, J.T. Baker
Equivalent equipment and reagents may be substituted as appropriate, unless specified
otherwise in the method.
5
Sampling and preparation
Prior to analysis, samples should be chopped and finely pulverized with liquid nitrogen
using a large Hobart (forage, hay, fodder and straw samples) or a Wiley mill (grain
and seed samples). Recently, frozen crop matrices were processed more effectively
with a Robot Coupe vertical cutter/mixer without liquid nitrogen.

Sulfentrazone
569
6
Analytical procedures for nonoil crop matrices
6.1
Sample extraction, filtration and concentration
Weigh 10 g of the matrix into a 500-mL round-bottom boiling flask. For control
samples to be fortified, add an accurately measured volume of a standard solution
containing sulfentrazone, SCA and HMS uniformly to the matrix by syringe. Allow
the solvent to evaporate (ca 1 min). Add 150 mL of acetone–0.25 N HCl (3 : 1, v/v)
and a Teflon stirring bar or boiling stones. Place the round-bottom flask in a heating
mantle and attach the flask to a cooling condenser. Gently boil the solution under
reflux with stirring (if using a stirring bar) for 1 h.
Cool the sample extract to room temperature and filter the extract through a
Whatman No. 1 (11-cm) filter paper (pre-rinsed with 5 mL of acetone) into a filter
flask using a Buchner funnel and vacuum (15 inHg). Rinse the boiling flask with 2
×
25 mL of acetone and pass the rinsate through the post-reflux solid and filter paper.
Transfer the filtrate into a 200-mL TurboVap vessel. Rinse the filter flask with 5 mL of
acetone and add the rinsate to the TurboVap vessel. Concentrate the filtrate to
<25 mL
(not to dryness) using a TurboVap Evaporator (water-bath at 50
◦
C; increase the pres-
sure up to 30 psi as the volume decreases). All traces of acetone must be removed.
6.2
Second reflux (conversion of SCA to DMS and release
of conjugated HMS) and filtration
Transfer the aqueous concentrate into a 500-mL round-bottom boiling flask. Rinse
the TurboVap vessel with 2
× 5 mL of distilled water and add the rinsate to the round-
bottom boiling flask. Add 3.5 mL of concentrated HCl to the aqueous concentrate to
make the solution 1 N. Add a Teflon stirring bar or boiling stones. Place the round-
bottom flask in a heating mantle and attach the flask to a cooling condenser. Gently
boil the solution under reflux with stirring (if using a stirring bar) for 2 h.
Cool the sample extract to room temperature and filter the extract through a
Whatman GF/F (11-cm) fine filter paper (pre-rinsed with 5 mL of distilled water)
into a filter flask using a Buchner funnel and vacuum (15 inHg). Rinse the round-
bottom boiling flask with 2
× 10 mL of distilled water and pass the rinsate through
the post-reflux solid and filter paper. Transfer the filtrate into a 100-mL graduated
mixing cylinder. Rinse the filter flask with 2
× 10 mL of distilled water, and add the
rinsate to the mixing cylinder. Bring the volume up to 100 mL with distilled water.
Shake the sample and take a 5-g (50-mL) aliquot.
6.3
C
8
SPE cartridge
Place a C
8
cartridge (1-g, Varian) on a vacuum manifold and condition the column
with 6 mL of methanol followed by 6 mL of 0.25 N HCl. When conditioning SPE
cartridges, allow the first conditioning solvent to reach the top of the cartridge packing
before adding the second solvent. Maintain the flow rate through the C
8
cartridge at

570
Individual compounds
5 mL min
−1
by regulating the vacuum pump (5 inHg). The flow rate is more important
than the vacuum pressure. Close the cartridge and add an additional 3 mL of 0.25 N
HCl to the cartridge barrel. Attach a 75-mL plastic reservoir with an adapter to the top
of the C
8
cartridge. Transfer the 50-mL aqueous sample aliquot to the reservoir. Pass
the sample through the C
8
cartridge. Once the entire sample has passed through the C
8
SPE cartridge, use full vacuum briefly (2 min). Blow the cartridge completely dry with
nitrogen using a manifold drying attachment (30 psi for at least 30 min). Return the
C
8
SPE cartridge to the manifold and wash the cartridge with 6 mL of hexane–ethyl
acetate (19 : 1, v/v). Remove the C
8
cartridge and prepare the first silica gel cartridge.
6.4
C
8
SPE cartridge/first slica gel SPE cartridge
Place a silica gel cartridge (1-g, J.T. Baker) on the vacuum manifold and condition
with 6 mL of ethyl acetate followed by 6 mL of hexane. Do not allow the silica gel
cartridge to go dry at any time during this step. Maintain the flow rate through the
silica gel cartridge at 2 mL min
−1
by regulating the vacuum pump (5 inHg). Close the
cartridge and add 1 mL of hexane–ethyl acetate (7 : 3, v/v). Attach the C
8
cartridge to
the top of the silica gel cartridge with a reducing adapter. Add 3 mL of hexane–ethyl
acetate (7 : 3, v/v) to the C
8
cartridge. Open the connected cartridges and allow a
few drops to drip from the C
8
cartridge into the silica gel cartridge before applying
vacuum. This will help to prevent the silica gel cartridge from going dry. When the
first 3 mL have reached the top of the C
8
cartridge packing, add an additional 6 mL of
hexane–ethyl acetate (7 : 3, v/v). Allow the C
8
eluate to reach the top of the silica gel
cartridge packing. Remove the C
8
cartridge and discard. Wash the silica gel cartridge
with 3 mL of hexane–ethyl acetate (7 : 3, v/v). Elute and collect the analytes from
the silica gel cartridge with 6 mL of ethyl acetate in a 13-mL glass centrifuge tube.
Discard the silica gel cartridge. Evaporate the eluate under a slow nitrogen stream
(just enough to produce a ripple on the surface) in a water-bath (45
◦
C) to near dryness
(until a thin oily film remains; do not overdry).
6.5
Derivatization (silylation of 3-hydroxymethyl sulfentrazone)
Add 0.5 mL of acetonitrile and 100 µL of fresh BSTFA (Precaution: once the ampule
containing BSTFA is opened, the contents should be used within 10 min, since BSTFA
will absorb moisture) to the centrifuge tube containing the sample extract, stopper
the tube and vortex the sample for 15 s. Add 9.5 mL of hexane–ethyl acetate (9 : 1,
v/v) to make 10 mL. Cap the centrifuge tube and vortex the sample until the contents
are mixed (there should be no phase separation). If there is a phase separation, gently
warm the samples in a water-bath (45
◦
C) for 1 min. Vortex the sample again. If phase
separation persists, continue warming and vortexing the sample until the phases mix.
6.6
Second (post-derivatization) silica gel SPE cartridge
Place a silica gel cartridge (1-g, J.T. Baker) on a vacuum manifold and condition the
cartridge with 6 mL of ethyl acetate followed by 6 mL of hexane. Do not allow the

Sulfentrazone
571
cartridge to go dry at any time during this step. Maintain the flow rate through the
silica gel cartridge at about 2 mL min
−1
by regulating the vacuum pump (5 inHg).
Load the derivatized sample extract on to the cartridge. Rinse the centrifuge tube
twice, each with 3 mL of hexane–ethyl acetate (9 : 1, v/v), and add the rinsate to the
cartridge. Drain the rinsate to the top of the silica gel packing. Elute the analytes with
9 mL of ethyl acetate–hexane (1 : 1, v/v) into a 13-mL glass centrifuge tube. Discard
the silica gel cartridge. Add 1 mL of acetonitrile to the eluate. Evaporate the eluate
under a slow nitrogen stream (just enough to produce a ripple on the surface) in a
water-bath (45
◦
C) to near dryness (until a thin oily film remains; do not overdry).
Dilute the sample to the appropriate final volume with acetonitrile.
6.7
Analytical procedures for oily crop matrices
When analyzing oily crop matrices, e.g., sunflower seed and peanut nutmeat, the
above method for nonoil crop matrices needs to be slightly modified. Sample extracts
of the oily crop matrices need additional hexane and acetonitrile partitions prior to
the C
8
SPE cartridge. After acid reflux some of the sulfentrazone compounds tend to
adsorb on the oil drops which would not pass through the C
8
SPE cartridge. After the
second reflux with 1 N HCl, the entire sample extract is filtered, diluted and partitioned
with hexane. The hexane fraction is then partitioned with acetonitrile. The hexane is
discarded, the acetonitrile is concentrated to near dryness, and the container is used
to collect the eluate from the C
8
SPE cartridge in Section 6.4. The aqueous solution
is then passed through the C
8
SPE cartridge; the rest of the analytical procedures are
followed as described in Section 6.4.
6.8
Analytical procedures for crop refined oils
Crop refined oils should be dissolved in hexane and extracted in a separatory funnel
with 0.25 N HCl follow by an evaporation of residual hexane. Concentrated HCl is
then added to make the solution 1 N and the samples are boiled under reflux for 2 h.
The rest of the analytical procedures are followed as described in Section 6.4.
6.9
Instrumentation
GC was used to analyze the sample extracts. Three detection systems were used, two
for quantitation and one for analyte confirmation.
Gas chromatography/electrolytic conductivity detection (GC/ELCD) and gas
chromatography/halogen-specific detection (GC/XSD) are specific for halogenated
compounds and were effective for discriminating between sulfentrazone compounds
and the matrix components. Operating conditions are listed below.

572
Individual compounds
GC/ELCD instrument parameters
Instrument
HP 6890 gas chromatograph
Column
DB-35, 35% phenylmethylsilicone, 30 m
× 0.54-mm i.d.,
1.0-µm film thickness
Inlet
Splitless injection mode (cyclo-double gooseneck insert)
Detector
O I Analytical 5220 electrolytic conductivity detector,
halogen mode
Temperatures
Injection port
250
◦
C
Oven
180
◦
C/1 min (initial), 20
◦
C min
−1
(ramp), 260
◦
C/2 min
(hold), 5
◦
C min
−1
(ramp), 280
◦
C/4 min (final)
Reactor
900
◦
C
Column gas flow rate
He carrier gas, 16 mL min
−1
% 1-Propanol flow 37%
ELCD gas flow rates
H
2
+ carrier gas, unvented 135 mL min
−1
H
2
+ carrier gas, vented 85 mL min
−1
Injection volume
2 µL
GC/XSD instrument parameters
Instrument
HP 6890 gas chromatograph
Column
DB-17, (50% phenyl)silicone, 30 m
× 0.546-mm i.d.,
1.0-µm film thickness
Inlet
Splitless injection mode (cyclo-double gooseneck insert)
Detector
O I Analytical 5360 halogen-specific detector
Temperatures
Injection port
250
◦
C
Oven
180
◦
C/1 min (initial), 10
◦
C min
−1
(ramp), 260
◦
C/2 min
(hold), 5
◦
C min
−1
(ramp), 280
◦
C/5 min (final)
Reactor
1100
◦
C
Column gas flow rate
He carrier gas, 16 mL min
−1
XSD make-up flow rate
Air, 25 mL min
−1
Injection volume
2 µL
Operating conditions for spectral analyte confirmation
Instrument
HP 5890 or 6890 gas chromatograph
Column
DB-5MS, 5% phenylmethylsilicone, 15 m
× 0.25-mm
i.d., 0.25-µm film thickness
Inlet
Splitless injection mode (cyclo-double gooseneck insert)
Detector
HP 5970 or 5972 mass-selective detector
Temperature
Injection port
260
◦
C
Oven
120
◦
C/2 min (initial), 20
◦
C min
−1
(ramp), 280
◦
C/6 min
(final)
Detector
280
◦
C
Gas flow rate
He carrier gas, 1 mL min
−1
Injection volume
2 µL

Sulfentrazone
573
7
Method validation and quality control
7.1
Experimental design
The LOQ was validated by acceptable and reproducible recoveries of the respective
analytes from laboratory-fortified control samples. For hay and straw, the LOQ was
validated at 0.05 mg kg
−1
and the LOD was set at 0.01 mg kg
−1
. For all other matrices,
the LOQ was validated at 0.025 mg kg
−1
and the LOD was set at 0.005 mg kg
−1
. Each
analysis set contained a minimum of one control sample, one fortified control sample,
and several treated samples.
A calibration curve was generated for each analyte at the initiation of the analytical
phase of the study. Standard solutions for injection contained sulfentrazone, DMS
and/or derivatized HMS. Standard solutions were injected at the beginning of each
set of assays and after every two or three samples thereafter to gage the instrument
response.
7.2
Preparation of standards
Stock solutions of approximately 1 mg mL
−1
were prepared by dissolving the appro-
priate amounts of the analytical standards in acetonitrile. Working standard solutions
for fortification were prepared in volumetric flasks by appropriate dilutions of the
stock solutions for each analyte or combination of analytes. During analysis, SCA is
converted to DMS and HMS is derivatized; therefore, the analytical standard solu-
tions for quantitation and instrument calibration contained sulfentrazone, DMS and
derivatized HMS. A measured volume of a standard solution containing sulfentra-
zone, DMS and HMS (prepared from stock solutions) was derivatized simultaneously
with the samples.
7.3
Calculation
The amounts of sulfentrazone, SCA (analyzed as DMS), and HMS were quantitated by
an external standard calibration method. A computer spreadsheet program (Microsoft
Excel) was used for calculation and reporting.
The amount of sample injected was determined by the following equation:
Amount of sample injected (mg)
=
initial aliquot weight (mg)
final sample extract volume (µL)
× sample extract volume injected (µL)
An equation representing area versus concentration was determined using a standard
linear regression analysis applied to the injection standards yielding a slope m and an
intercept b. The following equation was then used to calculate the concentration of

574
Individual compounds
the sample injected from the area measured:
Concentration of sample (ng µL
−1
)
=
area of sample
− b
m
The amount of analyte (in nanograms) detected in a sample injection was calculated
by multiplying the concentration calculated above by the injection volume. Then the
concentration detected (in ppm) was determined by dividing this result by the amount
Table 1
Recoveries from fortified samples
% Recovery (average
± SD)
Fortification levels
No. of
Matrix
(mg kg
−1
)
analyses
Sulfentrazone
SCA
HMS
Soybean seed
0.025
4
80
± 7
NA
82
± 14
Soybean hulls
0.025
1
75
NA
80
Soybean meal
0.025
1
76
NA
70
Soybean refined oil
0.025
3
73
± 8
NA
90
± 14
Corn grain
0.025
3
91
± 11
87
± 1
79
± 2
Corn forage
0.025
2
85
82
76
Corn fodder
0.025, 0.05
3
87
± 9
75
± 6
76
± 3
Corn flour
0.025
1
99
102
98
Rice grain
0.025, 0.05
3
104
± 10
97
± 18
89
± 3
Rice straw
0.05, 0.5
2
98
125
86
Rice hulls
0.025
1
95
99
98
Rice bran
0.025
1
77
69
72
Rice, polished
0.025
1
118
72
81
Sorghum grain
0.025
2
95
82
95
Sorghum forage
0.025, 0.05
2
89
86
96
Sorghum fodder
0.025, 0.1
2
84
76
73
Wheat grain
0.025
2
96
120
83
Wheat forage
0.025, 0.1
2
91
89
83
Wheat hay
0.05, 0.2
2
88
89
85
Wheat straw
0.05, 0.5
2
87
114
102
Pea
0.025
4
93
± 18
70
± 9
87
± 12
Alfalfa forage
0.0125, 0.025, 0.05, 0.25
10
105
± 17
93
± 15
90
± 13
Alfalfa hay
0.025, 0.25, 0.2, 1.0
10
75
± 9
82
± 12
85
± 15
Sunflower seed
0.05, 0.5
8
77
± 14
86
± 15
89
± 15
Sunflower meal
0.05, 0.5
6
84
± 6
73
± 9
74
± 5
Sunflower refined oil
0.05, 0.5
6
90
± 5
103
± 8
77
± 4
Sugarcane
0.025, 0.05
5
82
± 3
70
± 6
74
± 3
Refined sugar
0.025, 0.05
2
91
99
87
Molasses
0.025, 0.05
2
94
96
95
Peanut
0.025, 0.05, 0.1, 0.2
7
68
± 5
77
± 5
84
± 7
Peanut meal
0.025
1
68
64
74
Peanut refined oil
0.025, 0.05
3
100
± 11
86
± 10
84
± 7
Potato
0.05, 0.5, 1.0
16
100
± 7
106
± 11
87
± 11
Potato flakes
0.05
1
76
120
84
Potato wet peels
0.25, 0.5
2
121
91
93
Potato chips
0.05, 0.25, 0.5
3
99
± 4
97
± 19
82
± 16

Sulfentrazone
575
of sample injected:
Detected or uncorrected ppm (ng mg
−1
)
=
conc. of sample (ng µL
−1
)
× inj. volume (µL)
amount of sample injected (mg)
No correction for molecular weights was necessary for derivatized HMS, because
the injection standards were derivatized simultaneously with the samples. However,
a correction factor was needed for calculating the recovered amount of SCA since
the SCA was quantitated as DMS. The correction factor (molecular weight ratio)
between SCA and DMS was 1.12 (417/373; 417
= molecular weight of SCA and
373
= molecular weight of DMS). To calculate the amount of SCA, use the above
equation, which will yield DMS (ng), then multiply that value by 1.12 to convert to
nanograms of SCA.
The uncorrected ppm of the fortified control samples was divided by the fortification
level and multiplied by 100% to calculate the method recovery (%). The following
equation was used:
Method recovery (%)
=
uncorrected mg kg
−1
− control mg kg
−1
fortification level (mg kg
−1
)
× 100
The LOD was calculated as the concentration of analyte (ppm equivalent) at one-fifth
the area of the LOQ level standard, or one-fifth the LOQ, whichever was larger.
7.4
Time required for analysis
For a set of 10 samples, the analytical method can be completed within 16 laboratory
hours from the time of sample weighing to GC injection.
7.5
Accuracy and precision
The accuracy and precision of the analytical methods were determined by the average
and standard deviation of individual method recoveries of the fortified-control sam-
ples in 40 different matrices (see Table 1). These methods were also demonstrated
to be very rugged based on the results of accuracy and precision for a variety of crop
matrices.
8
Important points
After the initial extraction with acetone–0.25 N HCl, all traces of acetone must be
removed using a TurboVap Evaporator. Traces of solvent can lead to analyte loss
through the SPE cartridge(s).

576
Individual compounds
The proper elution and wash solvent composition and the volume and flow rate
through the cartridges must be determined. The SPE steps are critical to the separation
and cleanup of the sample extract. Listed brands for C
8
and silica gel cartridges should
be used, if possible.
After passing the sample solution through the C
8
cartridge, the cartridge and mani-
fold must be completely dry. Extend the drying time if necessary. Rinsing the manifold
with acetone prior to elution is a good practice. Traces of aqueous solution may in-
terfere with subsequent derivatization.
BSTFA should be used within 10 min after opening the ampule to ensure complete
derivatization. BSTFA readily absorbs moisture, which will interfere with derivati-
zation.
If final sample solutions will be stored for several days, the derivatization of the
HMS metabolite may reverse. If the derivatization has reversed, the HMS method
recovery would be low and an additional broad peak (underivatized HMS) would be
visible after the derivatized HMS peak. In this case, add 10 µL of fresh BSTFA to
the final sample solution in the GC vial, vortex the sample for several seconds and
re-inject the sample solution.
Optimizing the GC instrument is crucial for the quantitation of sulfentrazone
and its metabolites. Before actual analysis, the temperatures, gas flow rates, and
the glass insert liner should be optimized. The injection standards must have a low
relative standard deviation (
<15%) and the calibration standards must have a cor-
relation coefficient of at least 0.99. Before injection of the analysis set, the column
should be conditioned with a sample matrix. This can be done by injecting a ma-
trix sample extract several times before the standard, repeating this ‘conditioning’
until the injection standard gives a reproducible response and provides adequate
sensitivity.
Operation of the ELCD and XSD instruments must be optimized for greatest
sensitivity. Operating the ELCD instrument in tandem with another detector
may cause a decrease in sensitivity. More recently, liquid chromatography/mass
spectrometry (LC/MS) and liquid chromatography/tandem mass spectrometry
(LC/MS/MS) have been evaluated as possible alternative methods for sulfen-
trazone compounds in crop matrices. The LC/MS methods allow the chemical
derivatization step to be avoided, reducing the analysis time. However, the final
sample extracts, after being cleaned up extensively using three SPE cartridges,
still exhibited ionization suppression due to the matrix background. Acceptable
method recoveries (70–120%) of sulfentrazone compounds have not yet been ob-
tained.
9
Storage stability
Storage stability studies for sulfentrazone compounds on crop matrices showed a
pattern of stability for at least 3–38 months, depending on the study program or the
maximum sample storage interval for the study.

Sulfentrazone
577
Acknowledgments
The author gratefully thanks J.R. Arabinick, D. Baffuto, G.P. Barrett, J. Carroll, J.F.
Culligan, J.M. Fink, D.J. Letinski, E.M. McCoy, M.C. Reel, N.A. Shevchuk, C.M.
Suero, and M. Xiong for their help with sample preparation and analysis.
Andrey Chen
FMC, Princeton, NJ, USA
Document Outline
- Front Matter
- Table of Contents
- Volume I
- Regulatory Guidance and Scientific Consideration for Residue Analytical Method Development and Validation
- Best Practices in the Generation and Analysis of Residues in Crop, Food and Feed
- Compound Class
- Individual Compounds
- Bispyribac-Sodium
- Carfentrazone-Ethyl
- Flucarbazone-Sodium
- Flumetralin
- Flumioxazin
- Isoxaflutole
- Orbencarb
- Prodiamine
- Prohexadione-Calcium
- Pyraflufen-Ethyl
- Pyriminobac-Methyl
- Pyrithiobac-Sodium
- Sulfentrazone
- 1. Introduction
- 2. Method Description
- 3. Apparatus
- 4. Reagents
- 5. Sampling and Preparation
- 6. Analytical Procedures for Nonoil Crop Matrices
- 6.1 Sample Extraction, Filtration and Concentration
- 6.2 Second Reflux (Conversion of SCA to DMS and Release of Conjugated HMS) and Filtration
- 6.3 C8 SPE Cartridge
- 6.4 C8 SPE Cartridge/First Slica Gel SPE Cartridge
- 6.5 Derivatization (Silylation of 3-Hydroxymethyl Sulfentrazone)
- 6.6 Second (Post-Derivatization) Silica Gel SPE Cartridge
- 6.7 Analytical Procedures for Oily Crop Matrices
- 6.8 Analytical Procedures for Crop Refined Oils
- 6.9 Instrumentation
- 7. Method Validation and Quality Control
- 8. Important Points
- 9. Storage Stability
- Acknowledgments
- Terbacil
- Thenylchlor
- Trinexapac-Ethyl
- Volume II
- Index
Wyszukiwarka
Podobne podstrony:
Boch8 04m 01
04M Chwytak do drewna, WÓZKI WIDŁOWE WIADOMOŚCI TESTY 2009 NA EGZAMIN, DOKUMENTY UDT
Boch8 04m 01
91942 08w
91942 abb
91942 08q
91942 08p
91942 04b
91942 08u
91942 06c
91942 04i
91942 01c
91942 03c
91942 01a
więcej podobnych podstron