

Create a Balanced Scorecard
SharePoint Business Intelligence Content Team
Summary: Learn how to create scorecards and strategy maps across various
measurements and display them in one dashboard by using PerformancePoint
Services in Microsoft SharePoint Server 2010.
Category: Quick Step-by-Step
Applies to: SharePoint Server 2010
Source:
http://technet.microsoft.com/en-us/library/hh750382
E-book publication date: June 2012

Copyright © 2012 by Microsoft Corporation
All rights reserved. No part of the contents of this book may be reproduced or transmitted in any form or by any
means without the written permission of the publisher.
Microsoft and the trademarks listed at
http://www.microsoft.com/about/legal/en/us/IntellectualProperty/Trademarks/EN-US.aspx are trademarks of the
Microsoft group of companies. All other marks are property of their respective owners.
The example companies, organizations, products, domain names, email addresses, logos, people, places, and events
depicted herein are fictitious. No association with any real company, organization, product, domain name, email
address, logo, person, place, or event is intended or should be inferred.
This book expresses the author’s views and opinions. The information contained in this book is provided without any
express, statutory, or implied warranties. Neither the authors, Microsoft Corporation, nor its resellers, or distributors
will be held liable for any damages caused or alleged to be caused either directly or indirectly by this book.

Contents
How to create a Balanced Scorecard ................................................................................................ 4
How to open Dashboard Designer ..................................................................................................... 5
Define KPIs for a Balanced Scorecard............................................................................................... 7
Create and configure PerformancePoint data connections ................................................................. 9
Financial KPIs .............................................................................................................................. 12
Customer KPIs ............................................................................................................................ 16
Internal KPIs ................................................................................................................................ 18
Learning and Growth KPIs ........................................................................................................... 22
Create and configure a strategy map as part of a Balanced Scorecard that you create by using
Dashboard Designer ....................................................................................................................... 26
Create and configure a Visio diagram to use in a Balanced Scorecard ............................................ 26
Create and configure a strategy map report by using Dashboard Designer ...................................... 28
Create a Balanced Scorecard by using
Published: January 4, 2012
PerformancePoint Services in Microsoft SharePoint Server 2010 enables you to create and use
powerful dashboards. This includes a Balanced Scorecard.
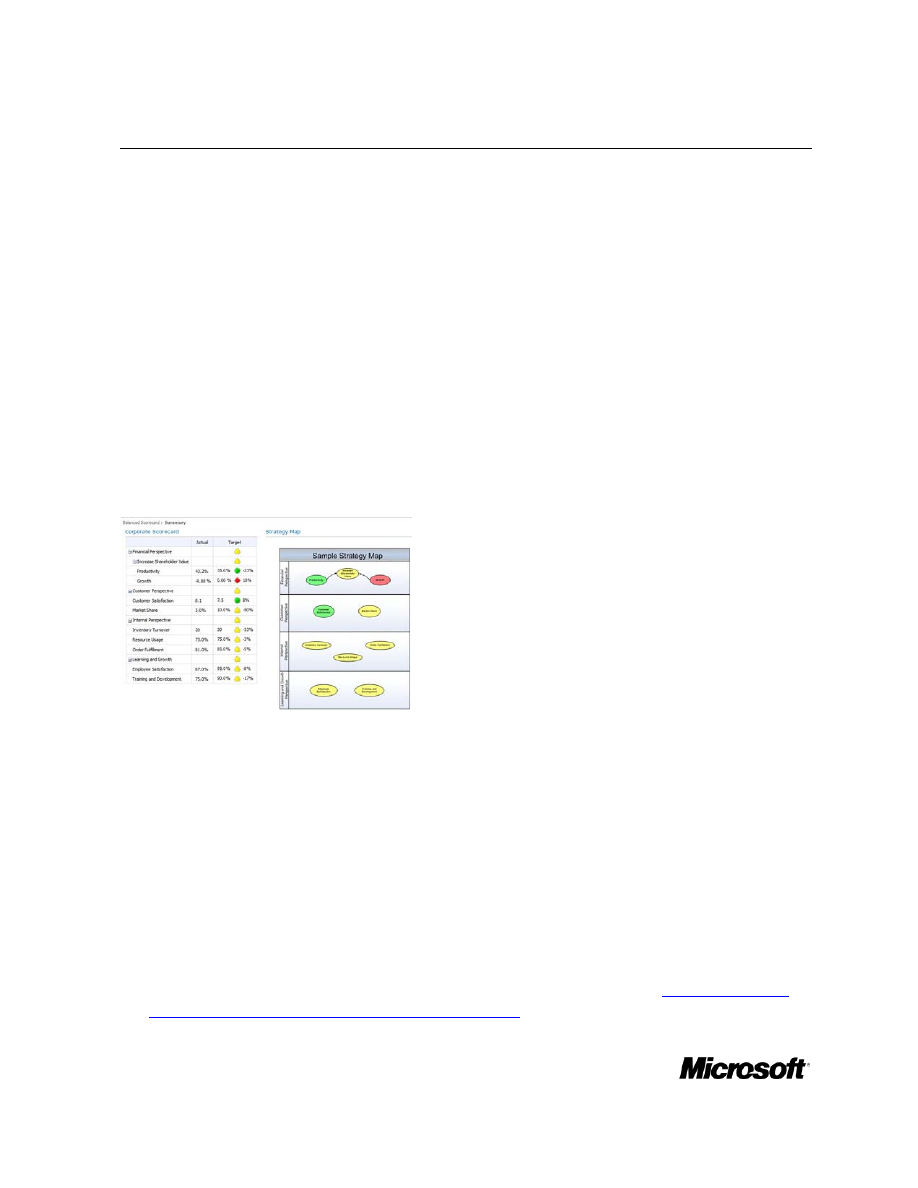
A Balanced Scorecard provides a high-level view of organizational performance at a glance. In
PerformancePoint Services, a Balanced Scorecard consists of a dashboard page that contains a
scorecard and a corresponding strategy map. The scorecard and the strategy map show performance
information for key performance indicators (KPIs) across four main areas or perspectives:
•
Financial perspective KPIs for productivity, revenue, growth, usage, and overall shareholder
value.
•
Customer perspective KPIs for customer acquisition, customer satisfaction rates, market share,
and brand strength.
•
Internal perspective KPIs for resource usage, inventory turnover rates, order fulfillment, and
quality control.
•
Learning and growth perspective KPIs for employee retention, employee satisfaction, and
employee training and development.
An example Balanced Scorecard might resemble the following image:
This example was created by using PerformancePoint Services. The articles in this section describe
how to create a similar Balanced Scorecard that you can use in your organization.
How to create a Balanced Scorecard
To create a Balanced Scorecard by using PerformancePoint Services, you typically use the following
process:
1. Identify the KPIs that you want to use. Make a list of those KPIs and the data sources that you must
have to create them. For the example Balanced Scorecard, we use a SQL Server Analysis
Services cube, a table that is stored in SQL Server, and several fixed values that we enter manually
to create the KPIs.
2. Create a scorecard that includes KPIs across the financial, customer, internal, and learning and
growth perspectives. To create a scorecard that resembles the example, see

3. Create a strategy map that uses a Microsoft Visio diagram to represent the four perspectives
described earlier in this article. To create a strategy map that resembles the example, see
4. Add the scorecard and strategy map to a dashboard page, and publish it to SharePoint Server
2010. For more information, see
Assemble and publish a Balanced Scorecard by using Dashboard
Before you begin, make sure that you open PerformancePoint Dashboard Designer.
How to open Dashboard Designer
You can open Dashboard Designer by using the Business Intelligence Center.
To install and open Dashboard Designer
1. Open the Business Intelligence Center site in a Web browser.
Tip:
The Web site address (URL) to the Business Intelligence Center typically takes the form
http://<ServerName>/sites/BICenter. If you do not know the location of the Business
Intelligence Center site, contact a SharePoint administrator.
2. In the Business Intelligence Center, click a section — for example,
Monitor Key Performance,
Build and Share Reports, or Create Dashboards.
More information about each area is displayed in the center pane.
3. In the center of the page, click a
Start using PerformancePoint Services link.
The PerformancePoint site template opens.
4. Click
Run Dashboard Designer.
After you have opened Dashboard Designer at least one time, you can open it from the
Start menu on
your computer. To do that, click
Start, and then click All Programs. Locate SharePoint, and then click
PerformancePoint Dashboard Designer. Alternatively, you can continue to open Dashboard Designer
from the Business Intelligence Center.
Important:
Before you begin to create items by using Dashboard Designer, make sure that you have at
least Design permissions assigned to you in SharePoint Server. Also make sure that you have
at least Read permissions to the data sources that you want to use for the Balanced Scorecard.
For more information, contact a SharePoint administrator.
Other Resources
Plan, design, and implement a PerformancePoint dashboard
Business Intelligence Scenarios and Solutions
Create a scorecard for a Balanced Scorecard by
Published: January 4, 2012
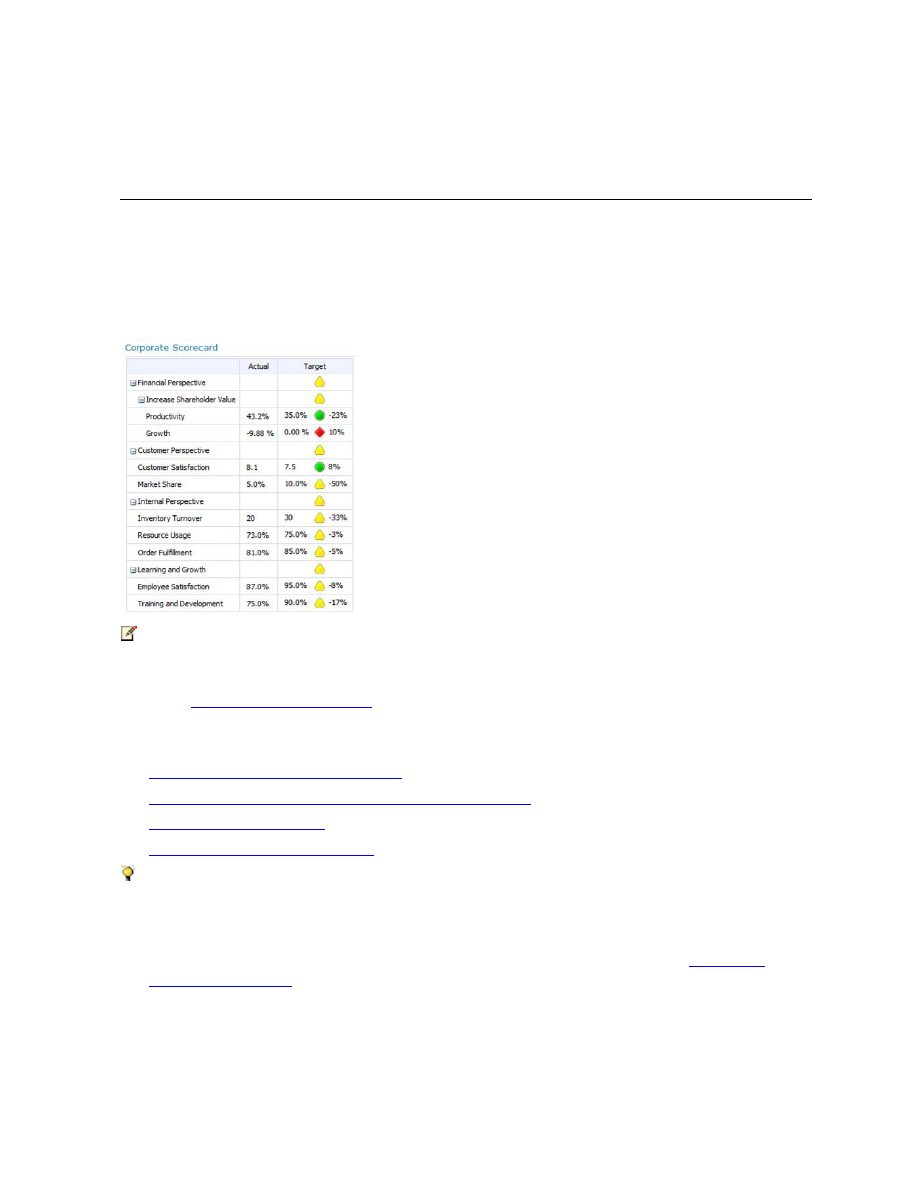
A Balanced Scorecard includes a scorecard and a corresponding strategy map to display performance
across four main organizational perspectives: financial perspective, customer perspective, internal
perspective, and learning and growth perspective.
This article describes how to create and configure an example PerformancePoint scorecard to use as
part of a Balanced Scorecard. The scorecard described in this article resembles the following image:
Note:
For the example scorecard, we use a combination of fixed values and sample data from the
Microsoft Contoso BI Demo Dataset for Retail Industry. To download and install this dataset, go
to the
(http://go.microsoft.com/fwlink/p/?LinkId=219170).
When you create a scorecard to use as part of a Balanced Scorecard, you typically use the following
process:
1.
Define KPIs for a Balanced Scorecard
2.
Create and configure PerformancePoint data connections
3.
4.
Create and assemble a scorecard
Tip:
The KPIs that are described in this article are for informational purposes only to show how you
can use PerformancePoint Services to create lots of KPIs that use different data sources and
calculations. The KPIs that you use for your organization will likely vary from the examples that
we describe in this article. For more information about Balanced Scorecards, see
(http://go.microsoft.com/fwlink/p/?LinkId=237539).

Define KPIs for a Balanced Scorecard
You can organize the KPIs in a Balanced Scorecard into four perspectives: financial, customer, internal,
and learning and growth.
The following table describes the KPIs that we use in the example scorecard.
KPI
Description
Data source
Financial perspective
Financial Perspective KPIs show
performance for metrics such as
revenue, growth, productivity,
and other metrics related to
increasing shareholder value.
In the example scorecard, the
Financial Perspective KPI shows
overall performance for the
Increase Shareholder Value,
Productivity, and Growth KPIs.
None
This KPI is an objective KPI that
shows information based on the
KPIs that are nested underneath
it.
Increase Shareholder Value
The Increase Shareholder Value
KPI shows overall performance
for the Productivity and Growth
KPIs.
None
This KPI is an objective KPI that
shows information based on the
KPIs that are nested underneath
it.
Productivity
The Productivity KPI shows
performance as measured by
calculating the cost of sales as a
percentage of total sales.
Sales data
This KPI uses data in the Sales
cube of the ContosoRetailDW
database.
Growth
The Growth KPI shows
performance as measured by
growth in sales for the current
year compared to growth in sales
for the previous year.
Sales data
This KPI uses data in the Sales
cube of the ContosoRetailDW
database. This KPI can also use
Time Intelligence functionality to
show information for a particular
period of time.
Customer perspective
Customer perspective KPIs show
performance for metrics such as
customer satisfaction, customer
retention, brand strength, and
market share.
In the example scorecard, the
customer perspective KPI shows
overall performance for the
Customer Satisfaction and
Market Share KPIs.
None
This KPI is an objective KPI that
shows information based on the
KPIs that are nested underneath
it.
Customer Satisfaction
The Customer Satisfaction KPI
shows performance as
External data that is manually

KPI
Description
Data source
measured by overall customer
satisfaction.
entered
This KPI uses fixed values that
we specify.
Market Share
The Market Share KPI shows
performance as measured by
current market share.
External data that is manually
entered
This KPI uses fixed values that
we specify.
Internal perspective
Internal KPIs show performance
for metrics such as operations
management, order fulfillment,
and quality control.
In the example scorecard, the
Internal perspective KPI shows
overall performance for the
Inventory Turnover and
Resource Usage KPIs.
None
This KPI is an objective KPI that
shows information based on the
KPIs that are nested underneath
it.
Inventory Turnover
The Inventory Turnover KPI
shows performance as
measured by calculating the
number of inventory cycles that
occurred during the past year.
Sales and Inventory data
This KPI uses data in the Sales
cube and in the Inventory fact
table in the ContosoRetailDW
database. This KPI also uses
Calculated Metrics and Time
Intelligence functionality
Resource Usage
The Resource Usage KPI shows
performance as measured by the
percentage of time sales
representatives are engaged in
selling activities.
External data that is manually
entered
This KPI uses fixed values that
we specify.
Order Fulfillment
The Order Fulfillment KPI shows
performance as measured by
dividing current inventory by
units sold and comparing that
value to a target value.
External data that is manually
entered
This KPI uses fixed values that
we specify.
Learning and growth perspective Learning and growth perspective
KPIs show performance for
metrics such as employee
satisfaction, employee retention,
and employee training and
development.
In the example scorecard, the
Learning and growth perspective
KPI shows overall performance
for the Employee Satisfaction
and Training and Development
None
This KPI is an objective KPI that
shows information based on the
KPIs that are nested underneath
it.

KPI
Description
Data source
KPIs.
Employee Satisfaction
The Employee Satisfaction KPI
shows performance as
measured by overall employee
satisfaction.
External data that is manually
entered
This KPI uses fixed values that
we specify.
Training and Development
The Training and Development
KPI shows performance as
measured by the percentage of
employees who have completed
mandatory and recommended
training programs.
External data that is manually
entered
This KPI uses fixed values that
we specify.
After defining the KPIs to use for the scorecard, the next step is to create the PerformancePoint data
connections that are needed for some of those KPIs.
Important:
Before you begin to perform the tasks that are described in this article, verify that the following
prerequisites are met:
•
You have at least Design permissions assigned to you in SharePoint Server.
•
You have at least Read permissions assigned in the SQL Server databases that are used for
the scorecard.
•
Dashboard users have at least Read permissions assigned in SharePoint Server and in the
SQL Server databases that are used.
For more information, see
Authorization and permissions in PerformancePoint Services
Create and configure PerformancePoint data
This section describes how to create PerformancePoint data connections to data sources that are used
for some of the example KPIs. Often, organizations will use different data sources, such as tables that
are stored in Excel Services and SQL Server, cubes that are stored in SQL Server Analysis Services,
and fixed values that dashboard authors enter manually.
Important:
The procedures in this section assume that PerformancePoint Services is configured by using
the Unattended Service Account. If your organization is using another security model, the steps
that you follow to create a connection to a data source might vary. For more information,
see
Create data connections (PerformancePoint Services)
First, create a connection to an Analysis Services data cube. The following procedure describes how to
create a connection to the Sales cube in the ContosoRetailDW database.

To create a data connection to the Sales cube in the ContosoRetailDW database
in Analysis Services
1. In the
Workspace Browser, click Data Connections.
2. On the
Create tab, click Data Source.
The Select a Data Source Template dialog box appears.
3. In the
Category pane, select All, in the Template pane, click Analysis Services, and then click OK.
A new data source opens for editing in the center pane.
4. In the center pane, on the
Editor tab, do the following:
a) In the
Connection Settings section, specify the name of the server where the Analysis
Services data is stored.
The
Database list is populated.
b) In the
Database list, select ContosoRetailDW.
The
Cube list is populated.
c) In the
Cube list, select ContosoRetailDW.
d) Click
Test Data Source.
A
Test Connection dialog box appears to confirm that you have successfully created the
data connection.
e) After you have tested the connection, close the
Test Connection dialog box.
5. In the center pane, click the
Time tab, and then perform the steps in the following list to configure
the data connection to work with Time Intelligence. Doing this configuration enables you to add a
Time Intelligence filter to at least one KPI as described later in this article. For more information
about Time Intelligence, see
PerformancePoint Time Intelligence quick reference
a) In the
Reference Data Mapping section, in the Time Dimension list, select
Date.Calendar YQMD.
This is a calendar-year time dimension that contains year, quarter, month, and day
hierarchies.
b) In the
Reference Member section, in the Choose a date to begin the year for the
selected time dimension box, type 2007-01-01.
This value corresponds to the first day of the first year of data in the cube.
c) In the
Hierarchy level list, select Day.
This enables you to use Time Intelligence formulas to display information at the day level.
d) In the
Reference Date section, type 1/1/2007.
e) In the
Time Member Associations section, use the lists in the Time Aggregation column
to specify the settings that are listed in the following table:
Time Aggregation
Calendar Year
Year
Calendar Quarter
Quarter
Calendar Month
Month

Member Level
Time Aggregation
Date
Day
This helps align the dimension members with the correct hierarchies in the time dimension.
6. In the center pane, click the
Properties tab, and then specify the following settings:
•
In the
Name box, type a name such as Contoso Retail Sales for the data connection.
•
Optionally, in the
Description box, type a description for the data source.
•
Optionally, next to the
Display Folder box, click the Browse button, and then specify or create
a display folder for the data source.
7. In the
Workspace Browser, right-click the data source, and then click Save.
The next step is to create a data connection to a table that is stored in SQL Server. This is a second
data source that you will use for at least one KPI later in this article.
To create a data connection to the Inventory fact table in SQL Server
1. In the
Workspace Browser, click Data Connections.
2. On the
Create tab, click Data Source.
The
Select a Data Source Template dialog box appears.
3. In the
Category pane, select All, in the Template pane, click SQL Server Table, and then click
OK.
A new data source opens for editing in the center pane.
4. In the center pane, on the
Editor tab, do the following:
a) In the
Connection Settings section, specify the name of the server where the data is
stored.
The
Database list is populated.
b) In the
Database list, select the ContosoRetailDW.
The
Table list is populated.
c) In the
Table list, select dbo.FactInventory.
d) Click
Test Data Source.
A
Test Connection dialog box appears to confirm that you have successfully created the
data connection.
e) Test the connection, and then close the
Test Connection dialog box.
5. In the center pane, click the
Properties tab, and then specify the following settings:
•
In the
Name box, type a name such as Contoso Inventory for the data connection.
•
Optionally, inn the
Description box, type a description for the data source.
•
Optionally, next to the
Display Folder box, click the Browse button, and then specify or create
a display folder for the data source.
6. In the
Workspace Browser, right-click the data source, and then click Save.
After creating and configuring the data sources, the next step is to create KPIs.

This section describes how to create KPIs that resemble those that are used in the example scorecard
and that are organized into the following four perspectives:
•
•
•
•
Note:
In this article, we describe how to create lots of KPIs. Some KPIs use different data sources,
Calculated Metrics, and Time Intelligence, whereas other KPIs use fixed values.
PerformancePoint Services enables you to easily create simple or sophisticated KPIs that use
the same or different data sources. You can create the KPIs that we describe in this article, or
you can create other KPIs to use in a scorecard.
In this section, we describe how to create the following four example KPIs:
•
Financial Perspective
•
Increase Shareholder Value
•
Productivity
•
Growth
We begin by creating the Financial Perspective KPI. This KPI is an objective KPI that does not require a
data source or specified target and actual values.
To create the Financial Perspective KPI
1. In Dashboard Designer, in the
Workspace Browser, click PerformancePoint Content.
2. On the
Create tab, click KPI.
3. In the
Select a KPI Template dialog box, click Objective, and then click OK.
The KPI opens for editing with the
Editor tab open in the center pane.
4. In the center pane, click the
Properties tab, and then specify the following settings:
•
In the
Name box, type Financial Perspective.
•
Optionally, in the
Description box, type a description for the KPI.
•
Optionally, in the
Person Responsible box, type the name of the person who is responsible for
overall financial performance.
•
Optionally, next to the
Display Folder box, click the Browse button, and then specify or create
a display folder for the KPI.
5. In the
Workspace Browser, right-click the Financial Perspective KPI, and then click Save.
The next step is to create the Increase Shareholder Value KPI. Because this KPI is also an objective
KPI, we can create a copy of the Financial Perspective KPI, and then change its name and other
details.
To create the Increase Shareholder Value KPI

1. In the
Workspace Browser, right-click the Financial Perspective KPI, and then click Copy.
2. In the
Workspace Browser, point to a folder such as PerformancePoint Content or point to a
display folder in the
PerformancePoint Content section, right-click to open a shortcut menu, and
then click
Paste.
A copy of the Financial Perspective KPI opens for editing, with the
Editor tab open in the center
pane.
3. In the center pane, click the
Properties tab, and then specify the following settings:
•
In the
Name box, type Increase Shareholder Value.
•
Optionally, in the
Description box, type a description for the KPI.
•
Optionally, in the
Person Responsible box, type the name of the person who is responsible for
managing shareholder value.
•
Optionally, next to the
Display Folder box, click the Browse button, and then specify or create
a display folder for the KPI.
4. In the
Workspace Browser, right-click the Increase Shareholder Value KPI, and then click Save.
After you have created two objective KPIs for the Financial Perspective, the next step is to create the
Productivity KPI.
In the following example, we measure productivity by calculating expense (cost of sales) as a
percentage of revenue (total sales). We create a KPI that uses Calculated Metrics by using the Sales
cube in the ContosoRetailDW sample database.
To create the Productivity KPI
1. On the
Create tab, click KPI.
The
Select a KPI Template dialog box appears.
2. Click
Blank KPI, and then click OK.
The new KPI opens for editing with the
Editor tab open in the center pane.
3. Configure the
Actual value for this KPI by following these steps:
a) In the
Actual row, in the Data Mappings column, click the blue hypertext that says 1
(Fixed values).
The
Fixed Values Data Source Mapping dialog box appears.
b) Click the
Change Source button to open the Select a Data Source dialog box.
c) Select the
Calculated Metric tab, in the Templates section, click Blank Calculation, and
then click
OK.
The Calculated Metrics Data Source Mapping dialog box appears.
d) In the
Name box, select the text that says Value1, and type SalesCost.
e) In the
Source column for the SalesCost row, click the blue hypertext that says 1 (Fixed
Values).
The
Fixed Values Data Source Mapping dialog box appears.
f) Click
Change Source to open the Select a Data Source dialog box.
g) Select the Contoso Retail Sales data source, and then click
OK.
The
Dimensional Data Source Mapping dialog box appears.

h) In the
Select a measure list, select Sales Total Cost, and then click OK to close the
Dimensional Data Source Mapping dialog box and return to the Calculated Metrics Data
Source Mapping dialog box.
i) In the
Calculated Metrics Data Source Mapping dialog box, in the Name box, select the
text that says
Value2, and then type TotalSales.
j) In the
Source column for the TotalSales row, click the blue hypertext that says 1 (Fixed
Values).
The
Fixed Values Data Source Mapping dialog box appears.
k) Click
Change Source to open the Select a Data Source dialog box.
l) Select the Contoso Retail Sales data source, and then click
OK.
The
Dimensional Data Source Mapping dialog box appears.
m) In the
Select a measure list, select Sales Amount, and then click OK to close the
Dimensional Data Source Mapping dialog box and return to the Calculated Metrics Data
Source Mapping dialog box.
n) In the
Calculated Metrics Data Source Mapping dialog box, in the Formula box, type the
formula
SalesCost/TotalSales, and then click OK.
4. Configure the Target value for this KPI by following these steps:
a) In the
Target row, in the Data Mappings column, click the blue hypertext that says 1
(Fixed values).
The
Fixed Values Data Source Mapping dialog box appears.
b) In the
Value box, type .35.
This is a fixed value that represents 35%, a threshold for cost of sales. In this example,
good performance means the cost of sales is less than 35% of the total sales.
c) Click
OK to close the Fixed Values Data Source Mapping dialog box.
5. In the
Actual row, in the Number column, click the blue hypertext that says (Default) to open the
Format Numbers dialog box.
6. In the
Format list, select Percentage, and then click OK.
7. Repeat steps 5 and 6 for the
Target row.
8. In the
Thresholds section, click Set Scoring Pattern and Indicator to open the Edit Banding
Settings dialog box.
9. In the
Scoring pattern list, select Decreasing is Better, and then click Next.
10. On the
Select an Indicator page, click Next.
11. On the
Specify the worst value page, type 1, and then click Finish.
This corresponds to 100%, which would mean that in a worst-case scenario, the cost of sales
would equal the total sales.
12. In the center pane, click the
Properties tab, and then specify the following settings:
•
In the
Name box, type Productivity.
•
Optionally, in the
Description box, type a description for the KPI.
•
Optionally, in the
Person Responsible box, type the name of the person who is responsible for
productivity.

•
Optionally, next to the
Display Folder box, click the Browse button, and then specify or create
a display folder for the KPI.
13. In the
Workspace Browser, right-click the Productivity KPI, and then click Save.
After creating the Productivity KPI, the next step is to create and configure the Growth KPI. In this
example, growth is measured by comparing growth in sales for the current year to growth in sales for
the previous year. The Growth KPI uses Time Intelligence functionality.
To create the Growth KPI
1. On the
Create tab, click KPI.
The Select a KPI Template dialog box appears.
2. Click
Blank KPI, and then click OK.
The new KPI opens for editing with the
Editor tab open in the center pane.
3. Configure the Actual value for the KPI by following these steps:
a) In the
Actual row, in the Data Mappings column, click the blue hypertext that says 1 (Fixed
Values).
b) In the
Fixed Values Data Source Mapping dialog box, click Change Source.
c) Select the Contoso Retail Sales data source, and then click
OK.
The
Dimensional Data Source Mapping dialog box appears.
d) In the
Select a measure list, select Sales Amount Growth (Calendar Year).
e) In the
Select a dimension section, click New Time Intelligence Filter.
f) In the
Time Formula Editor dialog box, in the Time Formula pane, type Year-3, and then
click
OK.
Note:
Use
Year-3 here because the Contoso Retail Sales database contains data for the calendar
years 2007, 2008, and 2009 only. This
Year-3 value causes the scorecard to display
information as of 2009 when the actual calendar year is 2012.
4. Configure the Target value for the KPI by following these steps:
a) In the
Target row, in the Data Mappings column, click the blue hypertext that says 1 (Fixed
Values).
b) In the
Fixed Values Data Source Mapping dialog box, click Change Source.
c) Select the Contoso Retail Sales data source, and then click
OK.
The
Dimensional Data Source Mapping dialog box appears.
d) In the
Select a measure list, select Sales Amount Growth (Calendar Year).
e) In the
Select a dimension section, click New Time Intelligence Filter.
f) In the
Time Formula Editor dialog box, in the Time Formula pane, type Year-4, and then
click
OK.
Note:
Use
Year-4 here because the Contoso Retail Sales database contains data for the calendar
years 2007, 2008, and 2009 only. The
Year-4 value causes the scorecard to display
information as of 2008 when the actual calendar year is 2012.
g) Click
OK to close the Dimensional Data Source Mapping dialog box.

5. In the center pane, click the
Properties tab, and then specify the following settings:
•
In the
Name box, type Growth.
•
Optionally, in the
Description box, type a description for the KPI.
•
Optionally, in the
Person Responsible box, type the name of the person who is responsible for
sales growth.
•
Optionally, next to the
Display Folder box, click the Browse button, and then specify or create
a display folder for the KPI.
6. In the
Workspace Browser, right-click the Growth KPI, and then click Save.
After creating the KPIs for the Financial Perspective, the next step is to create KPIs for the Customer
Perspective.
This section describes how to create the following three KPIs:
•
Customer Perspective
•
Customer Satisfaction
•
Market Share
Begin by creating the Customer Perspective KPI. Because this is an objective KPI that resembles the
Financial Perspective KPI, you can create a copy of the Financial Perspective KPI, and then change its
name and other details.
To create the Customer Perspective KPI
1. In the
Workspace Browser, right-click the Financial Perspective KPI, and then click Copy.
2. In the
Workspace Browser, point to a folder such as PerformancePoint Content (or to a display
folder in the
PerformancePoint Content section), right-click to open a shortcut menu, and then
click
Paste.
A copy of the Financial Perspective KPI opens for editing, with the
Editor tab open in the center
pane.
3. In the center pane, click the
Properties tab, and then specify the following settings:
•
In the
Name box, type Customer Perspective.
•
Optionally, in the
Description box, type a description for the KPI.
•
Optionally, in the
Person Responsible box, type the name of the person who is responsible for
maintaining a healthy customer perspective.
•
Optionally, next to the
Display Folder box, click the Browse button, and then specify or create
a display folder for the KPI.
4. In the
Workspace Browser, right-click the Customer Perspective KPI, and then click Save.
The next step is to create the Customer Satisfaction KPI. Different organizations measure customer
satisfaction in different ways, often using complex formulas that are outside the scope of the Balanced
Scorecard. For this KPI, assume that customer satisfaction data comes from a third-party application,
and use fixed values to configure the Customer Satisfaction KPI.
To create the Customer Satisfaction KPI
1. On the
Create tab, click KPI.

The
Select a KPI Template dialog box appears.
2. Click
Blank KPI, and then click OK.
The new KPI opens for editing with the
Editor tab open in the center pane.
3. Configure the Actual value for the KPI by following these steps:
a) In the
Actual row, in the Data Mappings column, click the blue hypertext that says 1 (Fixed
Values).
b) In the
Fixed Values Data Source Mapping dialog box, in the Value box, type 8.1, and then
click
OK.
4. Configure the Target value for the KPI by following these steps:
a) In the
Target row, in the Data Mappings column, click the blue hypertext that says 1 (Fixed
Values).
b) In the
Fixed Values Data Source Mapping dialog box, in the Value box, type 7.5, and then
click
OK.
5. In the center pane, click the
Properties tab, and then specify the following settings:
•
In the
Name box, type Customer Satisfaction.
•
Optionally, in the
Description box, type a description for the KPI.
•
Optionally, in the
Person Responsible box, type the name of the person who is responsible for
guaranteeing customer satisfaction.
•
Optionally, next to the
Display Folder box, click the Browse button, and then specify or create
a display folder for the KPI.
6. In the
Workspace Browser, right-click the Customer Satisfaction KPI, and then click Save.
After creating a Customer Satisfaction KPI, the next step is to create the Market Share KPI. Similar to
the Customer Satisfaction KPI, assume that the data for this KPI comes from a third-party application,
and use fixed values to configure the Market Share KPI.
To create the Market Share KPI
1. On the
Create tab, click KPI.
The
Select a KPI Template dialog box appears.
2. Click
Blank KPI, and then click OK.
The new KPI opens for editing with the
Editor tab open in the center pane.
3. Configure the Actual value for the KPI by following these steps:
a) In the
Actual row, in the Data Mappings column, click the blue hypertext that says 1 (Fixed
Values).
b) In the
Fixed Values Data Source Mapping dialog box, in the Value box, type .05, and then
click
OK.
c) In the
Actual row, in the Number Format column, click the blue hypertext that says
(Default) to open the Format Numbers dialog box.
d) In the
Format list, select Percentage, and then click OK.
4. Configure the Target value for the KPI by following these steps:
a) In the
Target row, in the Data Mappings column, click the blue hypertext that says 1 (Fixed
Values).

b) In the
Fixed Values Data Source Mapping dialog box, in the Value box, type .10, and then
click
OK.
c) In the
Target row, in the Number Format column, click the blue hypertext that says
(Default) to open the Format Numbers dialog box.
d) In the
Format list, select Percentage, and then click OK.
5. In the center pane, click the
Properties tab, and then specify the following settings:
•
In the
Name box, type Market Share.
•
Optionally, in the
Description box, type a description for the KPI.
•
Optionally, in the
Person Responsible box, type the name of the person who is responsible for
increasing market share.
•
Optionally, next to the
Display Folder box, click the Browse button, and then specify or create
a display folder for the KPI.
6. In the
Workspace Browser, right-click the Market Share KPI, and then click Save.
After creating KPIs for the Customer perspective, the next step is to create KPIs for the Internal
perspective.
This section describes how to create the following four KPIs:
•
Internal Perspective
•
Inventory Turnover
•
Resource Usage
•
Order Fulfillment
Begin by creating the Internal Perspective objective KPI. This KPI does not require a data source or
specific actual and target values.
To create the Internal Perspective KPI
1. In Dashboard Designer, in the
Workspace Browser, click PerformancePoint Content.
2. On the
Create tab, click KPI.
3. In the
Select a KPI Template dialog box, click Objective, and then click OK.
The KPI opens for editing with the
Editor tab open in the center pane.
4. In the center pane, click the
Properties tab, and then specify the following settings:
•
In the
Name box, type Internal Perspective.
•
Optionally, in the
Description box, type a description for the KPI.
•
Optionally, in the
Person Responsible box, type the name of the person who is responsible for
overall financial performance.
•
Optionally, next to the
Display Folder box, click the Browse button, and then specify or create
a display folder for the KPI.
5. In the
Workspace Browser, right-click the Internal Perspective KPI, and then click Save.
After creating the Internal Perspective KPI, the next step is to create the Inventory Turnover KPI.
Inventory turnover is typically calculated by dividing the total cost of goods sold by the average dollar
value of inventory available. To create the Inventory Turnover KPI, this example uses Calculated

Metrics by using two data sources and Time Intelligence for the Actual value, and a fixed value for the
Target value.
To create the Inventory Turnover KPI
1. On the
Create tab, click KPI.
2. In the
Select a KPI Template dialog box, click Blank KPI, and then click OK.
The KPI opens for editing with the
Editor tab open in the center pane.
3. Configure the
Actual value for this KPI by following these steps:
a) In the
Actual row, in the Data Mappings column, click the blue hypertext that says 1
(Fixed values).
The
Fixed Values Data Source Mapping dialog box appears.
b) Click the
Change Source button to open the Select a Data Source dialog box.
c) Select the
Calculated Metric tab, in the Templates section, click Blank Calculation, and
then click
OK.
The
Calculated Metrics Data Source Mapping dialog box appears.
d) In the
Name box, select the text that says Value1, and then type CostOfSales.
e) In the
Source column for the CostOfSales row, click the blue hypertext that says 1 (Fixed
Values).
The Fixed Values Data Source Mapping dialog box appears.
f) Click
Change Source to open the Select a Data Source dialog box.
g) Select the Contoso Retail Sales data source, and then click
OK.
The
Dimensional Data Source Mapping dialog box appears.
h) In the
Select a measure list, select Sales Unit Cost.
i) In the
Select a dimension section, click New Time Intelligence Filter.
The
Time Formula Editor dialog box appears.
j) In the
Time formula pane, type Year-3:Year-4.
Note:
Use
Year-3:Year-4 here because the Contoso Retail Sales database contains data for the
calendar years 2007, 2008, and 2009 only. This formula causes the scorecard to display
information for the range of time from 2008 to 2009 when the actual calendar year is 2012.
k) Click
OK to close the Time Formula Editor dialog box, and then click OK to close the
Dimensional Data Source Mapping dialog box and return to the Calculated Metrics Data
Source Mapping dialog box.
l) In the
Calculated Metrics Data Source Mapping dialog box, in the Name box, select the
text that says
Value2, and type Inventory.
m) In the
Source column for the Inventory row, click the blue hypertext that says 1 (Fixed
Values).
The
Fixed Values Data Source Mapping dialog box appears.
n) Click
Change Source to open the Select a Data Source dialog box.
o) Select the Contoso Inventory data source that was created earlier, and then click
OK.
The
Dimensional Data Source Mapping dialog box appears.

p) In the
Select a measure list, select OnHandQuantity, and then click OK to close the
Dimensional Data Source Mapping dialog box and return to the Calculated Metrics Data
Source Mapping dialog box.
q) In the
Calculated Metrics Data Source Mapping dialog box, in the Formula box, type the
formula
CostOfSales/Inventory, and then click OK.
r) In the
Number column, click the blue hypertext that says (Default) to open the Format
Numbers dialog box.
s) In the
Format list, select Number, and then click OK.
4. Configure the Target value for this KPI by following these steps:
a) In the
Target row, in the Data Mappings column, click the blue hypertext that says 1
(Fixed values).
The
Fixed Values Data Source Mapping dialog box appears.
b) In the
Value box, type 30.
This is a fixed value that will represent 30 inventory cycles, a threshold for inventory
turnover. In this example, good performance means the company has had an inventory
turnover of at least 30 inventory cycles over a one-year period.
c) Click
OK to close the Fixed Values Data Source Mapping dialog box.
d) In the
Number column, click the blue hypertext that says (Default) to open the Format
Numbers dialog box.
e) In the
Format list, select Number, and then click OK.
5. In the center pane, click the
Properties tab, and then specify the following settings:
•
In the
Name box, type Inventory Turnover.
•
Optionally, in the
Description box, type a description for the KPI.
•
Optionally, in the
Person Responsible box, type the name of the person who is responsible for
managing inventory turnover.
•
Optionally, next to the
Display Folder box, click the Browse button, and then specify or create
a display folder for the KPI.
6. In the
Workspace Browser, right-click the Inventory Turnover KPI, and then click Save.
After creating the Inventory Turnover KPI, the next step is to create the Resource Usage KPI. Resource
usage is typically calculated as a percentage of the time resources are used. In the example scorecard,
resource usage is calculated as a percentage of sales representatives’ time that is spent generating
sales. For this example, assume that the data for this KPI comes from a third-party application and use
fixed values to configure this KPI.
To create the Resource Usage KPI
1. On the
Create tab, click KPI.
2. In the
Select a KPI Template dialog box, click Blank KPI, and then click OK.
The KPI opens for editing with the
Editor tab open in the center pane.
3. Configure the Actual value for the KPI by following these steps:
a) In the
Actual row, in the Data Mappings column, click the blue hypertext that says 1 (Fixed
Values).

b) In the
Fixed Values Data Source Mapping dialog box, in the Value box, type .73, and then
click
OK.
c) In the
Actual row, in the Number column, click the blue hypertext that says (Default) to
open the
Format Numbers dialog box.
d) In the
Format list, select Percentage, and then click OK.
4. Configure the Target value for the KPI by following these steps:
a) In the
Target row, in the Data Mappings column, click the blue hypertext that says 1 (Fixed
Values).
b) In the
Fixed Values Data Source Mapping dialog box, in the Value box, type .75, and then
click
OK.
c) In the
Target row, in the Number column, click the blue hypertext that says (Default) to
open the
Format Numbers dialog box.
d) In the
Format list, select Percentage, and then click OK.
5. In the center pane, click the
Properties tab, and then specify the following settings:
•
In the
Name box, type Resource Usage.
•
Optionally, in the
Description box, type a description for the KPI.
•
Optionally, in the
Person Responsible box, type the name of the person who is responsible for
maintaining sufficient resource usage.
•
Optionally, next to the
Display Folder box, click the Browse button, and then specify or create
a display folder for the KPI.
6. In the
Workspace Browser, right-click the Resource Usage KPI, and then click Save.
After creating the Resource Usage KPI, the next step is to create the Order Fulfillment KPI. Order
fulfillment is typically calculated as a percentage of what merchandise is available at the time orders are
made. In our example scorecard, order fulfillment is calculated by dividing units in inventory by units
sold. For this example, assume that the data for this KPI comes from a third-party application and use
fixed values to configure this KPI.
To create the Order Fulfillment KPI
1. On the
Create tab, click KPI.
2. In the
Select a KPI Template dialog box, click Blank KPI, and then click OK.
The KPI opens for editing with the
Editor tab open in the center pane.
3. Configure the Actual value for the KPI by following these steps:
a) In the
Actual row, in the Data Mappings column, click the blue hypertext that says 1 (Fixed
Values).
b) In the
Fixed Values Data Source Mapping dialog box, in the Value box, type .81, and then
click
OK.
c) In the
Actual row, in the Number column, click the blue hypertext that says (Default) to
open the
Format Numbers dialog box.
d) In the
Format list, select Percentage, and then click OK.
4. Configure the Target value for the KPI by following these steps:
a) In the
Target row, in the Data Mappings column, click the blue hypertext that says 1 (Fixed
Values).

b) In the
Fixed Values Data Source Mapping dialog box, in the Value box, type .85, and then
click
OK.
c) In the
Target row, in the Number column, click the blue hypertext that says (Default) to
open the
Format Numbers dialog box.
d) In the
Format list, select Percentage, and then click OK.
5. In the center pane, click the
Properties tab, and then specify the following settings:
•
In the
Name box, type Order Fulfillment.
•
Optionally, in the
Description box, type a description for the KPI.
•
Optionally, in the
Person Responsible box, type the name of the person who is responsible for
maintaining order fulfillment.
•
Optionally, next to the
Display Folder box, click the Browse button, and then specify or create
a display folder for the KPI.
6. In the
Workspace Browser, right-click the Order Fulfillment KPI, and then click Save.
After creating the KPIs we need for the Internal perspective, the next step is to create KPIs for the
Learning and Growth perspective.
This section describes how to create the following three KPIs:
•
Learning and Growth Perspective
•
Employee Satisfaction
•
Training and Development
Begin by creating the Learning and Growth Perspective KPI, an objective KPI that does not require a
data source or specific target and actual values.
To create the Learning and Growth Perspective KPI
1. In Dashboard Designer, in the
Workspace Browser, click PerformancePoint Content.
2. On the
Create tab, click KPI.
3. In the
Select a KPI Template dialog box, click Objective, and then click OK.
The KPI opens for editing with the
Editor tab open in the center pane.
4. In the center pane, click the
Properties tab, and then specify the following settings:
•
In the
Name box, type Learning and Growth Perspective.
•
Optionally, in the
Description box, type a description for the KPI.
•
Optionally, in the
Person Responsible box, type the name of the person who is responsible for
overall financial performance.
•
Optionally, next to the
Display Folder box, click the Browse button, and then specify or create
a display folder for the KPI.
5. In the
Workspace Browser, right-click the Learning and Growth Perspective KPI, and then click
Save.
After creating the Learning and Growth Perspective KPI, the next step is to create the Employee
Satisfaction KPI. Similar to customer satisfaction rates, different companies measure employee
satisfaction in different ways. For this example scorecard, assume that the data for this KPI comes from
a third-party application and use fixed values to configure this KPI.

To create the Employee Satisfaction KPI
1. On the
Create tab, click KPI.
The
Select a KPI Template dialog box appears.
2. Click
Blank KPI, and then click OK.
The new KPI opens for editing with the
Editor tab open in the center pane.
3. Configure the Actual value for the KPI by following these steps:
a) In the
Actual row, in the Data Mappings column, click the blue hypertext that says 1 (Fixed
Values).
b) In the
Fixed Values Data Source Mapping dialog box, in the Value box, type .87, and then
click
OK.
c) In the
Actual row, in the Number column, click the blue hypertext that says (Default) to
open the
Format Numbers dialog box.
d) In the
Format list, select Percentage, and then click OK.
4. Configure the Target value for the KPI by following these steps:
a) In the
Target row, in the Data Mappings column, click the blue hypertext that says 1 (Fixed
Values).
b) In the
Fixed Values Data Source Mapping dialog box, in the Value box, type .95, and then
click
OK.
c) In the
Target row, in the Number column, click the blue hypertext that says (Default) to
open the
Format Numbers dialog box.
d) In the
Format list, select Percentage, and then click OK.
5. In the center pane, click the
Properties tab, and then specify the following settings:
•
In the
Name box, type Employee Satisfaction.
•
Optionally, in the
Description box, type a description for the KPI.
•
Optionally, in the
Person Responsible box, type the name of the person who is responsible for
maintaining employee satisfaction.
•
Optionally, next to the
Display Folder box, click the Browse button, and then specify or create
a display folder for the KPI.
6. In the
Workspace Browser, right-click the Employee Satisfaction KPI, and then click Save.
After creating the Employee Satisfaction KPI, the next step is to create the Training and Development
KPI. Different companies measure training and development in different ways. For this example
scorecard, measure performance for this KPI as measured by the percentage of employees who have
completed mandatory and recommended training programs. Assume that the data for this KPI comes
from a third-party application and use fixed values to configure this KPI.
To create the Training and Development KPI
1. On the
Create tab, click KPI.
The
Select a KPI Template dialog box appears.
2. Click
Blank KPI, and then click OK.
The new KPI opens for editing with the
Editor tab open in the center pane.
3. Configure the Actual value for the KPI by following these steps:

a) In the
Actual row, in the Data Mappings column, click the blue hypertext that says 1 (Fixed
Values).
b) In the
Fixed Values Data Source Mapping dialog box, in the Value box, type .75, and then
click
OK.
c) In the
Actual row, in the Number column, click the blue hypertext that says (Default) to
open the
Format Numbers dialog box.
d) In the
Format list, select Percentage, and then click OK.
4. Configure the Target value for the KPI by following these steps:
a) In the
Target row, in the Data Mappings column, click the blue hypertext that says 1 (Fixed
Values).
b) In the
Fixed Values Data Source Mapping dialog box, in the Value box, type .90, and then
click
OK.
c) In the
Target row, in the Number column, click the blue hypertext that says (Default) to
open the
Format Numbers dialog box.
d) In the
Format list, select Percentage, and then click OK.
5. In the center pane, click the
Properties tab, and then specify the following settings:
•
In the
Name box, type Training and Development.
•
Optionally, in the
Description box, type a description for the KPI.
•
Optionally, in the
Person Responsible box, type the name of the person who is responsible for
training and development.
•
Optionally, next to the
Display Folder box, click the Browse button, and specify or create a
display folder for the KPI.
6. In the
Workspace Browser, right-click the Training and Development KPI, and then click Save.
After creating all the KPIs for the example scorecard, the next step is to create a blank scorecard and
add the KPIs to it.
Create and assemble a scorecard
Earlier in this article, you created lots of KPIs. Some of those KPIs are objective KPIs, which means
those KPIs display performance for KPIs that are nested underneath the objective KPIs. To create the
scorecard, begin with a blank scorecard, add all the KPIs to the scorecard, and then configure a
hierarchy for the KPIs.
To create and assemble a scorecard for a Balanced Scorecard
1. In Dashboard Designer, in the
Workspace Browser, click PerformancePoint Content.
2. In the ribbon, on the
Create tab, in the Dashboard Items group, click Scorecard.
The Select a Scorecard template opens.
3. In the
Category pane, select Standard, in the Template pane, select Blank Scorecard, and then
click
OK. A blank scorecard opens for editing with the Editor tab open.
4. In the
Details pane, expand KPIs, and then expand PerformancePoint Content.
Locate the KPIs that you want to use for the scorecard.

5. From the
Details pane, drag one KPI at a time to the Drop items here section that is located on
the left side of the center pane. Make sure to add the KPIs in the order that is shown in the
following list so that each KPI is added below the previous KPI:
•
Financial Perspective
•
Increase Shareholder Value
•
Productivity
•
Growth
•
Customer Perspective
•
Customer Satisfaction
•
Market Share
•
Internal Perspective
•
Inventory Turnover
•
Resource Usage
•
Order Fulfillment
•
Learning and Growth Perspective
•
Employee Satisfaction
•
Training and Development
6. Click the
Increase Shareholder Value KPI to select it, and then, in the ribbon, on the Edit tab, in
the
Header group, click the Increase Indent toolbar command.
The Increase Shareholder Value KPI is now nested underneath the Financial Perspective KPI.
7. Click the
Productivity KPI, and then, on the Edit tab, click the Increase Indent toolbar command
two times to nest
Productivity underneath Increase Shareholder Value.
8. Click the
Growth KPI, and then, on the Edit tab, click the Increase Indent toolbar command two
times to nest
Growth underneath Shareholder Value. (This puts the Growth KPI at the same level
as the Productivity KPI.)
9. Click the
Customer Satisfaction KPI, and then, on the Edit tab, click the Increase Indent toolbar
command to nest
Customer Satisfaction underneath Customer Perspective.
10. Click the
Market Share KPI, and then, on the Edit tab, click the Increase Indent toolbar command
to nest
Market Share underneath Customer Perspective.
11. Click the
Inventory Turnover KPI, and then, on the Edit tab, click the Increase Indent toolbar
command to nest
Inventory Turnover underneath Internal Perspective.
12. Click the
Resource Usage KPI, and then, on the Edit tab, click the Increase Indent toolbar
command to nest
Resource Usage underneath Internal Perspective.
13. Click the
Order Fulfillment KPI, and then, on the Edit tab, click the Increase Indent toolbar
command to nest
Order Fulfillment underneath Internal Perspective.
14. Click the
Employee Satisfaction KPI, and then, on the Edit tab, click the Increase Indent toolbar
command to nest
Employee Satisfaction underneath Learning and Growth Perspective.
15. Click the
Training and Development KPI, and then, on the Edit tab, click the Increase Indent
toolbar command to nest
Training and Development underneath Learning and Growth
Perspective.
16. On the
Edit tab, in the View group, click Update.

The scorecard updates to show performance for all the KPIs.
17. In the center pane, click the
Properties tab, and then specify the following settings:
•
In the
Name box, type a name, such as Corporate Scorecard.
•
Optionally, in the
Description box, type a description for the scorecard.
•
Optionally, in the
Person Responsible box, type the name of the person who is responsible for
organizational performance.
•
Optionally, next to the
Display Folder box, click the Browse button, and then specify or create
a display folder for the scorecard.
18. In the
Workspace Browser, right-click the Corporate Scorecard, and then click Save.
After you have created a scorecard to use as part of a Balanced Scorecard, the next step is to create a
strategy map by using Dashboard Designer. For more information, see
Create and configure a strategy
map as part of a Balanced Scorecard that you create by using Dashboard Designer
Concepts
Create a Balanced Scorecard by using Dashboard Designer
Create and configure a strategy map as part of a
Balanced Scorecard that you create by using
Published: January 4, 2012
A Balanced Scorecard includes a scorecard and corresponding strategy map to display performance
across four main organizational areas or perspectives: financial perspective, customer perspective,
internal perspective, and learning and growth perspective.
This article describes how to create and configure an example PerformancePoint strategy map to use
as part of a Balanced Scorecard.
Tip:
To download a sample Visio diagram that you can use for a Balanced Scorecard, see
Visio Diagram for a Balanced Scorecard
(http://go.microsoft.com/fwlink/p/?LinkId=237627).
In this article
•
Create and configure a Visio diagram to use in a Balanced Scorecard
•
Create and configure a strategy map report by using Dashboard Designer
Create and configure a Visio diagram to use in a
In PerformancePoint Services, a strategy map report uses a Microsoft Visio diagram for its visual
structure and a scorecard for its data source. To create a strategy map, begin by creating and
configuring a Visio diagram. You can create and configure a Visio diagram in the following ways:

•
Open an existing Visio diagram and configure it
•
Create and configure a new Visio diagram
Tip:
Make sure that the Visio diagram contains enough sections and shapes to connect to the key
performance indicators (KPIs) that are used in the scorecard. The shapes in the Visio diagram
can be squares, rectangles, ovals, and so on. Do not use stencils or complex shapes in Visio
diagrams that you create for a Balanced Scorecard because the strategy map might not be
displayed correctly.
To download a sample diagram, see
Example Visio Diagram for a Balanced Scorecard
(http://go.microsoft.com/fwlink/p/?LinkId=237627).
To create and configure a Visio diagram
1. Click
Start, click All Programs, click Microsoft Office, and then click Microsoft Visio 2010.
Microsoft Visio opens and displays a list of templates.
2. On the
File tab, in the Template Categories group, click General, click Basic Diagram, and then
click
Create.
A new drawing opens.
3. In the
Shapes pane, select Basic Shapes to display a list of available shapes.
4. From the
Shapes pane, drag a shape to the drawing. Repeat for each shape that you want to add.
5. To edit a shape, do any of the following:
a) To change the size of a shape, point to a side selection handle. Then press and hold the
mouse button and drag the handle to resize the shape.
b) To move a shape, click to select it, and then use the directional arrow keys on the keyboard
to move the shape to a different location.
c) To optionally add text to a shape, double-click the shape, and then type the text that you
want to use.
d) To optionally edit font settings for text in a shape, double-click a shape that contains text to
select the text. Then, on the
Home tab, in the Font group, use the available toolbar
commands to edit the font that is used in the shape.
6. On the
File tab, click Save As, and save the file to your computer.
After you create the Visio diagram, proceed to
Create and configure a strategy map report by using
.
To configure an existing Visio diagram
1. Open an existing Visio diagram for editing.
Tip:
To download a sample Visio diagram that you can use for a Balanced Scorecard,
see
Example Visio Diagram for a Balanced Scorecard
(http://go.microsoft.com/fwlink/p/?LinkId=237627).
2. In the
Shapes pane, select Basic Shapes to display a list of available shapes.
3. To add a shape from the
Shapes pane, drag a shape to the drawing.
4. To remove a shape, click the shape to select it, and then press the Delete key on the keyboard.

5. To edit a shape, do any of the following steps:
a) To change the size of a shape, point to a side selection handle. Then press and hold the
mouse button, and drag the handle to resize the shape.
b) To move a shape, click to select it, and then use the directional arrow keys on the keyboard
to move the shape to a different location.
c) To optionally add text to a shape, double-click the shape, and then type the text that you
want to use.
d) To optionally edit font settings for text in a shape, double-click a shape that contains text to
select the text. Then, on the
Home tab, in the Font group, use the available toolbar
commands to edit the font that is used in the shape.
6. On the
File tab, click Save to save your changes.
After you configure a Visio diagram, the next step is to create a strategy map report by using
Dashboard Designer.
Create and configure a strategy map report by using
Important:
Before you begin to perform the following procedures, verify that the following prerequisites are
in place:
•
You have at least Design permissions assigned to you in SharePoint Server.
•
You have at least Read permissions assigned to you in the SQL Server databases that are
used.
•
Dashboard users have at least Read permissions assigned in SharePoint Server and in SQL
Server.
To create a strategy map for use in a Balanced Scorecard
1. Click
Start, click All Programs, click SharePoint, and then click PerformancePoint Dashboard
Designer.
2. In the
Workspace Browser, click PerformancePoint Content.
3. On the
Create tab, in the Reports group, click Strategy Map.
The Create a Strategy Map Report wizard opens.
4. On the
Select a Scorecard page, select the scorecard that you created for the Balanced
Scorecard, and then click
Finish.
The strategy map opens for editing with the
Editor tab open in the center pane.
5. In the ribbon, on the
Edit tab, click Edit Strategy Map.
The
Strategy Map Editor dialog box appears.
6. In the
Strategy Map Editor dialog box, click Import Visio File, browse to where the Visio diagram
is saved, and then click
Open.
7. In the
Strategy Map Editor dialog box, click a shape to select it, and then click Connect Shape.
The
Connect Shape dialog box appears and displays the scorecard that was selected for the
strategy map.

8. In the
Connect Shape dialog box, take the following steps:
a) Click a cell in the
Target column that corresponds to the KPI that you want to connect to the
shape. (The
Target column contains graphical indicators.)
b) To optionally replace the text inside the shape with the text that is used for the scorecard
KPI, select the check box next to
Show KPI name in shape text.
c) Click
Close.
The shape changes color to according to the KPI that is connected to it.
9. Repeat steps 7 and 8 for each shape in the diagram.
10. After connecting shapes to KPIs, click
Apply to close the Strategy Map Editor dialog box.
The strategy map appears on the
Editor tab in the center pane of the workspace.
11. In the center pane, click the
Properties tab, and then specify the following settings:
•
In the
Name box, type a name such as Strategy Map for the strategy map report.
•
To optionally provide a description for the report, type a description in the
Description box.
•
To optionally specify a display folder for the report, next to the
Display Folder box, click the
Browse button, and then select or create a folder.
12. In the
Workspace Browser, right-click the report, and then click Save.
The next step is to create a dashboard page and assemble the Balanced Scorecard. Proceed
to
Assemble and publish a Balanced Scorecard by using Dashboard Designer
Concepts
Create a Balanced Scorecard by using Dashboard Designer

Assemble and publish a Balanced Scorecard by
Published: January 4, 2012
A Balanced Scorecard provides a high-level view of organizational performance at a glance. In
PerformancePoint Services, a Balanced Scorecard consists of a dashboard page that contains a
scorecard and corresponding strategy map. The scorecard and strategy map show performance
information for key performance indicators (KPIs) across four main perspectives: the financial
perspective, the customer perspective, the internal perspective, and the learning and growth
perspective. This article describes how to assemble and publish a Balanced Scorecard by using
PerformancePoint Dashboard Designer.
Tip:
The procedures in this article assume that you have already created and configured a
scorecard and its corresponding strategy map report by using Dashboard Designer. For more
information, see the following resources:
•
Create a Balanced Scorecard by using Dashboard Designer
•
Create a scorecard for a Balanced Scorecard by using Dashboard Designer
•
Assemble and publish a Balanced Scorecard
After you have created a scorecard and strategy map, use the following process to assemble and
publish a Balanced Scorecard:
1. Create a dashboard page by using Dashboard Designer
2. Add the scorecard and strategy map to the dashboard page
3. Publish the dashboard
Important:
Before you begin to perform the tasks that are described in this article, verify that the following
prerequisites are met:
•
A scorecard and strategy map are already created.
•
Microsoft Visio Viewer is installed on every computer where the dashboard will be viewed. To
download Visio Viewer, see
(http://go.microsoft.com/fwlink/p/?LinkId=237626).
•
You have at least Design permissions assigned to you in SharePoint Server.
•
You have at least Read permissions assigned in the SQL Server databases that are used for
the scorecard.
•
Dashboard users have at least Read permissions assigned in SharePoint Server and in the
SQL Server databases that are used.

For more information, see
Authorization and permissions in PerformancePoint Services
Begin by creating a dashboard page.
To create a dashboard page for a Balanced Scorecard
1. In Dashboard Designer, in the
Workspace Browser, click PerformancePoint Content.
2. On the
Create tab, in the Dashboard Items group, click Dashboard.
The
Select a Page Layout Template dialog box appears.
3. For best results, select the
2 Columns template, and then click OK.
A dashboard page opens for editing with the
Editor tab open in the center pane.
4. On the
Editor tab, in the Pages section, select the default text that says Page 1 and type a name
such as
Summary for the page.
5. In the center pane, click the
Properties tab, and then specify the following settings:
•
In the
Name box, type Balanced Scorecard.
•
Optionally, in the
Description box, type a description for the dashboard.
•
Optionally, in the
Person Responsible box, type the name of the person responsible for
overall organizational performance.
•
Optionally, next to the
Display Folder box, click the Browse button, and then select or create a
display folder for the dashboard.
6. In the
Workspace Browser, right-click the Balanced Scorecard dashboard, and then click Save.
Do not close Dashboard Designer. Keep it open for the following procedure.
The next step is to add the scorecard and the strategy map to the dashboard.
To add the scorecard and the strategy map to the dashboard page
1. Begin with the Balanced Scorecard dashboard page open for editing. In the center pane, click the
Editor tab.
2. In the
Details pane, expand Scorecards, and then expand PerformancePoint Content to locate
the scorecard that was created for the Balanced Scorecard.
3. From the
Details pane, drag the scorecard to the Left Column zone in the center pane.
4. In the
Details pane, expand Reports, and then expand PerformancePoint Content to locate the
strategy map report that was created for the Balanced Scorecard.
5. From the
Details pane, drag the strategy map to the Right Column zone in the center pane.
6. In the
Workspace Browser, right-click the Balanced Scorecard dashboard, and then click Save.
Do not close Dashboard Designer. Keep it open for the following procedure.
The final step is to publish the dashboard to SharePoint Server.
To publish the Balanced Scorecard dashboard
1. Begin with the Balanced Scorecard dashboard page open for editing. In the center pane, click the
Properties tab.
2. In the
Deployment Properties section, take the following steps:
a) Next to the
Document Library box, click Browse to open the Document Library dialog
box. Select
Dashboards, and then click OK.

b) In the
Master Page list, select a template, such as v4.
c) Select the
Include page list for navigation check box.
3. In the
Workspace Browser, right-click the Balanced Scorecard dashboard, and then click Save to
save the publishing settings.
4. In the
Workspace Browser, right-click the Balanced Scorecard dashboard, and then click Deploy
to SharePoint.
The dashboard is published to SharePoint Server and opens in a browser window.
Concepts
Create a Balanced Scorecard by using Dashboard Designer
Document Outline
- Cover
- Contents
- Create a Balanced Scorecard by using Dashboard Designer
- Create a scorecard for a Balanced Scorecard by using Dashboard Designer
- Create and assemble a scorecard
- Create and configure a strategy map as part of a Balanced Scorecard that you create by using Dashboard Designer
- Assemble and publish a Balanced Scorecard by using Dashboard Designer
Wyszukiwarka
Podobne podstrony:
Get started with SharePoint Server 2010
BALANCED SCORECARD PROJEKTU pusty dla studentów
MS Project 2010 i MS Project Server 2010 Efektywne zarzadzanie projektem i portfelem projektow pro21
Balanced Scorecard synteza wskazniki 2011
Balanced Scorecard demo
Balanced Scorecard, ZARZĄDZANIE, RACHUNKOWOŚĆ, Rachunkowość(3)
Balanced Scorecard, Balanced Scorecard - Strategiczna Karta Wyników
MS Project 2010 i MS Project Server 2010 Efektywne zarzadzanie projektem i portfelem projektow pro21
BALANCED SCORECARD PROJEKTU pusty dla studentów
MS Project 2010 i MS Project Server 2010 Efektywne zarzadzanie projektem i portfelem projektow
MS Project 2010 i MS Project Server 2010 Efektywne zarzadzanie projektem i portfelem projektow pro21
Balanced Scorecard
Microsoft Lync Server 2010 Resource Kit Chapter 04 Conferencing and Collaboration
SharePoint Server 2016 Reviewer s Guide
biznes i ekonomia ms project 2010 i ms project server 2010 efektywne zarzadzanie projektem i portfel
SharePoint Server 2016 Quick Start
Test Lab Guide eBook for SharePoint Server 2013 Intranet and Team Sites
Microsoft Lync Server 2010 Security Guide
więcej podobnych podstron