
Demand Forecasting
(Part One)
Harry Kogetsidis
School of Business

Lecture’s topics
• How can forecasting methods be used to
predict demand?
• How does the method of exponential
smoothing work?
• How do we measure forecast accuracy?

Forecasting demand
Capacity decisions are often based on estimates
of
customer demand (
demand forecasting
).
A number of
forecasting methods
can be used to
produce estimates of customer demand.
Time series forecasting

Forecasting demand
Time series forecasting
:
the type of forecasting where the value of a
variable
is predicted based on its past performance.

Forecasting demand
Assumptions made:
• the past is a good guide to the future
• past tendencies or patterns will continue in
the future

Time Series Components
• Trend component
• Seasonal component
• Cyclical component
• Irregular component
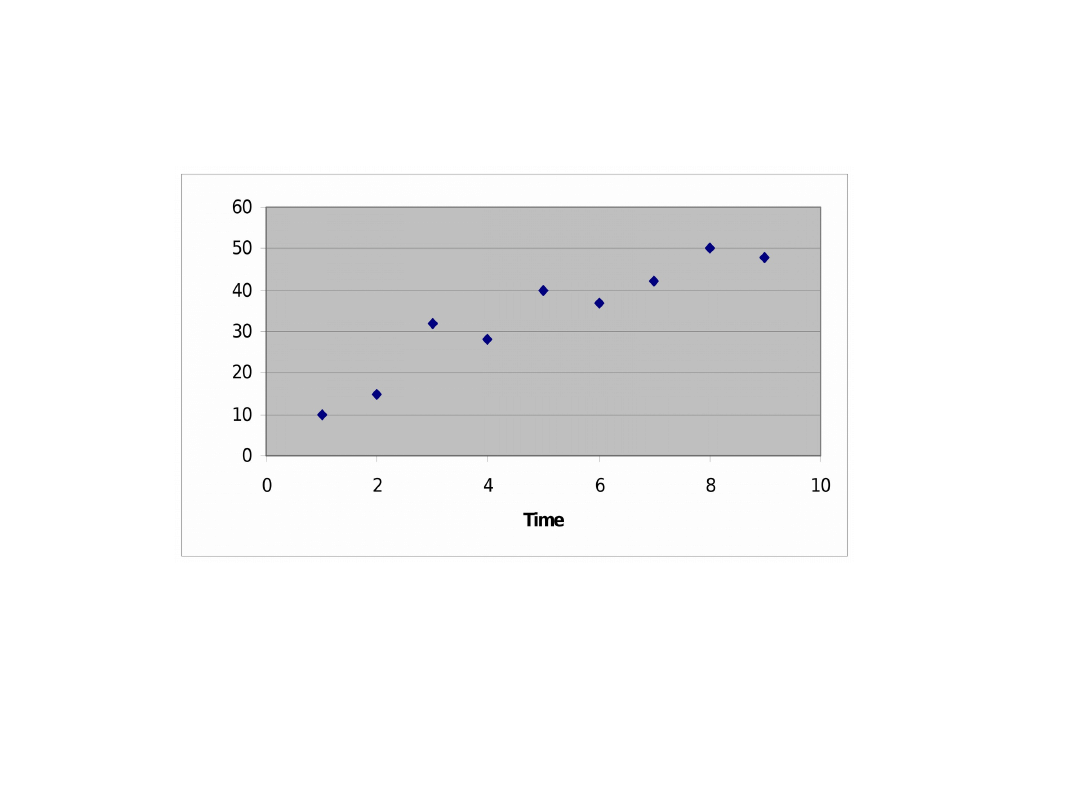
Increasing trend
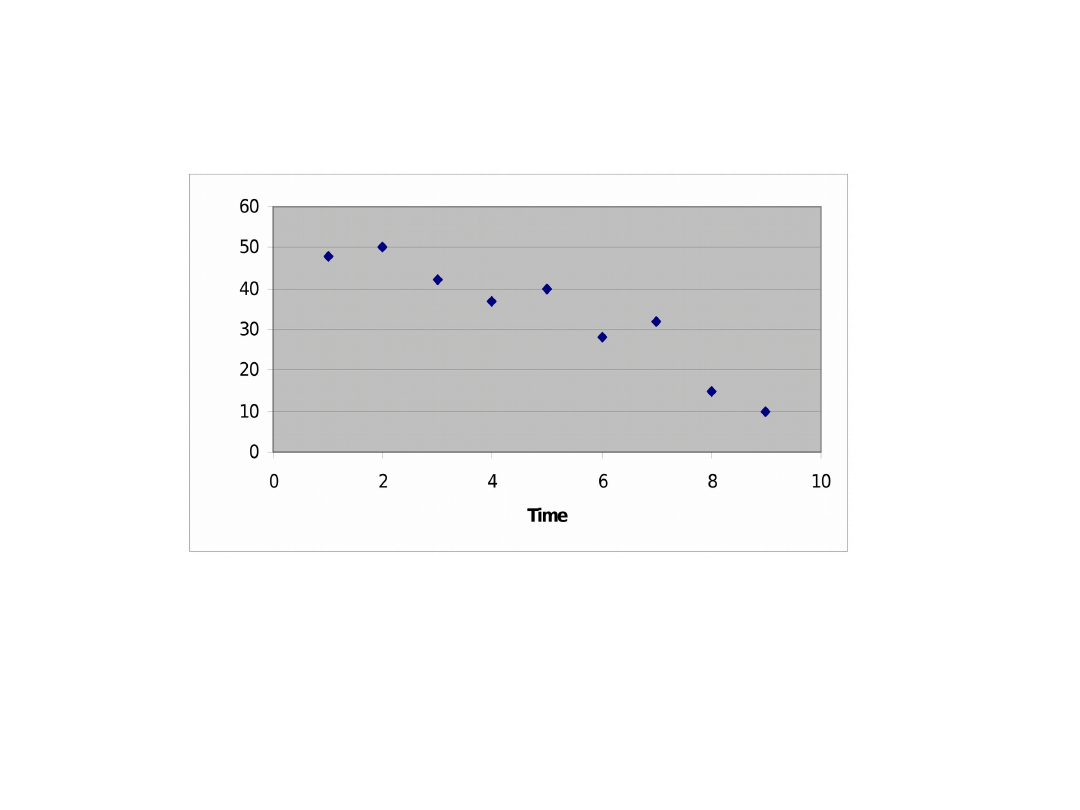
Decreasing trend
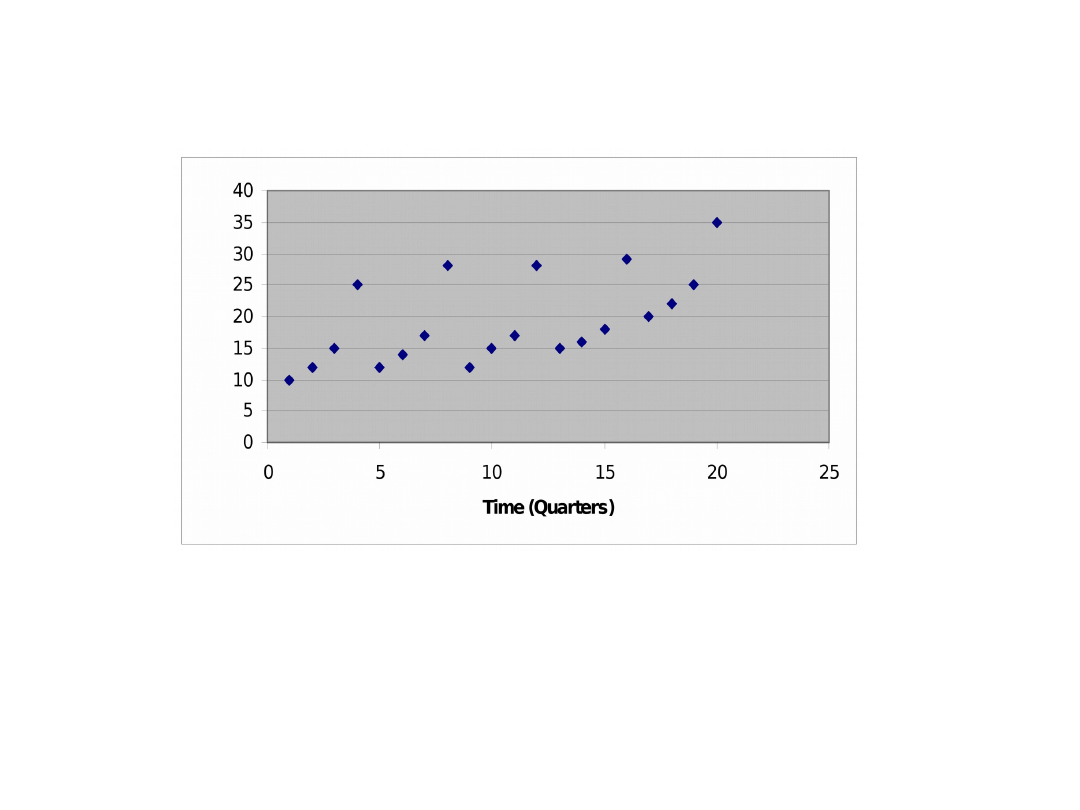
Seasonal variation
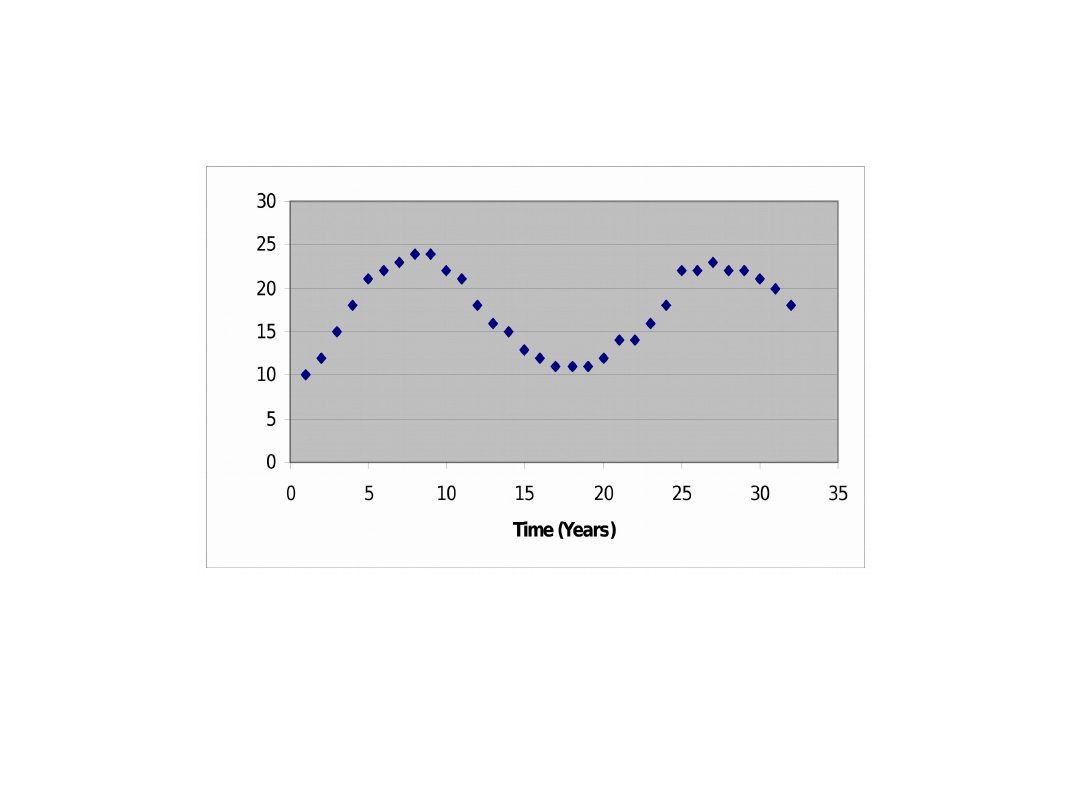
Cyclical variation

An example of a time series
Period
Y
t
Jan 20
Feb 24
Mar 27
Apr 31
May 37
Jun 47
Jul
53
Aug 62
Sep
?
Method of Exponential Smoothing
A simple time series forecasting method with
low
data requirements.
The method aims to smooth out
random
fluctuations
in the data values.
irregular component

Method of Exponential Smoothing
smoothing constant
F
t
= F
t-1
+ (Y
t-1
– F
t-1
)
actual demand predicted demand
Simple exponential smoothing (=0.8)
Period
Y
t
F
t
Jan 20
20.0
Feb 24
Mar 27
Apr 31
May 37
Jun 47
Jul
53
Aug 62
Sep
F
t
= F
t-1
+ (Y
t-1
– F
t-1
)
Simple exponential smoothing (=0.8)
Period
Y
t
F
t
Jan 20
20.0
Feb 24
Mar 27
Apr 31
May 37
Jun 47
Jul
53
Aug 62
Sep
F
t
= F
t-1
+ (Y
t-1
– F
t-1
)

Simple exponential smoothing (=0.8)
Period
Y
t
F
t
Jan 20
20.0
Feb 24
..
Mar 27
..
Apr 31
..
May 37
..
Jun 47
..
Jul
53 ..
Aug 62
..
Sep
..

Measuring forecast accuracy
How can we measure the accuracy of our
forecasts?
A number of forecast error measures have
been
suggested.

Mean Absolute Deviation
|e
t
|
MAD = ----------
n

Mean Absolute Percentage Error
|e
t
/Y
t
|
MAPE = -------------- x 100
n

Simple exponential smoothing (=0.8)
Period
Y
t
F
t
|e
t
| |
e
t
/Y
t
|
Jan 20
20.0
Feb 24
20.0 .. ..
Mar 27
23.2 .. ..
Apr 31
26.2 ..
..
May 37
30.1 ..
..
Jun 47
35.6 ..
..
Jul
53 44.7 ..
..
Aug 62
51.3 ..
..
Sep 59.9
Document Outline
- Demand Forecasting (Part One)
- Lecture’s topics
- Forecasting demand
- Slide 4
- Slide 5
- Time Series Components
- Increasing trend
- Decreasing trend
- Seasonal variation
- Cyclical variation
- An example of a time series
- Method of Exponential Smoothing
- Method of Exponential Smoothing
- Simple exponential smoothing (=0.8)
- Slide 15
- Slide 16
- Measuring forecast accuracy
- Mean Absolute Deviation
- Mean Absolute Percentage Error
- Slide 20
Wyszukiwarka
Podobne podstrony:
Section 2 student notes
Section 9 student notes
Section 3 student notes
Section 7 student notes
Section 4 student notes
Section 5 student notes
Section 1 student notes
Section 8 student notes
Section 10 student notes
Section 11 student notes
Posadzki section 2 1 studenci
Posadzki section 2 3 studenci
Posadzki section 3 studenci
Posadzki section 1 studenci
Posadzki section 2 studenci
Posadzki section 2 2 studenci
17 Steps to Better Presentations Student Notes
więcej podobnych podstron